Università degli Studi della Tuscia di Viterbo
Dipartimento di Scienze Ecologiche e Biologiche
Dottorato di ricerca in Genetica e Biologia Cellulare – XXIV° CICLO
Peroxiredoxin-2: Oligomeric characterization of a putative biomarker
of oxidative stress in the blood storage scenario
BIO 11
Coordinator Prof. Giorgio Prantera
-"Ora ajutami ad uscirne, - disse alla fine Zi' Dima. Ma quanto larga di pancia, tanto quella giara era stretta di collo. Zi' Dima, nella rabbia, non ci aveva fatto caso. Ora, prova e riprova, non trovava più il modo di uscirne. E il contadino, invece di dargli ajuto, eccolo là, si torceva dalle risa. Imprigionato, imprigionato lì, nella giara da lui stesso sanata e che ora - non c'era via di mezzo - per farlo uscire, doveva essere rotta daccapo e per sempre.
Chapter 1. Introduction
1.1 Blood 2 1.2 Erythrocytes 3 1.2.1 Erythrocytes membrane 3 1.2.2 Haemoglobin 6 1.2.3 Erythrocytes metabolism 7 1.3 Erythrocytes storage 9 1.3.1 Historic evolution 9 1.3.2 Blood fractionation 101.4 Erythrocytes storage lesions 11
1.4.1 Metabolic storage lesions 11
1.4.2 Enzymatic storage lesions 13
1.4.3 Physical storage lesions 13
1.4.4 Oxidative storage lesions 14
1.5 Antioxydative enzymatic defence 17
1.6 Peroxiredoxins 19
1.6.1 Mechanisms of regulation of Peroxiredoxins 19
1.6.2 Oligomerization of Peroxiredoxins 22
1.7 Aim of the thesis 24
Chapter 2. Materials and methods
2.1 Sampling 27
2.2 Deoxygenating treatment 27
2.3 RBC membrane preparation and trapping of PrxII in its native state 27
2.4 Gel electrophoresis 28
2.4.1 1D-SDS PAGE 28
2.4.2 Clear Native PAGE of cytosolic proteins 29
2.4.3 Blue Native PAGE of membrane proteins 29
2.4.4 2D CN/BN –SDS PAGE 29
2.5 Immunoblotting 30
2.10 Statistical analysis 32
Chapter 3. Results
3.1 Presence of cytoplasmic proteins in ghost membranes 34 3.2 Effect of atmospheric oxygen on protein migration 35 3.3 PrxII membrane migration: evaluation of interindividual variability 37 3.4 Native structure of erythrocyte PrxII as a consequence of storage
dependent oxidative stress 40
3.4.1 Influence of red cell age 40
3.4.2 Oligomeric conformation of PrxII at 0-day storage 42 3.4.3 Oligomeric conformation of PrxII at 28-day storage 45
3.5 Peroxidase activity 47
Chapter 4. Discussion
4.1 PrxII as a candidate biomarker to test oxidative stress levels
of stored red blood cells under blood bank conditions 50 4.2 Oxidative stress-dependent oligomeric status of erythrocyte peroxiredoxin II (PrxII) during storage under standard blood banking conditions 53
4.2.1 Prx in partially reduced system (0-day storage) 54
4.2.2 Prx in oxidized system (28-day storage) 56
C
C
h
h
a
a
p
p
t
t
e
e
r
r
1
1
I
1.1 Blood
Blood is an animal connective tissue that is assigned to the transport of substances, nutrients, wastes, and oxygen inside the body. Its color is tipically red, more or less dark relying on its oxygenation status. In vertebrates it constitutes the 8-9 % of the total body weight, corresponding to an average volume of 5 liters. Blood pH is used to stay within a very narrow range from 7.35 to 7.45. The maintenance of such values is performed by blood solutes and organs such as lungs and kidneys. The solutes mainly involved in pH control belong to intracellular buffers as phosphate (H2PO4- ↔ HP042-) and carbonate (HCO3- ↔ H2CO3)
buffers. Proteins like carbonic anhydrase are players in these balances through their catalytic activity. Nevertheless, hemoglobin as well contributes to proton management being one of the main blood H+ acceptor/donor. Finally, lungs and kidneys work by regulation of pO2 and
filtration of electrolytes, respectively.
Blood is certainly the most complex animal tissue, being composed of several kinds of cells (blood corpuscolate component) suspended in plasma. The special fluid-dynamic characteristic of blood allows it to flow through capillary vessels with less resistance than plasma itself.
Figure 1. Hemopoiesis.
Thrombocytes, also called platelets, are the cell type involved in hemostasis, the complex process that bring to blood coagulation. Leukocytes, or white blood cells, are responsible of the body defence against viral and bacterial infections. Erythrocytes are the most abundant
blood cells. Their percentage (45 % for men and 40 % for women) is called either Hematocrit (Hct), or packed cell volume (PCV), or erythrocyte volume fraction (EVF) and in mammals is independent from body-size.
1.2 Erythrocytes
Erythrocytes, or red blood cells (RBCs), are anucleated cells with a typical biconcave shape (7µm diameter x 2µm thickness x 90µm3 of volume) (Fig. 2); in the human species they are around 5000000 in males and 4500000 in females.
Figure 2. Red blood cell.
The process by which they are produced from the hemocytoblast is called erythropoiesis (from Greek poiesis for “production”) that in mammals takes place in different organs depending from the life stage of the individual. In particular, in the early stages of fetus, it occurs in the yolk sac, while later on it is moved to spleen and liver. Already in the sixth month after fertilization, the erithropoiesis depends on the bone marrow, that will remain the location for all the rest of life span. Erythropoietin is the hormone responsible for erythropoiesis and it is produced from kidneys in conditions of low O2 pressure.
In non-pathological conditions, a human red blood cell lives 120 days, 10 of which inside the bone marrow and the remaining in the cardiovascular system. Their removal (hemocatheresis, from Greek kathairesis for destruction) occurs in the spleen and, to a lesser extent, in the liver and in the bone marrow itself.
1.2.1 Erythrocyte membrane
The structural organization of the red cell membrane enables it to undergo strong deformation and to maintain the characteristic biconcave shape for all the life span. The membrane is basically made up of lipidic bilayer (about 40 %), with an equal proportion by weight of
cholesterol and phospholipids [Walensky et al., 2003], and proteic fraction (about 52 %). Phospholipids show an asymmetrically distribution between the two sides of leaflet; in particular, phosphatidylcholine and sphingomyelin are predominantly located in the outer monolayer, while most phosphatidylethanolamine and all phosphatidylserine (PS), together with the minor phosphoinositide constituents, are confined to the inner monolayer [Mohandas and Gallagher, 2008]. The unequal distribution of lipids has functional role in communication, for instance with immune system. Macrophages recognize erythrocytes that expose PS at the outer surface and so its usual confinement in the inner surface of the membrane is needed to preserve red cells from a premature removal from the cardiovascular system.
More than 100 different proteins compose the red cell membrane and can be classified as integral (transmembrane) and peripheral. The latter are linked to the cytoplasmic surface of the lipid bilayer and constitute the so called cytoskeleton that coats the inner membrane layer of the whole cell (Fig. 3).
Nowadays more than 50 transmembrane proteins has been characterized with around 25 antigen species involved in the blood group definition.
The other kinds of integral proteins exhibit diverse functional heterogeneity, serving as transport proteins, adhesion proteins involved in interactions of red cells with other blood cells and endothelial cells, signaling receptors, and other still undefined activities.
Band 3, one of the most abundant integral proteins, is a glycoprotein. Its transmembrane domain serves as an anion transporter for molecules such as HCO3- and Cl-. The cytoplasmic
domain contains the binding sites for several proteins (hemoglobin, protein 4.1, ankyrin and glycolytic enzymes) and it also functions as anchorage of the cytoskeleton to the lipid bilayer. Glicophorins are a group of sialoglycoproteins that, thanks to the carbohydrate residues at the outer surface of the membrane, confer a strong net negative charge to the red cell, preventing them from adhering to the endothelium and aggregating each other. [Bossi and Giardina, 1996]. Other membrane proteins with transport function include aquaporin 1 (water transporter), Glut1 (glucose and L-dehydroascorbic acid transporter), Kidd antigen protein (urea transporter), RhAG (Rh associated glycoprotein, ammonium and carbon dioxide transporter), Na+-K+-ATPase, Ca++ ATPase, Na+-K+-2Cl- cotransporter, Na+-Cl- cotransporter, Na+-K+ cotransporter, K+-Cl- cotransporter, and Gardos Channel.
Figure 3. RBC membrane protein organization.
On the other hand, the cytoskeleton proteins are an organized network comprising major (e.g. α- and β-spectrin, actin, protein 4.1, ankyrin) and minor components (protein 4.2, dematin (4.9), α- and β-adducin, tropomyosin, tropomodulin etc.), many of which interact not only with each other, but also with proteins and lipids of the membrane [Pasini et al., 2009]. The membrane deformation is possible thanks to modulation of the cytoskeleton structure between extended and compressed form. By the way, the key component of the cytoskeletal network is spectrin, a tetrameric protein (α2β2), the mainly involved in membrane deformability/stability
and also in lateral mobility of band 3. α- and β-spectrins form an antiparallel heterodimer and their attachment to the membrane is mediated from two kinds of protein complexes. One is based both on the interaction of spectrin with ankyrin and on this last with band 3 protein while the other on the spectrin interaction with band 4.1, p55 and finally glycophorin C. Thanks to two possible protein conformations, one highly coiled, helical state and one rod-like, spectrin owns spring-like behaviour that confers high flexibility and extensibility/contractile properties.
The participation of actin in the protein junctional complexes is important as the ratio polymerized/depolymerized actin controls membrane flexibility, which increases when actin polymerization is inhibited. The tight control over this ratio is exercised by four minor proteins: tropomodulin, tropomyosin, αβ-adducin heterodimers [Joshi et al., 1991; Katagiri et al., 1996] and dematin (protein 4.9). Tropomodulin–tropomyosin complexes stabilize the
short RBC actin filaments strengthening the spectrin–actin interactions, by capping its slow growing or pointed end filaments [Fowler et al., 1993], while dematin (protein 4.9) bundles actin filaments into cables and adducins are involved in both the capping and bundling of actin filaments [Hughes and Bennet, 1995]. Adducins also play a role in the early assembly of the spectrin–actin complexes forming a spectrin–actin–adducin ternary complex.
1.2.2 Haemoglobin
The main function of red cells is oxygen transport to tissues and that is possible thanks to a metalloprotein, haemoglobin, firstly described from Perutz in 1960 [Perutz, 1960]. A mature red blood cell contain around 270 million Hb molecules, which comprise over the 95 % of cytoplasmic proteins. Hemoglobin has an oxygen binding capacity of 1.34 ml O2 per gram
[Dominguez et al., 1981], which increases the total blood oxygen capacity seventy-fold compared to dissolved oxygen in blood. In humans this tetrameric and globular protein is formed by one pair of α-like globin chains (α and ζ) and one pair of β-like globin chains (β, ε, γ and δ) stabilized from non covalent bounds. This two different peptide chains are encoded by different genes; in particular, the α-like by a cluster of genes on the short arm of chromosome 16, while the β-like by a cluster of genes on the short arm of chromosome 11. Each globin chain contains an hydrophobic pocket bound to a prostetic heme group, made up of an iron atom at the center of a porphyrin ring. The iron forms four bonds with the porphyrin nitrogens, one bond with an hystidine residue of the polypeptide chain and a sixth bond with exogenous ligands, such as oxygen and carbon monoxide [Bossi and Giardina, 1996]. The heme iron can assume the ferric (Fe3+) or the ferrous (Fe2+) oxidation state and only this latter is able to reversibly bind oxygen [Bossi and Giardina, 1996]. The location of the heme within an hydrophobic pocket allows non covalent bound to occur, ensuring protection of the iron from its autooxidation. The high rate of conservation of this “pocket” in various animal haemoglobins underlies the importance of this region for the stability and function of the molecule itself.
The haemoglobin molecule shows two different conformational states depending on oxygen binding: the deoxygenated one (T state) with low affinity for O2, and the oxygenated structure
(R state) with high affinity for O2. Inside the erythrocyte, one form would be predominant on
the other depending on the localization of the cell in the organism, according to blood circulation in the organism. Indeed, T and R state serve the function of oxygenation of the
tissues thanks to their reciprocal switch. In the last century there were discovered many affectors involved in haemoglobin physiology. In 1903, Christian Bohr firstly demonstrated that protons and carbon dioxide are able to reduce the haemoglobin affinity for O2 in an
heterotropic manner (Bohr effect). This effect has a physiological role in facilitating the oxygen transport in organism from the lungs, in which it binds to haemoglobin, to the tissues, where the gas is finally released. Carbon dioxide that increases during metabolic activities of cells forms carbonic acid and through a balance finally produces protons and bicarbonate. This slow reaction is catalyzed by the enzyme carbonic anhydrase and so the pH rapidly decreases, promoting the dissociation of oxygen from haemoglobin and thus supplying tissues with oxygen. This effect allows tissues to adapt to supply oxygen when it is needed most, expecially in muscular tissues under strong activity. The CO2 that respiration and lactic
fermentation generate, lead blood pH to decrease to around 7.2, leading haemoglobin to release around 10 % more oxygen.
On the contrary, in the lungs, where the partial oxygen pressure (pO2) is very high (around
100 mmHg), on the contrary, the bound of the gas with haemoglobin produces protons which, combining with bicarbonate, shift the equilibrium to the CO2 and thus to the exhalation of
carbon dioxide through airways.
Later on, in 1976, Reinhold and Ruth Benesch discovered another haemoglobin effector, the 2,3-diphosphoglycerate (2,3-DPG). It is an organophosphate generated in red blood cells by glycolitic pathway and it competes with O2 for deoxyhemoglobin binding. The action of
2,3-DPG consists in stabilizing the low oxygen affinity state of haemoglobin and so making easier for the protein to release oxygen. This function is particularly important in tissues, that in the circulatory apparatus are the ones that more than all need oxygen and is also potentiated by the Bohr effect. Moreover, particular or pathological conditions such as high altitude, airway obstruction or congestive heart failure tend to cause an accumulation of 2,3-DPG.
However, hemoglobin is responsible not only of O2 carrying, but of other gases as well. 10%
of body content of carbon dioxide is indeed transported by carbaminohemoglobin, where the gas is bounded to globin chains. Nitric oxide is also carried by this protein, by a covalent bound with a thiol group and is released together with O2.
1.2.3 Erythrocyte metabolism
Red cells lack intracellular organelles and so they are uncapable of protein and lipid synthesis and of oxidative phosphorylation [Bossi and Giardina, 1996]. The main processes for which
energy is needed are the maintenance of osmotic balance through ATP-dependent pumps, enzymes and membrane protection from oxidative stress, and maintenance of Hb iron in ferrous state. Since the main function of erythrocytes is molecular oxygen transport, they are subjected to strong oxidative stress and many functional and structural proteins have to be preserved in reduced state in order to allow the cell survival.
To sustain these functions, erythrocytes rely on two metabolic pathways: Embden-Meyerhoff (glycolysis) and Pentose phosphate pathways. In the case of glycolysis, glucose can be only partially oxidized, producing 2 ATP, 2 NADH and 2 piruvate molecules (Fig. 4).
Figure 4. Glycolysis.
ATP is the main energy source for erythrocytes and many enzymes are ATP dependent, such as the Na+-K+ pump, a very important enzyme for red cells. It regulates the osmosis equilibrium by extruding Na+ ions together with water molecules and so, in absence of ATP, the cell swells, becoming not adapted to microcirculation.
NADH that is produced during glycolysis is instead very important for red cells to maintain their physiological role of oxygen transporters. In fact, it acts as electron donor-cofactor for the methaemoglobin reductase enzyme, which is responsible of methaemoglobin conversion to native ferrous haemoglobin form.
The net gain of glycolysis is actually modified in red blood cells from the Rapoport- Luebering pathway that generates 2,3-DPG that is necessary for haemoglobin physiology as previously reported.
Another important metabolic way in red blood cells is the pentose phosphate pathway (PPP) or hexose monophosphate shunt. Around 5-10% of glucose is converted in ribulose-5-phosphate by this way, producing reducing power in the form of 2 NADPH molecules. NADPH is necessary in red blood cells as H+ donor in the glutathione cycle. This cycle is necessary to continuously reconvert oxidized glutathione (GSSG) in its reduced form (GSH). GSH acts as cofactor of glutathione peroxidase, the enzyme responsible of H2O2 scavenging
with the production of H2O molecules (see paragraph 1.5 for a detailed description).
1.3 Erythrocyte storage
1.3.1 Historic evolution
Blood has been stored for human transfusion for more than 90 years and for almost as long the red cells as well [Hess and Schmidt, 2000]. At the beginning of transfusion history, donor and recipient used to be side by side [Hess, 2006] and everything has to happen before clotting intervened. The possibility to store blood as we nowadays know began in 1913 when Lee and Vincent demonstrate that citrate could prevent the coagulation. Since that moment, the donor and the recipient could be separated in space. Following researches have been focused in the look for the optimal amount of citrate without causing any side effect. In 1916, Rous and Turner firstly described the four weeks storage of rabbit red cells in citrate and glucose with minimal haemolysis. The support of glucose to the erythrocyte metabolism allow the donor and the recipient to be separated in time too. The Rous and Turner solution was subsequently used in the World War I. Anyway, prior of the discovery that glucose solution could be autoclaved without caramelization if the pH is 5.8, the only use of citrate was preferred from US Army Medical Corps to avoid bacterial contamination. Moreover, still in the view of military logistic, the introduction of plastic bags in 1950’s represented a great advantage because of their lighter weight and resistance to breakage. When the diethylhexyl phthalate (DHEP) was coupled with PVC classic bags, it has been shown a fourfold reduction of haemolysis and the time of storage increased twice. Nowadays it is known that DHEP enters the RBC membrane where it limits membrane loss by microvesiculation. Starting from here, blood banking evolutes in the next years and blood transfusion became soon a planned healthcare activity. At the same time, scientists were working, and still they are, on the improvement of storage time through the use of other molecules in addition to glucose and
citrate, e.g. phosphate to offset its dilutional loss from cells. In 1962, Nakao and colleagues [Nakao et al., 1962] described the relationship between loss of RBC viability and their loss of ATP. In fact, addition of adenine and inosine could help storage by cell shape, ATP and viability restoration, extending the storage time to 5 weeks (citrate, phosphate, dextrose, adenine: CPDA-1).
Additive solutions were developed to provide additional volume and nutrients for longer storage and better flow of packed RBCs. They represent the last step in the blood collection and storage system. In 1978, when the Saline Adenine Glucose & Mannitol (SAG-M) additive solution was introduced, the storage period was brought to 42 days, the period still in effect today. Regulatory standards require red blood cells to be stored at 1–6 °C, to keep them from freezing at -0.5 °C which ruptures their membranes, or from getting so warm that they consume all of their nutrients before their expected shelf-life [Hess, 2010]. Stored at room temperature, red cell concentrates become significantly acidotic in about 3 days, but glycolysis and proton accumulation in stored red cells occur about twenty times more slowly at 3° C than at 37 °C. They can also be shipped under wet ice at temperatures up to 10 °C. Nowadays, whole blood is not used since the use of its single components as plasma, red blood cells (RBCs) concentrates, and platelets (PLTs) in preferred, in order to transfuse patients only with the needed blood fraction. Moreover it has been demonstrated that white blood cells collected with whole blood break down in the cold and their release of proteases and lipases causes damage to the RBC during storage. Therefore, The practice of leucoreduction, by buffy coat removal or leucofiltration, became a fundamental strategy to increase RBC recovery and reduce haemolysis.
1.3.2 Blood fractionation
The most commonly used way to produce haemocomponents is by means of centrifuges (cooled or not, depending on the product). Red blood cell concentrates, in particular, are definitely the most widely transfused blood component and they are used in order to suddenly increase oxygen supply to the tissues. They are obtained starting from whole blood through a centrifugation that allows to separate leuko-platelet layer (buffy coat) from erythrocytes and plasma (Figure 5).
Figure 5. Blood component sedimentation.
After this step, using a cellular separator with optical sensors, the various blood components pass to satellite bags where they can be stored separately.
So, the “mother” bag, containing 450 cc of whole blood and CPD (citrate-phosphate-dextrose) solution is connected with a first satellite bag, designed for red cell collection with CPD and SAG-M, and to a second one, for the plasma. This procedure is called “top and bottom” collection.
Buffy coat remains, instead, in the mother bag. This strategy allows the red cell concentrates to be immediately ready for the use, or to be stored for up to 42 days since the bag contains the SAG-M as well.
1.4 Erythrocyte storage lesions
Storage lesions are the whole changes that occur to blood components during conventional blood bank storage. During the 42 days of storage at 4°C, in fact, red blood cells undergo a series of modifications that can negatively affect transfusional efficiency.
These modifications can be divided into different categories: metabolic, enzymatic, oxidative and physiologic lesions.
1.4.1 Metabolic storage lesions
Metabolism, as previously reported, is centered on glycolysis, the only red cell source of energy. As a consequence, the attempts to increase the duration of their storage are focused on
optimizing their glucose metabolism. Protons produced by glycolysis increase the acidity of red cells and storage solutions as well. Acidosis inhibits in turn the glycolysis because of low pH adverse effect on activity of hexose kinase (HK) and phosphofructokinase (PFK), and so, as glycolysis proceeds, fewer ATP and NADH are produced. Moreover, the inhibition of HK leads to a poor production of NADPH and glutathione, since it is decreased the production of glucose phosphate as well. In this view, the pH of the initial storage solution is also an important determinant of stored red cell metabolism and survival, but it is only generally controlled in storage systems and varies over a modest but clinically significant range [Hess, 2002]. Venous whole blood from the typical healthy donor will have a pH of about 7.35. When collected into CPD (pH 5.5–5.8), the resulting red cell suspension has a pH of about 7.0, but the exact pH can be 0.2 pH units more or less depending on the haemoglobin concentration and volume of the donor blood. However, at any storage pH less than 7.2, the breakdown of 2,3-DPG is favored, and this in turn leads to an initial burst of ATP production. As a result of these activities, red cell ATP concentrations initially rise as 2,3-DPG is broken down, stay above their initial concentrations for 2–3 weeks, and then decline steadily. The pH typically declines from 7.0 to 6.5, and the rate of glucose consumption decreases by more than 50%. As was mentioned before, the slowing of glycolysis also leads to reduced production of NADH leading to reduced activity of methaemoglobin reductase, and thus the methaemoglobin concentration of stored red cells increases over 6 weeks of storage, typically from about 1–2%. Flux through the hexose-monophosphate shunt also slows, and the concentration of reduced glutathione decreases by up to 80% [Dumaswala et al., 2000; Dumaswala et al., 2001].
Low temperature profoundly reduces the activity of the major membrane sodium-for-potassium pump, which is ATP-dependent. As a result, the sodium-for-potassium that slowly leaks out of RBCs is not returned, and the concentration of extracellular potassium in the suspending fluid in the red cell bag typically rises at a rate of about 1 mEq/L/day [Hess, 2010].
If units with high concentrations of extracellular potassium are given at high flow rates into central lines or used to prime cardiac bypass machines, they can expose the heart to high concentrations of potassium and cause arrhythmias and sudden death [Hall et al., 1993].
1.4.2 Enzymatic storage lesions
Enzymatic damages are related to the presence of white blood cell (WBC) during storage period. In fact, it has been demonstrated that WBC break down and release enzymes such as proteases, lipases and glycosidases in the storage solution. These enzymes attach their target on the outer surface of erythrocytes [Riedner et al., 1990]. Proteases can contribute to the loss of protein antigen strength with storage and generally they are blocked by plasma antiproteases. Lipases such as phospholipase can dealkylate trialkyl-glycerols to produce lysophospholipids. An important example of this process is the production of platelet activating factor (PAF), thought to be responsible for some cases of transfusion-related acute lung injury (TRALI) [Gajic et al., 2007]. Glycosidases remove sugars from glycolipids and glycoproteins, and the loss of these sugars can expose underlying structures that increase the binding of stored red cells to endothelial cells [Sparrow et al., 2007]. The removal of the white blood cells by filtration, so called leukoreduction, can reduce enzymatic damage, thereby improving recovery and reducing the hemolysis of stored red cells [Heaton et al., 1994]. The discovery of TRALI was the first and still the most important example of possible damages associated with stored blood. About glycosidases, Sparrow’s group [Sparrow et al., 2007] has shown that stored red cells adhere to endothelial cell monolayer proportionally with the loss of membrane sugars. Such adherence is assumed to be responsible of endothelial inflammation if the red cells subsequently break down and release iron and heme. For all these reasons, leukoreduction increases red cell recovery by about 2% and reduces the hemolysis by half at the end of the storage.
1.4.3 Physical storage lesions
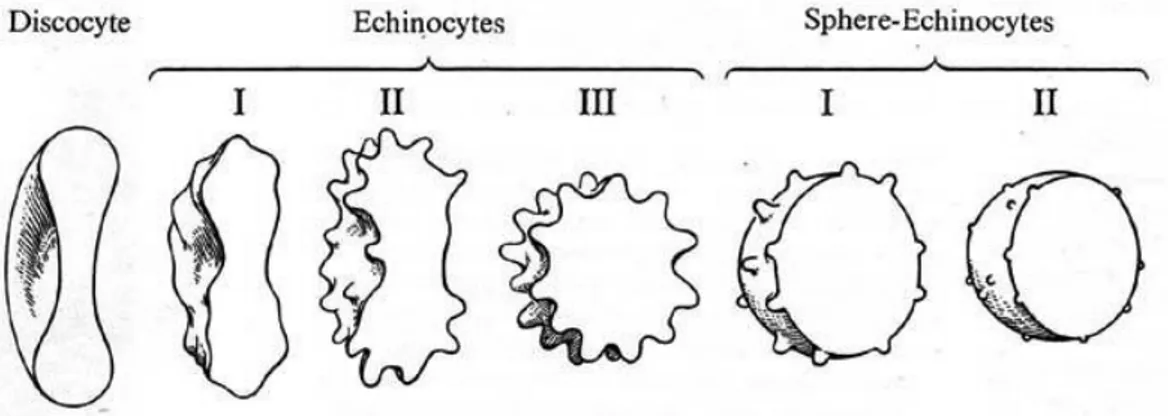
Physical changes mainly involve the RBC shape, through the reorganization of membrane structure or its loss, with production of vescicles and microvescicles. Membrane loss is an ordinary process in RBC maturation as a 140 µm3 reticulocyte becomes a 90 µm3 mature erythrocyte [Greenwalt, 2006] that anyway has 50% more membrane than it is needed to contain its volume and the extra membrane is necessary to erythrocyte deformation and squeezing inside the circulatory system. Erythrocytes lose their deformability, or the possibility to temporarily change their shape, as a consequence of a huge reduction of their surphace area to volume ratio. During the storage period, the erythrocyte evolves from
biconcave disc to spiculate shape (echinocytes) and is finally called sphero-echinocytes (Fig. 6).
Figure 6. Evolution of a red blood cell during storage.
It has been demonstrated that this process is associated with increased protons, ATP and intracellular calcium concentration. The return toward the normal red cell shape occurs in parallel with increasing ATP concentration, regeneration of 2,3-DPG and the restoration of normal sodium, potassium and calcium gradients. Beyond the spheroechinocyte stage, the cell lose its membrane as microvesicles bud from the tips of spines and this process is not reversible, since the red cell has no mechanism to replace lost membrane. At the end of the storage, the densest cells have lost all extra membrane and have become rigid spheres. The different-sized vesicle populations isolated from the supernatant of stored red cells seem to have different properties. Some are rich in oxidized lipids, most have exposed phosphatidyl serine that normally resides on the inner surface of the membrane, and almost all are deficient in membrane proteins that are attached to the cytoskeleton [Antonelou et al., 2009]. The exposed negatively-charged lipids on such vesicles can make them proinflammatory and prothrombotic. Normally, red cell-derived vesicles with exposed phosphotidyl serine are cleared by macrophages as soon as they are made.
1.4.4. Oxidative storage lesions
In erythrocyte aging and lysis process (both in vivo and in vitro), oxidative stress plays a fundamental role, since the red cell is continuously exposed to oxygen and also rich in polyunsaturated lipids, target of free radicals, and iron, a powerful catalyzer of free radical, through Fenton reaction (Fig. 7).
Figure 7. Fenton reaction.
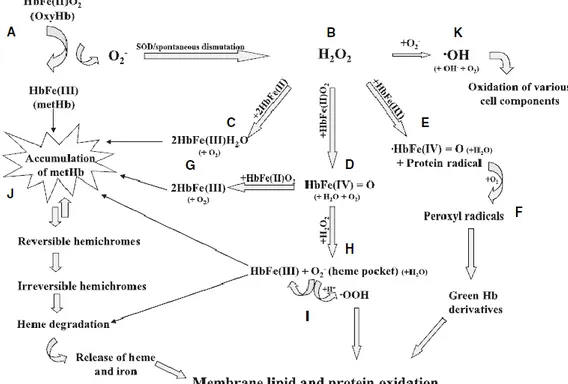
Usually the cell is able to protect from free radicals thanks to the presence of scavenger substances and enzymatic systems (see next paragraph for a detailed description). In vitro, anyway, the erythrocyte is unable to regenerate antioxidant defences and so the production of free radical increase inexorably with time. At the end, this entails huge variation at the level of permeability, antigenicity and rheological properties. The main target of oxidative injury is haemoglobin that, once is oxidized, binds irreversibly to some membrane proteins bringing to alterations in the normal organization of cytoskeleton. Nevertheless, haemoglobin itself is a source of oxidative active molecules. In figure 8 are summarized the major haemoglobin oxidative pathways and their link to membrane damage.
Figure 8. The major haemoglobin oxidative pathways and their link to membrane damage (from Kanias T. and PJ Acker, 2010).
Anytime haemoglobin binds an atom of oxygen, there is a migration of charge from the heme iron to the oxygen such that the structure of oxyHb is Fe3+ O2- [Kanias and Acker, 2010]. Oxy
Hb is a fairly stable molecule that slowly auto-oxidizes to met-Hb and involves the dissociation of the oxygen without electron transfer to yield superoxide O2- and
met-haemoglobin [HbFe(III)]. Superoxide anion is a reactive oxygen species (ROS) which is toxic if it is not eliminated. Methaemoglobin is a fairly stable molecule and easily can release the heme from the globin heme pocket and then iron from the heme itself through intermediates called hemicromes. As mentioned above, iron is one of the intermediate in Fenton reaction and its presence, together with superoxide anion, leads to the production of hydroxyl radical. Superoxide anion, by spontaneous dismutation or mediated by superoxide dismutase (SOD) enzyme, is converted to hydrogen peroxide that in turn can lead to accumulation of metHb or to the production of other kinds of oxygen radicals such as hydroxyl, perhydroxyl and peroxyl (·OH, ·OOH and ROO·, respectively). In normal conditions, these phenomena are totally reversible, because metHb is continuously reduced through NADH coming from glycolysis and NADH methaemoglobin reductase; at the same time, thiol groups are regenerated thanks to GSH produced by NADPH dependent-glutathione reductase. ·OH is the major responsible for lipid peroxidation (lipoperoxidation). The attack of the radical to the lipid molecule produces a lipid radical that is unstable and reacts in turn with O2, leading to
the production of peroxyl-fatty acid radical. This is as well an unstable species that reacts with another free fatty acid, producing a different fatty acid radical and a lipid peroxide, or a cyclic peroxide if it had reacted with itself. This cycle continues, as the new fatty acid radical reacts in the same way. Some of the first oxidation products can easily react to secondary oxidation products like malondialdeyhde (MDA), 4-hydroxy-2-,3-trans-nonenal (HNE), isoprostanes or oxysterols. These secondary oxidation products can lead to further damage by cross linking proteins. Lipids, moreover, can be oxidative dealkylated becoming active diakyl-glycerols such as PAF [Silliman et al.,1998].
Proteins are one of the major macromolecule category affected by age-related damage, since ROS can lead to oxidation of amino acid residue side chains, formation of protein-protein cross-linkages, and oxidation of the protein backbone resulting in protein fragmentation. It is estimated that almost every third of protein in a cell is dysfunctional as enzyme or structural protein due to oxidative damage [Poon et al., 2004].
The attack of ROS against proteins modifies lysine, arginine, proline and histidine amino acid residues generating carbonyl moieties, which have been identified as an early marker for protein oxidation and are used as a measure of protein damage [Levine et al., 1980].
In addition, carbonyl groups may be introduced into proteins by reactions with aldehydes (4-hydroxy-2-nonenal, malondialdehyde) produced during lipid peroxidation [Uchida and Stadman, 1993] or with reactive carbonyl derivatives (ketoamines, ketoaldehydes, deoxyosones) generated as a consequence of the reaction of reducing sugars or their oxidation products with lysine residues of proteins [Kristal and Yu, 1992]. An age related increase in the protein carbonyl concentration was reported for tissues like heart, muscle or brain [Floyd et al., 2002; Stadtman 2001], as well as in plasma of healthy people. Although, proteolytic systems exist to remove oxidized proteins following severe oxidative stress, the decrease in the proteolytic degradation and accumulation of mis-folded proteins may be the cause and/or the consequence of many disorders and aging.
1.5 Antioxidative enzymatic defense
Several enzymes have evolved in aerobic cells to overcome the damaging effects of ROS. They are significantly used to maintain the redox balance during oxidative stress and are collectively called as endogenous antioxidative enzymes. Superoxide dismutase (SOD), glutathione peroxidase (GPx), glutathione reductase (GR), catalase (CAT) and peroxiredoxins (Prxs) are the main endogenous enzymatic defense systems of all aerobic cells. They give protection by directly scavenging superoxide radicals and hydrogen peroxide, converting them to less reactive species.
SOD catalyzes the dismutation of superoxide radical (·O2) to hydrogen peroxide (H2O2).
Although H2O2 is not a radical, it is rapidly converted by Fenton reaction into ·OH radical
which is very reactive. Among various antioxidant mechanisms in the body, SOD is thought to be one of the major enzymes that protect cells from ROS.
Glutathione peroxidase (GPx) neutralizes hydrogen peroxide by taking hydrogens from two GSH molecules, resulting in two H2O and one GSSG. The enzyme glutathione reductase then
Figure 9. Glutathione cycle.
The deficient production of NADPH, that is one of the metabolic aspects of storage, and as a consequence, of reduced glutathione, bring to a decrease in resistance to oxidative stress, affecting the correct physiology of the erythrocyte.
Another important part of the enzymatic defense system is catalase (CAT). CAT is one of the most active catalysts produced by nature and it is a tetrameric heme-containing enzyme found in all aerobic organisms. Because of its wide distribution, evolutionary conservation and capacity to rapidly degrade hydrogen peroxide, it has been proposed that CAT plays an important role in systems which have evolved to allow organisms to live in aerobic environments [Scandalios, 2005]. A very interesting mechanism shown by the CAT depending upon the concentration of H2O2 is its dual function. CAT neutralizes the H2O2 in a
concentration dependent manner. At low concentrations (<1 μM) of H2O2, it acts in this
manner:
RH2 + H2O2 → R + 2H2O,
while at higher concentrations of substrate, CAT decomposes toxic hydrogen peroxide at an extremely rapid rate using the “catalatic” reaction in which H2O2 acts as both an acceptor and
donor of hydrogen molecules: 2H2O2 → 2H2O + O2.
Another property that makes CAT unique among H2O2 degrading enzymes is that it degrades
H2O2 without consuming cellular reducing equivalents. Hence, CAT provides the cell with a
very energy efficient mechanism to remove hydrogen peroxide. Therefore, when cells are stressed for energy and are rapidly generating H2O2 through “emergency” catabolic processes,
Therefore activity of CAT is one of the important biomarker of oxidative stress.
Peroxiredoxins are another important class of active enzymes against oxidative stress and in the next paragraph there is a deeper coverage about them.
1.6 Peroxiredoxin
1.6.1. Mechanism of regulation of Peroxiredoxins
Peroxiredoxins (Prxs) [Chae et al., 1994; Chae et al., 1994] are an ubiquitous protein family with antioxidant properties and, more precisely their scavenger activity is thiol specific. Prxs exert their role in the cell through their peroxidatic activity (ROOH + 2e- ROH + H2O) so
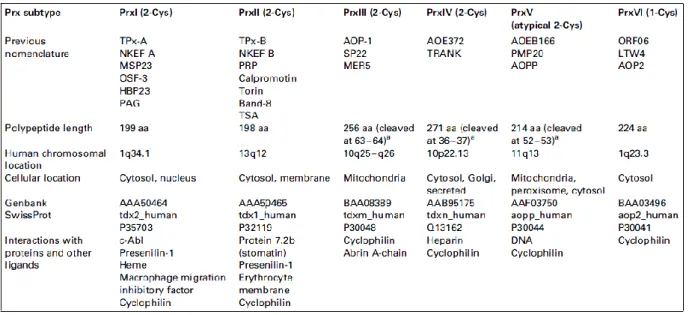
that hydrogen peroxide, peroxynitrite and a wide range of hydroperoxides (ROOH) are reduced and so detoxified [Hofmann et al., 2002; Jacobson et al., 1989; Poole and Ellis, 1996; Bryk et al., 2000; Peshenko and Shichi, 2001]. This class of enzymes has been identified in yeast, plants and animals, including protozoa and parasitic helminthes and most of the Eubacteria and Archea [Wood et al., 2003]. In spite of being localized mostly in the cytosol, Prxs are found also in mitochondria, chloroplasts and peroxisomes, associated with nuclei or membranes and, in at least one case, exported [Hofmann et al., 2002; Jacobson et al., 1989; Poole and Ellis, 1996; Bryk et al., 2000; Peshenko and Shichi, 2001; Jin and Jeang, 2000]. Prxs are produced at high levels in the cells, in fact are among the ten most abundant proteins in Escherichia coli [Link, 1997], second or third most abundant protein in the erythrocytes and compose the 0,1-0,8 % of soluble proteins in other mammalian cells [Moore, 1991]. Most of the organisms have more than one isoform of Prx and at least six Prxs have been identified in mammals (Table 1).
Table 1. Six subclasses of Peroxiredoxins (Prxs) from mammals.
As previously mentioned, peroxidatic functions of Prxs are partially overlapped to the one of GPx and CAT, although it has been suggested that their moderate catalytic efficiencies compared with those of the other two enzymes, make their importance as peroxidases questionable. Anyway, the high abundance of Prxs in many cellular type and in such a wide range of cells, allowed to appreciate the Prxs as one of the most important detoxifying enzyme class in the cell. All Prxs to date conserve an active-site Arg, which would lower the pKa of the peroxidatic cysteine somewhat by stabilizing its thiolate form.
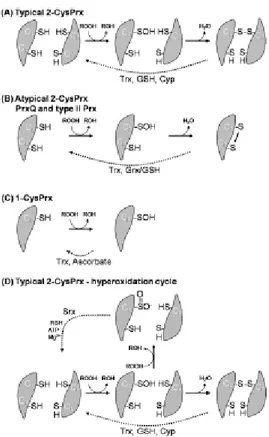
Prxs use redox-active cysteines to reduce peroxides and were originally divided into two categories, the 1-Cys and 2-Cys Prxs, based on the number of cysteinyl residues directly involved in catalysis [Chae, 1994] (Fig 10). The last class of Prxs, the 1-Cys Prxs, conserves only the peroxidatic cysteine and does not contain a resolving cysteine [Choi, 1998]. Their cysteine sulfenic acid generated on reaction with peroxides is presumably reduced by a thiol-containing electron donor, but the identity of this redox partner is not clear yet (although proposed electron donors have included glutathione, lipoic acid and cyclophilin [Hofman et al., 2002, Peshenko and Shichi, 2001]. By analogy, one donor thiol probably forms a transient mixed disulfide bond with the enzyme, followed by its reduction by a second donor thiol, thus recycling the enzyme.
Structural and mechanistic data now support the further division of the 2-Cys Prxs into two classes called the ‘typical’ and ‘atypical’ 2-Cys Prxs.
Figure 10. Catalytic mechanisms of the three classes of Prxs. The peroxidatic cysteine (CP) initially reacts with peroxide substrate. In the typical 2-CysPrxs, CP reacts with resolving Cys (CR) on the second dimer subunit of the dimer (A), while in atypical 2-CysPrxs, resolving Cys is localized on the same polipeptide chain (B). The Cys-SOH of the 1-CysPrx is directly regenerated through an electron donor in thiol form (C).
Cyp: cyclophyilin; Grx: glutaredoxin; GSH: Glutathione; ROOH: peroxide; RSH: electron donor; Srx: sulfiredoxin; Trx: thioredoxin.
.
Both classes share the conservation of two redox active sites in the protein, the peroxidatic cysteine (generally near residue 50) and the resolving cysteine (near residue 170) [Hofmann et al., 2002].
In the case of atypical 2-Cys Prxs, the detoxification of peroxide entail the formation of a intramolecular disulphide bond among the two cystein residues of the same monomer. To recycle the disulfide, known atypical 2-Cys Prxs appear to use thioredoxin as an electron donor [Seo et al., 2000] and reducing equivalents derived from NADPH.
The typical 2-Cys Prxs are instead obligate homodimers [Hirotsu et al., 1999; Schröder et al., 2000; Alphey et al., 2000; Wood et al., 2002] because the second step of the peroxidase reaction involves the peroxidatic cysteine sulfenic acid (Cys–SROH) from one subunit and the resolving cysteine (Cys–SRH) located in the C-terminus of the other subunit (Fig. 10). This condensation reaction results in the formation of a stable intersubunit disulfide bond,
which is then reduced by one of several cell-specific disulfide oxidoreductases (e.g. thioredoxin, AhpF, tryparedoxin or AhpD [Poole et al., 2000], completing the catalytic cycle. Although the resolving cysteines of typical and atypical 2-Cys Prxs are not conserved in sequence, they are functionally equivalent.
1.6.2. Oligomerization of Peroxiredoxins
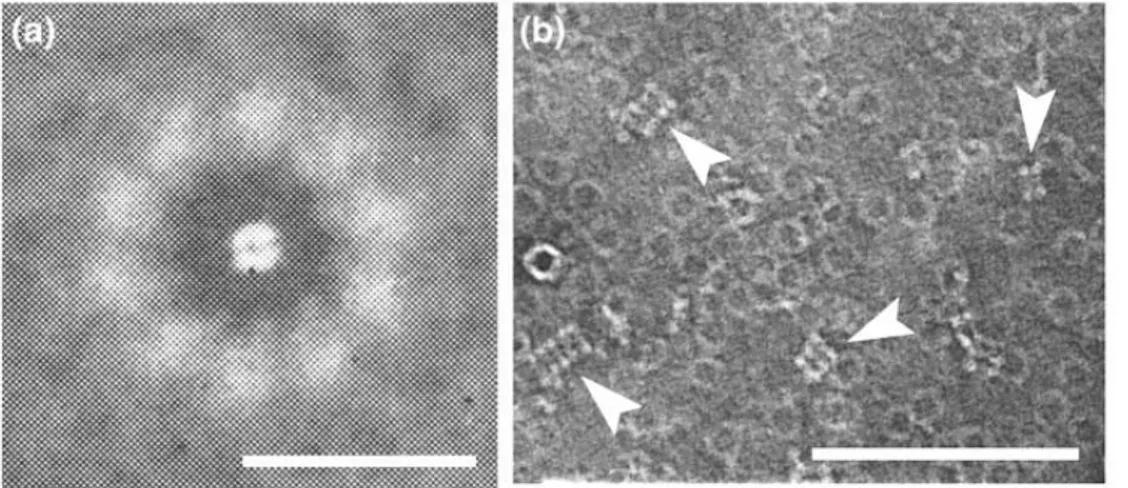
The first reference or Prx oligomerization came through transmission electron microscopy (TEM), that could reveal complexes with tenfold symmetry of an abundant protein isolated from erythrocytes [Harris, 1969] (Fig. 11a).
Figure 11. Transmission electron microscopy studies of Peroxiredoxin (Prx II).
This protein was further identified as a typical 2-Cys Prx [Harris et al., 2001]. In the TEM reports, it was observed that under certain conditions, PrxII and the related PrxIII could also form higher-order multimers by stacking into columns of various lengths (Fig. 11b).
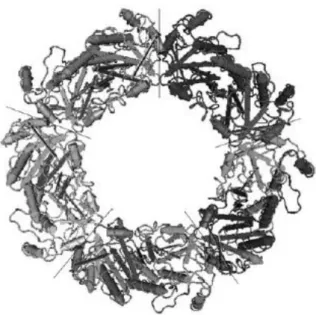
In 2000 Schröder and colleagues demonstrated that the decamer was actually formed by a doughnut arrange of five dimers [Schröder et al., 2000] (Fig. 12).
Figure 12. Quaternary structure of decameric state of PrxII in human red blood cell. The lines separate the 5 dimeric units.
The oligomeric properties of several typical 2-Cys Prxs in solution have been studied using gel filtration, light scattering and analytical ultracentrifugation. Factors shown to promote oligomerization in typical 2-Cys Prxs include high or low ionic strength [Kitano et al., 1999], low pH [Kristensen et al., 1999], high magnesium [Kato et al., 1985] or calcium [Allen et al., 1979, Plishker et al., 1992] concentrations, reduction of the redox-active disulfide center [Schröder et al., 2000], and ‘overoxidation’ of the peroxidatic cysteine to a sulfinic acid (Cys–SO2H) [Schröder et al., 2000]. Reduction of the active-site disulfide of typical 2-Cys
Prxs is emerging as the primary factor in the stabilization of the decameric forms of these enzymes; a direct link between redox state and oligomerization state was recently established through analytical ultracentrifugation of several bacterial 2-Cys Prxs [Wood et al., 2002;
Reynolds et al., 2002] and human PrxII [Schröder et al., 2000], as well as earlier gel-filtration studies of porcine PrxII [Schröder et al., 1998]. The dynamic equilibrium between oligomer assembly and disassembly has been extensively studied, however it is still intriguing, especially because the adopted different conformation states are linked to switches in function. An important feature of mammalian 2-Cys is that high levels of peroxide produce their inactivation through the overoxidation of the peroxidatic cysteine to sulfinic (Cys-SpO2H) or sulfonic (Cys-SpO3H) acid [Hall et al., 2009; Yang et al., 2002]. Although the
sulfinic acid form was originally thought to be biologically irreversible, sulfiredoxins (Srxs) and possibly sestrins are able to revert Cys-SpO2H to the reduced state in an ATP-dependent
reaction [Biteau et al., 2003; Jönsson and Lowter, 2007]. The existence of such a resurrection activity supports a physiological role for the overoxidized form of Prxs and, more precisely, it has been suggested that overoxidation allows intracellular accumulation of H2O2 which can
then function as a signal transducer for various pathways [Biteau et al., 2003; Kang et al., 2005]. On the other hand, as mentioned before, the peroxidatic cysteine is also the molecular switch responsible for the redox-sensitive oligomerization of 2-Cys Prxs. In fact, within the dynamic cycle, the decamer breaks down releasing free disulfide-bonded dimers, whereas hyperoxidation seems to freeze the Prx protein as a decamer or might even promote further aggregation with abolishment of peroxidase activity and exhibition of chaperone function [Barranco-Medina et al., 2009; Moon et al., 2005; Meissner et al., 2007]. At any rate, despite the numerous observations accumulated in various cell lines and organisms, very little is still known in human erythrocytes where the PrxII was shown to be remarkably sensitive to oxidative stress [Low et al., 2007]. Recent investigations performed on erythrocytes brought to light a peculiar behavior of PrxII with respect of that reported for other cells [Low et al., 2007], making of extreme interest the understanding of the redox induced changes in oligomeric state of this protein in such a system. Indeed, erythrocytes represent very unique cells where high rates of reactive oxygen species (ROS) are constantly formed due the interaction of heme-containing hemoglobin and oxygen. For this reason they have a broad repertoire of antioxidants to counter the potentially detrimental effect of oxidative insult.
1.7 Aim of the thesis
Red blood cells can be stored, in standard conditions, for a limited span of time, during which they undergo a series of biochemical and physico-chemical changes that could affect the transfusional efficacy. When stored red cells are transfused to a receiver, some of them remain in the bloodstream, while others are removed within few hours. The reason has to be searched in the so called storage lesions. oxidative stress and proteolytic degradation seems to play a key role during the aging process and the consequent erythrocytes lysis. Storage condition avoid the red cell to cope with the increased amount of free radical that, in turn, are able to induce an oxidative stress on lipids and proteins. This process bring to the activation of proteolytic enzyme and to a wider protein fragmentation leading the cytoskeleton to accumulate severe damages to its protein. The morphological modifications lead to huge alterations to permeability and rheological properties of the erythrocyte, causing an early
aging of red cell that impair their usage in transfusional therapy. This PhD thesis would evaluate protein alterations of red blood cell citoskeleton, during the storage period of 42 days. The aim is the identification of potential of oxidative stress and aging condition biomarkers. To this purpose it will be performed a biochemical analysis of oxidative modifications to cytoskeletal proteins at days 0, 14, 28, and 42 storage days (4°C in saline-adenine-glucose-mannitol, SAG-M). In particular, this thesis suggest the Peroxiredoxin protein (PrxII) as cytosolic protein that during storage migrates to the membrane, as a potential biomarker of oxidative condition of stored red blood cell. Ghost membrane suspension would be treated in reducing and non reducing conditions, since the thiolic groups are the main target of oxidations. It will be also evaluated the condition of the ghosts in presence or absence of oxygen (aerobic and anaerobic storage, the latter with helium addition, in order to have an inert atmosphere in which reactive oxygen species cannot be generated. Moreover, with the aim to demonstrate the copartnership of oxidative stress phenomena in the oligomeric conformation of PrxII, it will compared, through native electrophoresis technique coupled with immunoblotting, protein extract obtained from fresh erythrocytes (control, 0 days of storage) with aged erythrocytes (after 28 days of storage). Functional assays will be also performed, in order to evaluate eventual defense roles against oxidative damage.
C
C
h
h
a
a
p
p
t
t
e
e
r
r
2
2
M
2.1 Sampling
Whole blood (450 mL ± 10%) was collected from nine units of healthy volunteer donors into CPD anticoagulant (63 mL). After separation of plasma and buffy coat by centrifugation, leukoreduced RBCs were suspended in 100 mL of SAGM solution. We studied RBC units collected from 9 donors [male = 5, female = 4, age 48 ± 11.5 (mean ± S.D.)] in the middle region of Italy. RBC units were stored under standard blood bank conditions (4 ± 2°C) and samples were removed aseptically for the analysis after 0 and 28 days of storage. Density-fractionated RBCs were prepared using Percoll (Sigma Aldrich, St. Louis, MO, USA) discontinuous gradients as described by Alderman et al. [1980], and two fractions were considered according to red cell density (fraction F1: density ± 1.10; fraction F2: density ± 1.11).
2.2 Deoxygenating treatment
To determine the effects of anaerobic RBC storage, 60-mL aliquots of RBCs were sampled from each RBC unit by centrifugation (600 x g, 5 min) and transferred into 150-mL polyvinylchloride bags (PL146, Baxter Healthcare, Round Lake, IL). SAGM (40 mL) additive solution (AS) was added to each of the 150-mL bags, which were stored at 4°C. To obtain oxygen depletion each bag was filled with ultrapure helium through a 0.22-mm sterile filter and put under gentle horizontal agitation for 30 minutes at 4°C; the gas was then expressed out. This process was repeated five times. The deoxygenation of Hb was verified by spectrophotometric analysis. To prevent reoxygenation, deoxygenated bags were stored in a homemade anaerobic chamber filled with 100% ultrapure helium. The chamber was refilled with helium every day during the 42 days of storage. Oxygen-depleted RBCs and standard RBCs were stored for 42 days under standard blood bank conditions (4 ± 2°C). During storage 10-mL samples were collected aseptically from each RBC unit on Days 0, 7, 14, 21, 28, and 42.
2.3 RBC membrane preparation and trapping of PrxII in its native state
Extraction of human erythrocyte membrane and cytosol proteins was performed based on the conventional method as described by Olivieri et al. [2001] with some modifications. The erythrocytes were isolated by centrifuging twice at 1000g for 10 min. Packed cells were
washed three times in 5 mM phosphate buffer pH 8.0, containing 0.9% w/v NaCl; then, they were centrifuged at 300 ×g for 10 min, at 4°C. Erythrocytes were resuspended in 1 mL PBS containing 100 mM N-ethylmaleimide (NEM), to avoid possible oxidation artifacts during cell preparation [Low et al., 2007]. After 15 min of incubation at room temperature, cells were pelleted and then lysed with 9 vol of cold 5 mM phosphate buffer pH 8.0 containing 1 mM EDTA, 1 mM phenylmethanesulfonyl fluoride (PMSF) and 100 mM NEM. Cytosol was collected after centrifugation at 17,000×g for 20 min at 4 °C and its protein content was estimated by the DC protein assay method (Bio-Rad, Hercules, CA, USA). Membranes were washed with the same buffer until free of hemoglobin and then, in order to remove non-specifically membrane-bound cytosolic proteins, were washed three times with 0.9% w/v NaCl and collected at 17,000×g, for 20 min at 4°C. Protein content was estimated by the bicinchoninic acid method [Smith et al., 1985] and ghosts prepared in this way were used for the following steps.
2.4 Gel electrophoresis
2.4.1. 1D/SDS-PAGEElectrophoretic analyses of the RBC proteins were carried out on a continuous system of polyacrylamide gels in the presence of sodium dodecyl sulfate (SDS-PAGE) using a 5% to 16% linear acrylamide gradient gel (30 mg protein/lane) according to Laemmli [1970]. To prepare RBC membranes for electrophoresis, membrane suspensions were treated with an equal volume of solubilization buffer (0.125 mol/L Tris-HCl pH 6.8, 4% SDS, 20% glycerol, 0.053% bromophenol blue) containing either 200 mmol/L dithiothreitol when working under reducing conditions or 100 mmol/L NEM in oxidizing conditions. Proteins were visualized by sensitive colloidal Coomassie brilliant blue G-250 stain. Stained gel images were digitized using a high-resolution scanner (ImageScanner II, GE Healthcare, Uppsala, Sweden) with a resolution of 300 dpi and 16-bit grayscale pixel depth. Image analyses were performed using computer software (Quantity One 4.6.3, Bio-Rad, Hercules, CA). For each protein of interest, the relative amount (as a percentage of the total) was quantified by densitometry. All samples were analyzed in three technical replicates. One-dimensional SDS-PAGE protein bands were selected for profile analysis only if they were found and positively assigned in all of the three replicates of each sample. To compensate for subtle differences in sample loading, the volume of each band was normalized to the total volume of bands.
2.4.2. Clear native PAGE of cytosolic proteins
RBC cytosolic protein extracts were loaded onto a 0.75mm thick 5% e 12.5% w/v acrylamide gradient gel. The procedure was carried out according to Schägger et al. [1994] with some modifications. 10 ml of sample buffer (0.1 M Bis-Tris-HCl pH 7, 0.5 M 6-aminocaproic acid, 30% w/v sucrose and 0.001% w/v Ponceau red) containing 100 mM NEM were added to 100 µl of cytosol sample. 100 µg of total protein were loaded onto each lane. The molecular weight of the bands was determined thanks to the High Molecular Weight calibration kit for electrophoresis (GE Healthcare, Uppsala, Sweden). The run was carried out at 4 °C and voltage was increased every 30 min by 25 V starting from 75 to 200 V. 200 V were then maintained for 2 h.
2.4.3. Blue native PAGE of membrane proteins
Ghost membrane protein extract was processed according to Schägger and von Jagow [1991] with some modifications. The membranes were pelleted at 18,000×g at 4°C for 10 min and resuspended in 25BTH20G [20% w/v glycerol, 25 mM Bis-Tris-HCl pH 7, and 25% w/v Pefabloc (Sigmae Aldrich, St. Louis, MO, USA)]. An optimized amount of detergent of 1 g n-docecyl-β-D-maltoside (DDM) per gram of protein was used for erythrocyte membrane protein solubilization. The solubilization occurred on ice with continuous vortexing for 3 min. The solubilized proteins were collected after centrifugation at 18,000×g for 10 min at 4°C and their concentration was estimated by the DC protein assay method (Bio-Rad). 100 mg of proteins (in 30 ml of solubilization buffer) were loaded onto a 0.75mmthick 3.5% e 14% w/v acrylamide gradient gel after the addition of 3 ml of sample buffer [0.1M Bis-Tris-HCl pH 7, 0.5 M 6-aminocaproic acid, 30% sucrose and 5% w/v Serva blue G]. N-ethylmaleimide (NEM) at the final concentration of 100 mM was also added.
2.4.4. 2D CN/BN-SDS-PAGE
Strips from the 1D native electrophoresis were cutted and equilibrated for 30 min in agitation in presence of 50 mM Tris-HCl pH 8.8, 4% SDS, 30% glycerol and 6 M urea (non-reducing conditions). Alternatively, two consecutive incubation steps of 15 min each were performed in the equilibration buffer [50 mM Tris-HCl pH 8.8, 4% SDS, 30% glycerol, 6 M urea] with 3% DTT first and 12% iodacetamide after (reducing conditions). For the second dimension,
agarose. The molecular weight of the proteins was determined by the Wide Range Sigma Marker protein standard (Sigma-Aldrich, St. Louis, MO, USA).
2.5 Immunoblotting
Proteins (30 µg of protein/lane) were resolved by reducing and non-reducing 14% SDS-PAGE and electrophoretically transferred to a polyvinylidene difluoride membrane. To reduce the likelihood of false positives, blocking was performed for 2 hours at room temperature in 5% (wt/vol) non-fat dried milk in Tris-buffered saline. Incubation with antibodies anti-human PrxII was performed overnight at 4°C in 1% (wt/vol) bovine serum albumin in Tris-buffered saline/0.1% Tween 20. Bands were detected with goat antirabbit horseradish peroxidase using enhanced chemiluminescence reagents and digitized with a high-resolution scanner (ImageScanner II, GE Healthcare). Quantification of band intensities was performed with analysis software (Quantity One 4.6.3, Bio-Rad), using an internal control of human recombinant PrxII protein. The amount of PrxII of each sample was determined as a ratio between the sample value and the internal control.
2.6 RBC membrane lipoperoxidation
Malondialdehyde (MDA) levels were estimated in RBCs following the Stocks and Dormandy’s method with some modifications [Stocks and Dormandy’s 1971]. Briefly, 0.2 mL of RBCs was suspended in 3.0 mL of Krebs’s Ringer phosphate buffer solution (pH 7.4), and 1 mL of the cell suspension was treated with 1 mL of 10% trichloroacetic acid and centrifuged at 1000 x g for 5 minutes. One milliliter of supernatant was then mixed with 1 mL of 0.67% thiobarbituric acid and heated over a water bath for 20 minutes at 85 to 90°C. The solution was cooled and read against a complementary blank at 532 nm (optical density [OD]1) and 600 nm (OD2). A blank was prepared separately without RBCs. The net OD was calculated after subtracting absorbance at OD2 from that at OD1. The MDA level was determined from the standard plot and expressed as nmol/mL RBCs.
2.7 In gel PrxII activity assay
The in-gel assay for the PrxII peroxidase activity was conducted as described by Kang et al. [2006] with some modifications. After the native electrophoresis, the gel strips were
incubated in staining solution (50 mM sodium acetate buffer pH 5.0, 2 mM o-dianisidine dihydrochloride, 1.15mM sodium azide and 0.006% v/v H2O2) in the dark at room temperature until red-brown bands appeared. To evaluate the ability of PrxII to scavenge also organic peroxides, gel assay was performed replacing 0.006% v/v H2O2 with 0.01% v/v t-butyl hydroperoxide in staining solution. Before assaying, gel strips were incubated with Drabkin’s reagent (potassium ferricyanide/potassium cyanide) to inhibit the pseudoperoxidase activity of Hb.
2.8 In-gel digestion
Protein bands observed in SDS-PAGE were carefully excised from Coomassie-stained gels and subjected to in-gel trypsin digestion according to Shevchenko and coworkers, with minor modifications [2007]. The gel pieces were swollen in a digestion buffer containing 50 mmol/L NH4HCO3 and 12.5 ng/mL trypsin (modified porcine trypsin, sequencing grade, Promega,
Madison, WI) in an ice bath. After 30 minutes, the supernatant was removed and discarded, 20 mL of 50 mmol/L NH4HCO3 was added to the gel pieces, and digestion was allowed to
proceed at 37°C overnight. The supernatant containing tryptic peptides was dried by vacuum centrifugation. Before mass spectrometric analysis, the peptide mixtures were redissolved in 10 mL of 5% formic acid.
2.9 Protein identification by tandem mass spectrometry
Peptide mixtures were separated using a nanoflow high performance liquid chromatography system (Ultimate, Switchos, Famos, LC Packings, Amsterdam, the Netherlands). A sample volume of 10 mL was loaded by the autosampler onto a homemade 2-cm fused silica precolumn (75 µm inside diameter, 375 µm outside diameter; Reprosil C18-AQ, 3 µm, Dr Maisch GmbH, Ammerbuch-Entringen, Germany) at a flow rate of 2 mL/min. Sequential elution of peptides was accomplished using a flow rate of 200 nL/min and a linear gradient from Solution A (2% acetonitrile, 0.1% formic acid) to 50% of Solution B (98% acetonitrile, 0.1% formic acid) in 40 minutes over the precolumn in line with a homemade 10- to 15-cm resolving column (75 µm inside diameter, 375 µm outside diameter; Reprosil C18-AQ, 3 µm, Dr Maisch GmbH). Peptides were eluted directly into a high-capacity ion trap (Model HCTplus, Bruker-Daltonik, Bremen, Germany). Capillary voltage was 1.5 to 2 kV and a dry gas flow rate of 10 L/min was used with a temperature of 230°C. The scan range used was
from 300 to 1800 m/z. Protein identification was achieved by searching the National Center for Biotechnology Information nonredundant database (NCBInr, Version 20090424, http://www.ncbi.nlm.nih.gov) using theMascot program (in-house version 2.2,Matrix Science, London, UK). The following variables were adopted for database searches: complete carbamidomethylation of cysteines and partial oxidation of methionines, peptide mass tolerance ± 1.2 Da, fragment mass tolerance ± 0.9 Da, and missed cleavages 2. For positive identification, the score of the result of (-10 Χ Log[P]) had to be over the significance threshold level (p < 0.05).
2.10 Statistical analysis
Descriptive statistics are presented as arithmetic mean ± standard deviation. Paired student t tests were carried out as indicated in figure legends with p values of less than 0.05 used to reject the null hypothesis.
C
C
h
h
a
a
p
p
t
t
e
e
r
r
3
3
R
3.1 Presence of cytoplasmic proteins in ghost membranes
To study storage-dependent remodeling of RBC membranes, in terms of both changes in the association of cytosolic proteins and aggregation or degradation of membrane proteins,8 we analyzed the ghost membranes of RBCs after 0, 14, 21, 28, and 42 days of storage. All samples were subjected to SDS-polyacrylamide gradient gels under reducing and non-reducing conditions (Fig. 13A) followed by mass spectrometry analysis for protein identification.
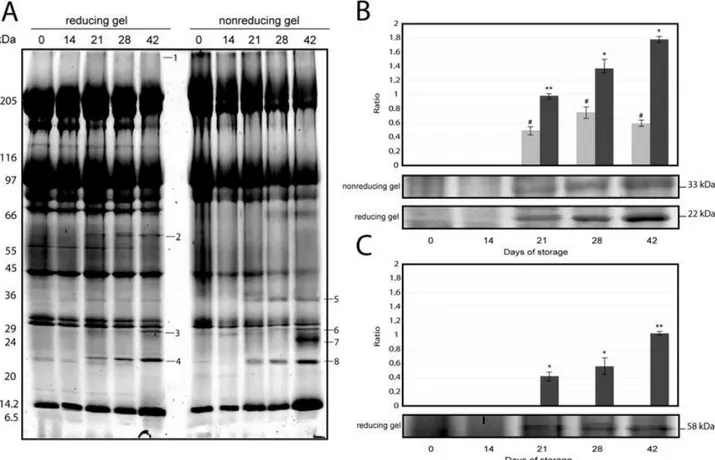
Fig. 13. Representative electrophoretic profile of membrane proteins from RBCs stored for 0, 14, 21, 28, and 42 days (A). SDS-PAGE was performed in a linear gradient (7%-14%) gel and samples treated under reducing (left side ) and non-reducing (right side) conditions (molecular weight markers are shown on the left). Numbers refer to protein identified by mass spectrometry and detailed in Table 1. PrxII (B) and CAT (C) levels were measured by densitometric analysis of electrophoretic gels as ratio between each sample and the used internal controls. Data are presented as mean ± standard error (n = 3). *#p < 0.05. **p < 0.01.
The high-molecular-weight Band 1 was detected in increasing amounts toward the end of the storage period and it was present both under reducing and non-reducing conditions. This evidence suggested that band is stabilized by non-reducible linkages (such as amides or free radical–generated adducts). Tandem mass spectrometry (MS/MS) analysis (see Table 2) revealed the presence in this band of non-reducible cross-linking species of Hb with some important cytoskeletal proteins, such as spectrin, ankyrin and Band 3.
Table 2. Mass spectrometry identification of protein bands from SDS-PAGE of ghosts prepared from stored RBCs.
Under reducing conditions, CAT band (Band 2, 59.6 kDa) was detected in ghosts only after the 21st day of storage, and its volume increased with the duration of the storage. Under non-reducing conditions, CAT band disappeared suggesting that intermolecular disulfide bonds could be involved in the membrane association. Electrophoretic gels (under both reducing and non-reducing conditions) also showed the association of the multifunctional enzyme 2,3- bisphosphoglycerate mutase (2,3-BGM) to ghost membrane (Bands 3 and 6, 29.9 kDa). The interaction appeared at the end of the storage period (42 days). Interestingly, starting from Day 21, a marked accumulation in PrxII protein was evident by reducing SDS gel analysis (Band 4, 22.5 kDa). Normalized volume of PrxII band sharply increased with storage time, reaching the 82.3% of the initial value on Day 42 (Fig. 13B). Under non-reducing conditions a new band at about 34 kDa was identified as dimeric form of PrxII protein (Band 5). Similarly to the monomeric band also the dimeric form increased approaching 42 days of storage. These data suggested that cytoplasmic PrxII protein might link to the RBC membrane in a dimeric form. Finally, storage time induced the appearance of membrane-bound Hb dimers, which can be seen as a new protein band at approximately 24 kDa in non-reducing gel (Band 7). MS/MS analysis identified in this band both a- and b-globin chains, indicating the association of Hb heterodimers due to intermolecular disulfide bonds to the RBC membrane.
3.2 Effect of atmospheric oxygen on protein migration
To evaluate the role of atmospheric oxygen on the cytoplasmic protein migration to ghost membranes, we performed RBC storage under anaerobic conditions. The SDS-PAGE profile of ghost membranes extracted from RBCs stored in the absence of oxygen showed some