Università degli
studi
della
Calabria
Dipartimenti di Chimica e di FisicaDottorato di Ricerca rn
Scienze e Tecnologie delle Mesofasi e dei Materiali Molecolari
XXI Ciclo
Settore discipl inare CHIM/O2
Study
of
composite
systems
of polymers and
liquid
crystals
with
homeotropic
orientation
Supervisore
rro$ciovaqn'
t'flt'r"
fv
v
lX,c
I
[,..,0r^^rV,!
Prof. Carlo Versace
&Àv*,*
Candidato
To Chiara..
INDEX
Introduction i
CHAPTER 1: Liquid Crystals
1.1 The history 1
1.2 Liquid crystals as fourth state of matter 2
1.3 Liquid crystal phases 6
1.3.1 Nematic liquid crystal phase 6
1.3.2 Smectic liquid crystal phase 7
1.3.3 Chiral nematic liquid crystal phase 10
1.3.4 Chiral smectics liquid crystal phase 11
1.3.5 Columnar liquid crystals phases 13
1.4 Physical properties of liquid crystals 13
1.4.1 Orientational order parameter 13
1.4.2 Dielectric anisotropy 14 1.4.3 Diamagnetic anisotropy 16 1.4.4 Optical anisotropy 18 1.4.5 Elastic constants 19 1.4.6 Anchoring energy 20 References 22 CHAPTER 2: PDLC 2.1 Introduction 23
2.2 Nematic configurations within droplets 23
2.3.1 Encapsulation 25
2.3.2 Phase separation methods 26
2.3.2.1 TIPS 26
2.3.2.2 SIPS 27
2.3.2.3 PIPS 27
2.4 Polymer networks 28
2.5 Aspect of film structure 29
2.6 Liquid crystal/polymer phase separation 30
2.6.1 Phase diagrams for LC/monomer mixtures 30
2.6.2 Phase separation in the binodal and spinodal regimes 32
2.7 Electro-optical effects 33
2.7.1 Light scattering and index matching 33
2.7.2 PDLC film operating voltage 35
2.7.3 Switching times 38
2.8 Reverse mode devices 39
References 43
CHAPTER 3: Alignment technologies
3.1 Introduction 46
3.2 Liquid crystal alignments 46
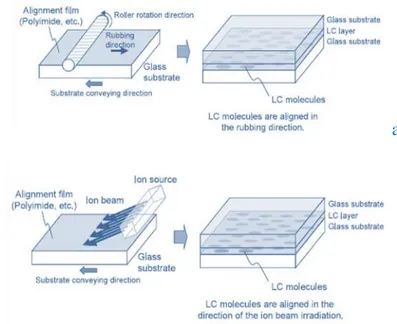
3.3 Rubbing Technologies 50
3.3.1 The rubbing process 50
3.3.2 Alignment materials and mechanisms of the rubbing process 51
3.4 Non-rubbing Methods 54
3.4.1 Introduction 54
3.4.2 Ion beam alignment. 56
3.4.3.1 Alignment materials and mechanisms for the photoalignment
3.4.3.2 Influence of UV light on display device characteristics 58
3.4.4 Oblique Evaporation Method 59
3.4.4.1 Alignment mechanism 59
3.4.5 LB membranes for the alignment layer 61
3.5 Liquid Crystalline Alignment on Chemically Treated Surfaces 63
3.5.1 Addition of surface active agents into liquid crystalline materials
3.5.2 Treatment of the substrate surface by active surface agents 64
3.5.3 Pyridinium salts 67
References 68
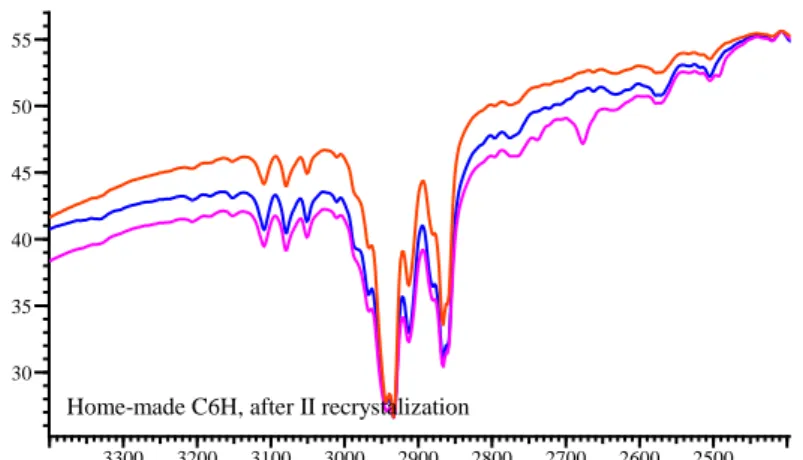
CHAPTER 4: Impurities characterization in the
bis{4-[(6-acryloxy)hexyloxy]benzoate}-1,4-phenylene (C6H) LC monomer
4.1 Introduction 71
4.2 The history of our interest for C6H 72
4.3 Synthesis of bis{4-[(6acryloxy)hexyloxy]benzoate}1,4-phenylene(C6H)
73
4.4 Characterization of the monomer 75
4.4.1 DSC 76 4.4.2 TLC 78 4.4.3 SEM/EDS microanalysis 79 4.4.4 FTIR 80 4.4.5 MALDI TOF-MS 83 4.4.6 1H-NMR 85
4.5 Impurities generation mechanisms 92
4.6 Reproduction of aligning “impurities” in C6H monomer 93
4.7 Characterization of the products of reaction between commercial C6H
4.7.1 FTIR 96 4.7.2 MALDI MS-MS experiments 99 4.7.3 1H – NMR 103 4.7.4 13C - NMR 112 4.8 Conclusions 116 References 118
Chapter 5: High contrast Reverse Mode PDLC Films: morphologic and electro-optical studies
5.1 Reverse mode PDLC 120
5.2 Films preparation methodology 122
5.3 Electro-optical measurements 124
5.4 Morphologic analysis of PDLC films 129
5.5 Model for Eth and response times toff 134
5.6 Conclusions 137
References 139
i
Introduction
This work is related to the optimization of methodologies to obtain electro-optical devices like PDLC Reverse Mode, obtained by photo-polymerization of a mixture of diacrylates monomers and a liquid crystal with negative dielectric
anisotropy, developed at Calabria University i.
Previous works demonstrate the possibility to obtain PDLC electro-optical Reverse Mode film by using the bis{4-[(6-acryloxy)hexyloxy]benzoate}-1,4-phenylene (C6H) and bis{4-[6-(acryloxy)hexyloxy]benzoate}-4,4’-bicyclohexyl (AHBB) Liquid Crystal monomers, synthesized at Calabria University. Even if the precursor Liquid Crystal mixtures contained only 16-20% of the above mentioned monomers, a very good homeotropic orientation of the precursor liquid crystal mixture could be achieved without pre-treating of the glass substrate. The alignment process within liquid crystal devices is very important and influence the cost, time and technology required for the production of composite systems, i.e. PDLC and PSLC, and technology displays.
The very lucky behavior encountered in the case of C6H and AHBB behavior was attributed to the presence of small percentages of “impurities” generated during the synthesis process, since the spontaneous homeotropic alignment of PDLC precursor was not observed when C6H commercial LC monomer, was used. The nature of the aligning impurities, however, was not identified.
The aim of this thesis, was, from one side, to give further insight with respect to the morphology and electro-optical response of the PDLC Reverse Mode system realized at Calabria University, and, from another point of view, to clarify the role of possible synthesis impurities, with respect to the generation of uniform homeotropic alignment into PDLC precursor mixtures. The presentation has been divided into the following parts:
First off all, the product employed in the C6H monomer synthesis, as well as the synthesis intermediate products, were characterized. This characterization work was performed by using Spectroscopic, Chromatographic, electron and optical Microscopy techniques.. The results obtained from the interpretation of
ii
these experimental data converge towards a common display of sub-products, and are illustrated in the chapter 4 of this thesis.
As second step, the mechanisms of formation of the identified impurities were studied. Experimental work has been performed in order to reproduce the impurity formation in the pure commercial C6H monomer. The variation in the aligning capacity on glass of the C6H was determined, after inducing, trough chemical reactions, the formation of given impurities. The base idea was to develop a simple and reproducible method to obtain LC monomer mixtures, showing a homeotropic spontaneous alignment on ITO coated glass support, without recurring to surface pretreatment. This argument is also treated in chapter 4.
The electro-optical and Morphologic properties of Reverse Mode PDLC film, obtained by using the above mentioned aligning methodologies, in comparison with those of analogous films obtained through surface pre-treatments, were investigated. To complete the analysis, PDLC with higher LC monomer content and PDLC with only AHBB monomer, were studied in order to establish systems with optimal electro-optical contrast, lower operational voltages and faster response time.
Finally, a simple model to account for the threshold voltages and switching times of reverse Mode PDLC films, as a function of morphologic parameters, has been developed. These items are reported in chapter 5.
For completeness, three chapters were added to present the state of art on the research argument treated in this thesis. In particular: Chapter 1 reports a general overview of liquid crystal materials; Chapter 2 concerns the properties of PDLC films and Chapter 3 summarize the alignment methodologies useful for the LC device preparation.
i G. Chidichimo, G. De Filpo, European Patent n° WO9816865 (1997) ; G. Chidichimo, G. De
1 CHAPTER 1: Liquid Crystals
1.1 The history
The discovery of liquid crystals is thought to have occurred nearly 150 years ago although its significance was not fully understood until over a hundred years later. Around the middle of the last century Virchow, Mettenheimer and Valentin found that the nerve fiber they were studying formed a fluid substance when left in water, which exhibited a strange behavior when viewed using polarized light. They did not realize this was a different phase but they are attributed with the first observation of liquid crystals.
Later, in 1877, Otto Lehmann used a polarizing microscope with a heated stage to investigate the phase transitions of various substances. He found that one substance would change from a clear liquid to a cloudy liquid before crystallizing but he thought that this was simply an imperfect phase transition from liquid to
crystalline. In 1888 Reinitzer (1) observed that a material known as cholesteryl
benzoate had two distinct melting points. In his experiments, Reinitzer increased the temperature of a solid sample and watched the crystal change into a hazy liquid. As he increased the temperature further, the material changed again into a clear, transparent liquid. Because of this early work, Reinitzer is often credited with discovering a new phase of matter. He has consequently been given the credit for the discovery of the liquid crystalline phase. Up till 1890 all the liquid crystalline substances that had been investigated, had been naturally occurring and it was then that the first synthetic liquid crystal, p- azoxyanisole, was produced by Gatterman and Ritschke. Subsequently more liquid crystals were synthesized and it is now possible to produce liquid crystals with specific predetermined material properties.
In the beginning of this century George Freidel conducted many experiments on liquid crystals and he explained the orienting effect of electric fields and the presence of defects in liquid crystals. In 1922 he proposed a classification of liquid crystals based upon the different molecular orderings of each substance. It was between 1922 and the World War Il that Oseen and Zocher developed a
2
mathematical basis for the study of liquid crystals (2) (3).
After the start of the war many scientists believed that the important features of liquid crystals had been already discovered and it was not until the 1950's that work by Brown in America, Chistiakoff in the Soviet Union and Gray and Frank
in England led to a revival of interest in liquid crystals. Maier and Saupe (4)
formulated a microscopic theory of liquid crystals; Frank (5) and later Leslie (6) and
Ericksen (7) developed continuum theories for static and dynamic systems and in
1968 scientists from RCA first demonstrated a liquid crystal display.
The interest in the study of liquid crystals has grown ever since, partly due to the great variety of phenomena exhibited by liquid crystals and partly because of the enormous commercial interest and importance of liquid crystal displays. As research on this field continues and as new applications are developed, the role of liquid crystals in modern technology will continue to grow.
1.2 Liquid crystals as fourth state of matter
The three common states of the matter: solid, liquid and gas, are different because the molecules in each state have a different degree of order.
In the solid state there exists a rigid arrangement of molecules, which stay in fixed positions and orientations with a small amount of variation due to molecular vibrations. To maintain this arrangement, large attractive forces are required to hold the molecules in piece and therefore a solid is difficult to deform.
In the liquid phase the molecules have no fixed positions or orientations and are free to move in a random fashion; consequently, the liquid state has less order than the solid state. The random motions of the molecules mean that the intermolecular attractive forces are not strong as in solids but are only strong enough to keep the liquid molecules fairly close together. A liquid can therefore be easily deformed.
In the gas state the random motion of the molecules overcomes the intermolecular forces, and the molecules spread out to fill any container that holds them. The order in a liquid, which derives from the closeness of the molecules, is lost in a gas. The probability of molecules in a certain region being in a rigid arrangement, and having the same orientation can be used to define a positional
3
and orientational order. These parameters have the greatest value in the solid state and the least one in the gaseous state.
A liquid crystalline phase occurs in some substances in a temperature region between the solid and liquid states. In this state the substance possesses properties of both liquids and solids. A liquid crystal is a fluid like a liquid but it is anisotropic, in its optical and electro-magnetic characteristics, like a solid. When the liquid crystal is formed from the isotropic state, some amount of positional or orientational order is gained. It is this order that accounts for the anisotropies of the substance. The distinguishing characteristic of the liquid crystalline state is the tendency of the molecules (mesogens) to point along a common axis, called the director. This is in contrast to molecules in the liquid phase, which have no intrinsic order. In the solid state, molecules are highly ordered and have little translational freedom. The characteristic orientational order of the liquid crystal state is between the traditional solid and liquid phases and this is the origin of the term mesogenic state, used synonymously with liquid crystal state. Note the average alignment of the molecules for each phase (Fig.1.1):
Fig.1.1 Average alignment of the molecules: a) solid phase, b) liquid crystal phase, c) liquid phase.
It is sometimes difficult to determine whether a material is in a crystal or liquid crystal state. Crystalline materials demonstrate long range periodic order in three
dimensions (8). By definition, an isotropic liquid has no orientational order.
Substances that are not as ordered as a solid, yet have some degree of alignment, are thus properly called liquid crystals. Liquid crystals can be classified into two main categories:
thermotropic liquid crystals;
4
While these two types of liquid crystals are distinguished by the mechanisms that drive their self-organization, they are similar in many ways. Thermotropic transitions occur in most liquid crystals, and they are defined by the fact that the transitions to the liquid crystalline state are thermally induced. That is, one can arrive at the liquid crystalline state by raising the temperature of a solid and/or lowering the temperature of a liquid. Thermotropic liquid crystals can be classified into two types: enantiotropic liquid crystals, which can be changed into the liquid crystal state from either lowering the temperature of a liquid or raising of the temperature of a solid, and monotropic liquid crystals, which can only be changed into the liquid crystal state from either an increase in the temperature of a solid or a decrease in the temperature of a liquid, but not both. In general, thermotropic mesophases occur because of anisotropic dispersion forces between
the molecules and because of packing interactions (9) (10).
There are mainly two types of mesogenic molecules which can originate thermotropic liquid crystals: discotics and rod-shaped molecules.
Discotics are flat disc-like molecules consisting of a core of adjacent aromatic rings. This allows for two-dimensional columnar ordering. Rod-shaped molecules have an elongated, anisotropic geometry, which allows for preferential alignment along one spatial direction.
As showed in Fig 1.2, rod-like molecules (a) organize themselves into layers, whereas disc-like molecules (b) form columns that can be arranged parallel to each other in a two-dimensional lattice.
A bend introduced in the rigid core leads to 'banana-shaped' molecules (c). The rotation of these molecules around their long axis is restricted and they adopt a directed order within the layers. Depending on the bending direction in adjacent layers, either antiferroelectric or ferroelectric smectic phases may result.
Molecules with a conical shape (d) can lead to a polar order within columns. The polar direction of neighbouring columns may be parallel or anti-parallel.
Sawamura (11) have made a 'shuttlecock-shaped' molecule (e) based on the C60
5
Fig.1.2 Shape-depending organization of Liquid crystal molecules
In contrast to thermotropic mesophases, lyotropic liquid crystal transitions occur both by the influence of solvents, and by change in temperature (Fig 1.3). Lyotropic mesophases occur as a result of solvent-induced aggregation of the constituent mesogens into anisotropic micellar structures. Lyotropic mesogens are typically amphiphilic, meaning that they are composed of both lyophilic (solvent-attracting) and lyophobic (solvent-repelling) parts. This causes them to form micellar structures in the presence of a solvent, since the lyophobic ends will collect together, out of the solvent environment. As the concentration of the solution is increased and the solution is cooled, the micelles increase in size and eventually coalesce. This process separates the newly formed liquid crystalline state from the solvent. A very large number of chemical compounds are known to exhibit one or several liquid crystalline phases. Despite significant differences in chemical composition, these molecules have some common features such as
6
Fig 1.3 Lyotropic mesophases depending on the Temperature and amphiphile concentration
1.3 Liquid crystal phases (14)
Most liquid crystal compounds exhibit polymorphism, or a condition where more than one phase is observed in the liquid crystalline state. The term mesophase is used to describe the "subphases" of liquid crystal materials. Mesophases are formed by changing the amount of order in the sample, either by imposing order in only one or two dimensions, or by allowing the molecules to
have a degree of translational motion (15)
Fig.1.4 Schematic representation of the liquid crystal phases for rod-like molecules
1.3.1 Nematic liquid crystal phase
It is characterized by molecules that have no positional order but tend to point in the same direction (see Fig 1.5). This reordering is thought to be due to the packing constraints of the molecules. This claim is supported by the fact that most liquid crystal molecules tend to be long thin molecules with a rigid central region.
7
Fig 1.5 Schematic representation of the nematic mesophase(left) and typical texture corresponding, showed by Polarized Optical Microscopy(right)
Molecules in this phase possess three degree of translational freedom, and they can move in all the directions. The viscosity of the nematic liquid crystals is similar to that of the isotropic liquid.
1.3.2 Smectic liquid crystal phase
The smectic state is another distinct mesophase present in some liquid crystal substances. Molecules in this phase show a degree of translational state not present in the nematic. In the smectic state, the molecules maintain the general orientational order of nematics, but in addition tend to align themselves in layers or planes. Motion is restricted to within these planes, and separate planes are observed to flow past each other. Within each layer the liquid crystal is essentially a two dimensional nematic liquid crystal. The increased order means that the smectic state is more "solid-like" than the nematic. This positional ordering may be described in terms of the density of the mass centers of the molecules:
(1.1 )
where z is the coordinate parallel to the layer normal; the average density of the fluid is Po, d is the distance between layers and ψ is the order parameter. When
|ψ|=0 there is no layering and the material is nematic, but if |ψ|>0 then some
8
types of smectic materials (16). In particular, in the smectic-A mesophase, the
director is perpendicular to the smectic piane, and there is no particular positional order in the layer (Fig.1.6 a).
In the C mesophase (Fig.1.6 b), molecules are arranged as in the smectic-A mesophase, but the director is at a constant tilt angle measured normally to the smectic plane. In some smectic materials, called Sm-CA (Fig 1.6 c) or Anti-Ferroelectric Liquid Crystal (AFLC), the direction of this tilt may alternate to form a so called "herringbone structure". Smectic materials have potential advantages over nematics when used in liquid crystal displays. They exhibit better viewing angle characteristics, contrast ratio and can operate at high speed.
Similarly, the smectic-B mesophase (fig 1.6 d) orients with the director perpendicular to the smectic plane, but the molecules are arranged into a network of hexagons within the layer.
9
a
b
c
d
Fig.1.6 From the top: Smectic A (a), Smectic C(b), Smectic CA (c) and
10
1.3.3 Chiral nematic liquid crystal phase
This phase is typically composed of nematic mesogenic molecules containing a chiral center which produces intermolecular forces that favor alignment between molecules at a slight angle to one another. This leads to the formation of a structure which can be visualized as a stack of very thin 2-D nematic-like layers with the director in each layer twisted with respect to those above and below. This induces a helical director configuration in which the director rotates through the material (Fig.1.7). The molecules shown are merely representations of the many chiral nematic mesogens lying in the slabs of infinitesimal thickness with a distribution of orientation around the director. This is not to be confused with the planar arrangement found in smectic mesophases.
Fig.1.7 Schematic view of the helical director configuration.
Mesophases having this type of structure are called cholesteric mesophases. An important characteristic of the cholesteric mesophase is the pitch, p, which is defined as the distance the director to rotates one full turn in the helix (see Fig 1.9) A by-product of the helical structure of the chiral nematic phase is its ability to selectively reflect light of wavelengths equal to the pitch length, so that a color will be reflected when the pitch is equal to the corresponding wavelength of light in the visible spectrum. Due to this phenomena, cholesterics change color when the temperature changes. The effect is based on the temperature dependence of the gradual change in director orientation between successive layers, which modifies the pitch length resulting in an alteration of the wavelength of reflected light according to the temperature. The angle at which the director changes, can be made larger, and thus tighten the pitch, by increasing the temperature of the
11
molecules, hence giving them more thermal energy.
Similarly, decreasing the temperature of the molecules increases the pitch length of the chiral nematic liquid crystal. This makes it possible to build a liquid crystal thermometer that displays the temperature of its environment by the reflected color. Mixtures of various types of these liquid crystals are often used to create sensors with a wide variety of responses to temperature change. Such sensors are used for thermometers often in the form of heat sensitive films. In the fabrication of films, since putting chiral nematic liquid crystals directly on a black background would lead to degradation and perhaps contamination, the crystals are micro-encapsulated into particles of very small dimensions. The particles are then treated with a binding material that will shrink upon curing so as to flatten the microcapsules and produce the best alignment for brighter colors. Adjusting the chemical composition can also control the wavelength of the reflected light, since cholesterics can either consist of exclusively chiral molecules or of nematic molecules with a chiral dopant dispersed throughout. In this case, the dopant concentration is used to adjust the chirality and thus the pitch.
1.3.4 Chiral smectics liquid crystal phase
In a similar way to chiral nematics there are chiral forms of smectic phases. Fig.1.8 shows schematically a chiral smectic C material, denoted by smectic-C*. Consistent with the smectic-C, the director makes a tilt angle with respect to the smectic layer. The difference is that this angle rotates from layer to layer forming a helical structure. In other words, the director of the smectic-C* mesophase is not parallel or perpendicular to the layers, and it rotates from one layer to the next (see Fig 1.10).
Fig. 1.8-Director tilt in smectic-C* phase
This helix may be suppressed by placing the liquid crystal in a cell where the material is sandwiched between two glass plates. Such systems are said to be
12
surface stabilized. Once the helix is suppressed and the directors in each layer are forced to lie in the plane of the glass plates the chiral nature of the molecules creates a spontaneous polarization within each layer.
In some smectic mesophases, the molecules are affected by the various layers above and below them. Therefore , a small amount of three-dimensional order is observed. The Smectic-G phase is an example demonstrating this type of arrangement (Fig 1.11)
Fig 1.9 Chiral nematic phase
13
Fig 1.11 Smectic G phase 1.3.5 Columnar liquid crystals phases
These phases are different from the previous types because they are shaped like disks instead of long rods. This mesophase is characterized by stacked columns of molecules (Fig.1.12). The columns are packed together to form a two-dimensional crystalline array. The arrangement of the molecules within the columns and the arrangement of the columns themselves leads to new mesophases.
Fig. 1.12 Columnar liquid crystal phase.
1.4 Physical properties of liquid crystals
The physical behavior of liquid crystals can be divided into scalar and non scalar properties. A typical scalar property is the orientational order parameter S. Important non scalar properties are the dielectric, diamagnetic, optical, and elastic coefficients.
1.4.1 Orientational order parameter
To quantify just how much order is present in a liquid crystal material, an order
14
(1.2)
In this equation e is the angle between the axis of an individual molecule and the director of the liquid crystal. The brackets denote an average over all of the molecules in the sample (Fig.1.13).
Fig. 1.13 Tilt angle between the molecular axis and the director n.
In an isotropic liquid, where all the orientations are possible, the average of the cosine terms is zero, and therefore the order parameter is equal to zero. For a perfect crystal, the order parameter evaluates to one. Typical values for the order parameter of a liquid crystal range between 0.3 and 0.9, with the exact value a function of temperature, as a result of kinetic molecular motion.
When the molecular symmetry is not perfectly cylindrical, as in a real nematic
liquid crystal, the order parameter becomes a matrix whose generic element is (18):
(1.3)
where ij and αβ are respectively the coordinates of the fixed and molecular
system; θjβ is the angle between the j axis and the β axis; δij and δαβ are
Kroenecker's delta functions.
1.4.2 Dielectric anisotropy
The response of liquid crystal molecules to an electric field is the major characteristic utilized in industrial applications. The ability of the director to align along an external field is caused by the electric nature of the molecules.
15
Permanent electric dipoles result when one end of a molecule has a net positive charge while the other end has a net negative charge, giving an unbalanced distribution of charge. A liquid crystal molecule containing a permanent dipole might or might not be polar, depending on the symmetry of the dipoles within or attached to the main molecular body. When an external electric field is applied to the liquid crystal, the dipole molecules tend to orient themselves along the direction of the field. In the Fig.1.14, the black arrows represent the electric field vector and the red arrows show the electric force on the molecule.
Fig. 1.14 Effect of the applied electric field on the dipole molecules
Even if a molecule does not form a permanent dipole, it can still be influenced by an electric field. In some cases, the field produces slight rearrangement of electrons and protons in molecules such that an induced electric dipole results. While not as strong as permanent dipoles, orientation with the external field still occurs. By applying an electric field along the long axis of the liquid crystal, the permittivity (i.e. parallel to the director) is observed. However, the application
of an electric field perpendicular to this axis results in a permittivity . The
anisotropy of the dielectric permittivity is given by
(1.4)
'the dielectric anisotropy can be positive or negative depending by the orientation (respectively parallel or perpendicular) of the molecular dipole respect to the molecular axis. The electric energy density for volume unit depends on the electrical displacement according to the following equation:
16
when is positive there is a minimum in the energy if n and E are parallel,
while when is negative the energy reaches a minimum if n is perpendicular to
E. Values for of technically useful material range from between -6 to +50. The
mean dielectric permittivity for a nematic liquid crystal can be described by (19):
(1.6)
1.4.3 Diamagnetic anisotropy
The effects of magnetic fields on liquid crystal molecules are analogous to electric fields. Because magnetic fields are generated by moving electric charges, permanent magnetic dipoles are produced by electrons moving about atoms. When a magnetic field is applied, the molecules will tend to align along or opposite the field. The macroscopic magnetization M is given by:
(1.7)
where ε and β are the axis of the molecular reference system; χ is the magnetic susceptibility. The diamagnetic properties of nematogenic liquid crystal can be
described by two susceptibilities and The diamagnetic anisotropy is
defined as
(1.8)
using the above equation, the magnetization can be written as follows:
(1.9)
and the corresponding density of magnetic energy far volume unit is then given by (20):
17
(1.10)
Usually ; for this reason the minimum of the energy is reached when n
has the same orientation of the field. The director orientation also depends on surface interactions: for a nematic liquid crystal tangentially oriented respect to the surface and subjected to a strong surface interaction, the director reorientation increases with the distance from the surface, until it become parallel to the field direction. It has been calculated that the angle between the director and the
magnetic field is described by the following expression (21):
(1.11)
S is the length of magnetic coherence, and assuming K=K11=K22=K33 it is
expressed by the following equation:
(1.12)
A magnetic field H is able to induce an elastic deformation over a length scale
; over a nematic liquid crystal with diamagnetic anisotropy and elastic
constant K (µ0 is the magnetic permeability constant). This equation provides an
order of magnitude estimate for the field required to reorient the liquid crystal director. Intuitively ; can be defined as the thickness of the nematic liquid crystal layer where the orientation depends more on the surface interaction than on the field action.
The diamagnetic anisotropy is linked to the order parameter S by (18):
(1.13)
18
and perpendicular to the magnetic field and and are the susceptibilities of
the liquid crystal molecule parallel and perpendicular to the molecular longitudinal axis.
1.4.4 Optical anisotropy
Liquid crystals are found to be birefringent, due to their anisotropic nature: they exhibit double refraction (having two indices of refraction). Light polarized parallel to the director has a different index of refraction (that is to say it travels at a different velocity) than light polarized perpendicular to the director.
Thus, when light enters a birefringent material, such as a nematic liquid crystal sample, the process is modeled in terms of the light being broken up into the fast (called the ordinary ray) and slow (called the extraordinary ray) components (Fig. 1.15).
Because the two components travel at different velocities, the waves get out of phase. When the light rays are recombined as they exit the birefringent material,
the polarization state has changed because of this phase difference (22).
Fig. 1.15 Light traveling through a birefringent medium.
The birefringence of a material is characterized by the difference, Δn, in the
indices of refraction for the ordinary and extraordinary rays.
Quantitatively, since the index of refraction of a material is defined as the ratio of the speed of light in vacuum to that in the material, we have for this case:
19
and (1.14)
for the velocities of a wave traveling perpendicular to the director. The maximum value for the birefringence is given by:
(1.15)
where and are the refraction index of the light polarized having the
electrical vector respectively parallel and perpendicular to the director. Δn varies from zero to the maximum value, depending on the travel direction. In the general case of a wave traveling in an arbitrary direction relative to the director in a liquid
crystal sample, no is coincident with and is given by (23):
(1.16)
where e is the angle between the incident ray and the director.
The condition ne>no describes a positive uniaxial material, so that nematic
liquid crystals are in this category. For typical nematic liquid crystals, no is
approximately 1.5 and the maximum difference, Δn, may range between 0.05 and 0.5. The Δn value depends on the wavelength of the light and the temperature.
1.4.5 Elastic constants
Liquid crystals respond to an external stimulus with an elastic reaction, varying only the molecules orientation. The elastic reaction for volume unit in apolar, achiral, nematic liquid crystal with cylindrical symmetry depends on three elastic constant K11, K22 and K33 as follow (24):
(1.17)
20
(K11), twist (K22) and bend (K33) (see Fig.1.16).
The elastic constants are strongly temperature dependent.
Bend Twist Splay
Fig.1.16 Elastic deformations of a liquid crystal 1.4.6 Anchoring energy
The director orientation in a nematic liquid crystal at the interface with a solid surface can be defined by two angles: the polar angle α, and the azimuthal angle
φ. The orientation is homeotropic when θ=0, while gives a planar or
homogenous orientation (Fig.1.17).
Fig. 1.17 Planar and homeotropic orientation of the director.
The surface energy FS it is composed by two terms: the isotropic superficial
energy FiS , and the anchoring energy. The latter is expressed by the following
equation (17):
(1.18)
21
director by an angle δθ from the equilibrium direction.
The alignment of liquid crystal molecules, was from the begin a problem of main importance, in order to obtain macroscopically mono-oriented liquid crystal films to be employed in the display technology.
Because of their importance, the alignment methodologies will be discussed in another chapter (the third), while in the next theoretical chapter we will discuss one of their most interesting applications of liquid crystals, such as polymer dispersed liquid crystals (PDLC), that are of main importance in the fabrication of optical devices, like the intelligent windows, to be employed in several useful applications.
22
References
1. F. Reinitzer, Monatsh. Chem., 9, 421 (1888). 2. C. Oseen, Trans. Faraday Soc., 29, 883 (1933). 3. H. Zocher, Ibid., 29, 945 (1933).
4. W. Maier, and A. Saupe: Eine einfache molekulare Theorie des nematischen kristallinussigen Zustandes, Z. Naturforschung, A 13, 564-566 (1958).
5. F.C. Frank, Discussions Faraday Soc., 25, 19 (1958). 6. F. M. Leslie, Quart. J. Mech. Appl. Math., 19,357 (1966).
7. J. L. Ericksen, Arch. Ratl. Mech. Anal., 4, 231 (1960); 9, 371 (1962). 8. I. C. Khoo, Liquid Crystals, 2Ed, Wiley (2007).
9. D. Demus, J. Goodby, Handbook of Liquid Crystals, Vol.1 - Fundamentals, Wiley-VCH, (1998).
10. S. Singh, Liquid Crystals Fundamentals, WSP (2002). 11. M. Sawamura et al., Nature, 419, 702 (2002).
12. T. Kato, Liquid Crystalline Functional Assemblies and Their Supramolecular Structures, Springer (2008).
13. A. M. Neto, The Physics of Lyotropic Liquid Crystals - Phase Transitions and Structural Properties, Oxford (2005).
14. I. Dierking, Textures of Liquid Crystals, Wiley-VCH, (2003). 15. S. Chandrasekhar, Liquid Crystals, 2th Ed, Cambridge (1992). 16. H. Sackmann, and D. Demus, Mol. Cryst., 2,81 (1996).
17. P. G. De Gennes, J. Prost, The physics of liquid crystals, 2th Ed., Oxford University Press, (1993).
18. W. Maier, and A. Saupe, Z. Naturf., 13 A, 564 (1958),14 A, 882 (1959),15 A, 287 (1960).
19. W. Maier, and G. Meier, Z. Naturf., 16 A, 262 (1961).
20. E. A. Guggenheim, Thermodynamics, 5th ed., North-Holland (Amsterdam), (1967). 21. F. Brochard, and P.G. de Gennes, J. Phys (Fr.), 21,691 (1970).
22. T. Scharf, Polarized Light In Liquid Crystals And Polymers, Wiley (2007).
23. K. Kondo, M. Arakawa, A. Fukuda, and E. Kuze, Jpn. J. Appl. Phys., 22, 394 (1983). 24. A. Rapini, and M. J. Papoular, J. Phys. (Paris) Colloq., C4 30, C4-C5 (1969).
23 CHAPTER 2: PDLC
2.1 Introduction
Polymer dispersed liquid crystals (PDLC) consist of micron-sized droplets of a low-molecular-weight nematic liquid crystal in a polymer matrix. These materials
are able to modulate light through a controllable scattering (1).
In the absence of an electric field (zero field state) the director in the nematic droplets has a random orientation and the material strongly scatters light (Fig.2.1a).
a b
Fig.2.1 PDLC devices, a) ON state, with droplets aligned by an applied
electric field, b) OFF state, with randomly oriented nematic liquid crystal
droplets.
Droplets alignment is obtained applying an electric field such that the droplets refractive index nearly matches that of the polymer, and the material become transparent (fig. 2.1b). If the applied electric field is turned off, the droplets return to their original scattering orientation.
2.2 Nematic configurations within droplets
When liquid crystals are confined to small cavities such as in PDLC droplets, elastic deformations act on the director structure creating particular director configurations. The factors determining the director configuration adopted by a droplet include properties intrinsic (physical and chemical) to the liquid crystal, anchoring characteristics of the liquid crystal at the droplet interface, the presence
24
of external fields, and the size and the shape of the droplets.
The most common droplet alignment in PDLC films is the bipolar
configuration (2) (3) (Fig.2.2a). In this configuration the director field is anchored
parallel at the interface. The director field possesses cylindrical symmetry, with the symmetry axis defined by two point defects, named "boojums", which lie at the opposite ends of the droplets. These point defects are regions, in which there is a distributed orientation of the director. In a spherical droplet there is no preferred alignment of the droplet symmetry axis, as all the orientations are equally energetically favorable.
When the symmetry of the cavity is reduced, the bipolar configuration is maintained, but the symmetry axis tends to align along the longest distance available in the cavity. This occurs in order to minimize the bend and twist deformation energy. If a sufficiently strong electric or magnetic field is applied to bipolar droplets, the droplet director will reorient to lie parallel to the applied field for positive dielectric anisotropy materials, or perpendicular to the field for
negative dielectric anisotropy materials (4).
A variation on the structure of bipolar droplets is to add a twist deformation to the director field, while maintaining the point defects of the bipolar structure. A
twisted bipolar structure was first observed by Volovik and Lavrentovich (5).
Nematic droplets with a line defect running along the diameter posses a concentric (or toroidal) structure; the nematic director field is everywhere perpendicular to this line and arranged in a series of concentric circles. Theoretical considerations have questioned the stability of the concentric configuration, but several experiments showed results consistent with a stable concentric structure.
The configuration of nematic droplets that are possible with perpendicular alignment are quite different from those with parallel alignment. The most common are the radial configuration (see Fig.2.2b), with a point defect at the
centre of the droplet, named hedgehog (6), and the axial configuration with an
25
a b c
Fig.2.2 Droplet configuration: a) bipolar, b) radial, and c) axial.
The stability of these configurations depends on the intensity of the anchoring
strength and the droplets size (7): large droplets with strong anchoring show radial
configuration, while for small droplets in a weak anchoring case the axial configuration is preferred.
2.3 Preparation methods for PDLC films
Two basic methods have been developed for preparing polymer materials which contain a dispersion of droplets: encapsulation and phase separation. Each of these methods is fundamentally different.
2.3.1 Encapsulation
This technique was introduced by Fergason (8) as the original method for
forming polymer dispersed liquid crystals and it was used by P. S. Drzaic (9). In
the original formulation an aqueous solution of polyvinyl alcohol (PVA) is mixed with a nematic liquid crystal and then rapidly stirred. The size of the nematic droplets is a function of the stirring speed and time, the viscosity of the PVA solution, and the viscosity of the liquid crystal. The emulsion is coated onto a conductive transparent substrate, such as indium-tin-oxide (ITO) coated polyester, and the film allowed to dry. Once the film is dry, a second conductive substrate is laminated to form the final device. In addition to PVA other materials such as ammonium polyacrylate and gelatine have been used as the encapsulating medium for liquid crystals.
26
2.3.2 Phase separation methods
The phase separation method involves first forming an homogeneous solution of polymer or pre-polymer with a liquid crystal; the liquid crystal separates from the solution, and droplet formation and finally polymer solidification occur. The use of phase separation processes has been pioneered by Doane and coworkers (10)
. Doane has coined acronyms for three broad classifications of phase separation process:
thermally induced phase separation (TIPS)
solvent induced phase separation (SIPS)
polymerization induced phase separation (PIPS)
2.3.2.1 TIPS
The TIPS process is useful for thermoplastic polymers. In this process a binary mixture of polymer and liquid crystal forms an homogeneous solution at elevated temperatures. Cooling this solution into the miscibility gap causes phase separation of the liquid crystal; the separation process ends when the polymer viscosity is so high that the droplets do not grown and their size become stable. The thermoplastic polymer has to become a low viscous liquid with the heating: in this way is possible to obtain a homogeneous solution. The liquid crystal has to be completely soluble in the melt polymer.
Polymers such as polymethylmethacrylate (PMMA), polyvinylformal (PVF) (11)
and polyvinylbutanal (PVB), form droplet dispersions with cyanobiphenyl liquid crystal materials. Thermoplastic materials can also be made from epoxy
systems which form extended-chain molecules instead of cross-linked systems (12).
The droplet size is governed by the rate of cooling and depends upon a number of material parameters such as viscosity, chemical potentials, diffusion, etc..
TIPS technique shows some advantages respect to the other phase separations techniques. It could be possible to improve the samples homogeneity with repetitive heating and cooling of the material. The droplet diameter can be varied by adjustment of the rate of cooling: with a high cooling rate the liquid crystal hasn't enough time to separate and samples with low droplets density and size are
27
obtained, due to the break off of the growth. A low cooling rate produces PDLC with high droplet density and longer droplet diameter. TIPS allows to change easily the droplets shape; if the PDLC is softened without to be melted, it is possible to obtain with low pressures, stretched droplet.
2.3.2.2 SIPS
Phase separation by solvent evaporation is useful with thermoplastics which melt above the decomposition temperature. The liquid crystal and polymer are dissolved in a common solvent, forming a homogeneous solution. The solvent is then removed by evaporation, resulting in phase separation and polymer
solidification (13). The droplet dimension is governed by the evaporation rate: the
higher is this rate, the smaller are the droplets. SIPS technique is useful because allows to prepare PDLC without drastic conditions such as high temperature.
2.3.2.3 PIPS
Photopolymerized PIPS systems are a most versatile and common method of creating PDLC films. Phase separation by polymerization is useful when the pre-polymer materials are miscible with the low molecular weight liquid crystal compounds. The process starts with a homogeneous solution made by mixing the pre-polymer with the liquid crystal. Polymerization is induced through a condensation reaction or, in other cases, it may proceed by a free radical polymerization or through a photo-initiated polymerization where phase separation is induced by an UV lamp. The solubility of the liquid crystal decreases in the growing polymer chains until the liquid crystal phase separate, forming droplet. The droplets grow until gelation of the polymer locks in the droplet morphology.
Droplets size is controlled by the rate of polymerization and by the types of liquid crystal and polymer used. The rate of polymerization depends on the curing temperature and the relative concentration of components in thermally cured
polymers or by light intensity for photochemical polymerization (14) (15) .
28
methacrylate chemistries have been extensively used (16) (17) (18) .
Many acrylate systems show a droplet morphology although wide variations
can be found in droplet sizes, shapes and interconnectivity (19). Dramatic changes
in film morphology could be achieved through relatively minor changes in the starting materials. As general trend:
The starting mixture must show good solubility between the liquid
crystal and polymer-forming components
A multifunctional acrylate can increase the rate of cure and phase
separation in the system, which affects both the droplet size and the film morphology.
PDLC systems can be made with a high degree of interconnection between nematic domains. In the extreme can resemble interpenetrating networks of LC and polymer (fig 2.3).
Fig 2.3 Different morphologies in PDLC film
Spatially-varying PIPS structures can be formed by modulating the intensity of the light across the film during cure. For example a mash can be used to expose different portions of the PDLC film to different cure intensities, or we can use the interference of crossed laser beams to form a sinusoidal intensity pattern in the
film (20) (21). Such films act as an electrically-controllable diffraction grating for
light.
2.4 Polymer networks
With “polymer network” is indicate a PDLC system with only a few percent of a highly-crosslinked polymer, like liquid crystalline diacrylates. The orientation of this network can be quite durable, with its structure unaffected by external fields
29
or change in temperature (22). This polymer mesogenic skeleton can dominate the
local orientation of the surrounding low molar mass liquid crystal and consequently the alignment effects of the network can be used to the alter the electro-optical properties of conventional liquid crystalline devices.
The morphology of the mesogenic network PDLC systems can vary widely with the ratio of monomer/LC. A high concentration of polymer the diacrylate
forms a system with micro-sized domains of polymer and LC (23). Low
concentration of polymer reflect in a much fine phase separation (nanometer).
2.5 Aspect of film structure
The microstructure of dispersed nematic films is a critical aspect in the electro-optical performance of the PDLC devices. Despite the large number of methods available to create PDLC systems, the resulting films possess several common structural features of interest, like: PDLC film thickness; sizes and shapes of LC droplets; polymer morphology; degree of cure in polymerized PDLC systems; any preferential alignment of the LC director field; the volume fraction of LC dissolved into polymer matrix etc..
The size and shape of the LC domains are critical factors in controlling droplet alignment and electro-optical properties of the PDLC.
To study the droplets dimension is difficult because in PDLC films the droplets diameters is not constant and the shape of the droplet varies due both to the preparation methods and to the interactions with the surface of the cell electrodes. Every PDLC is characterized, from a morphological point of view, by a medium diameter which generally corresponds to the prevalent measured value in the whole sample. The experimental techniques commonly used are the optical microscopy, when the droplets size is larger than 3 micron, and the scanning electron microscopy (SEM): the first allows to observe directly the PDLC, with the second is possible to observe cavity images obtained after removing the liquid
crystal through sublimation or washing with the solvent (24) (25) (26) (27) (28) .
The SEM analysis is the most general method for determining droplet size distributions in phase separation films, but care must be taken, due to the random
30
spacing between droplets that reflect in slices not in the middle of the droplets, or to the insufficient statistics (somewhat fewer than 1000 droplets were processed by the SEM analysis). The bi-dimensional images, achieved by SEM analysis, don't allow to determine completely the shape and the density of the droplets.
An attempt to optimize the methods for the structural study of the PDLC has
been made by Havens (29): he analyzed the SEM imagines and used the statistic
information collected in order to obtain indications about the actual volume occupied by the droplets. It is also noted that the medium diameter of the droplets
in PDLC films can be obtained also using diffusion optical measurements (30).
Several methods are achieved (31) (32) (33) taking account of problems like the under-
or over-counting in the droplet distribution by SEM analysis, helpful in this case is the use of informatics for the data post elaboration.
2.6 Liquid crystal/polymer phase separation
The phase separation of LC and polymer is a crucial feature. Starting from an homogeneous solution, the polymeric components become sufficiently incompatible with the LC to induce the formation of separate fluid and polymer. Depending to the chemical nature of the components and to the kinetics of the process driving the phase separation, this determine the morphology and consequently the electro-optical properties of the resulting PDLC film.
The analysis of Phase separation process found in PDLC films is often simplified by treating the system as a simple binary mixture.
2.6.1 Phase diagrams for LC/monomer mixtures
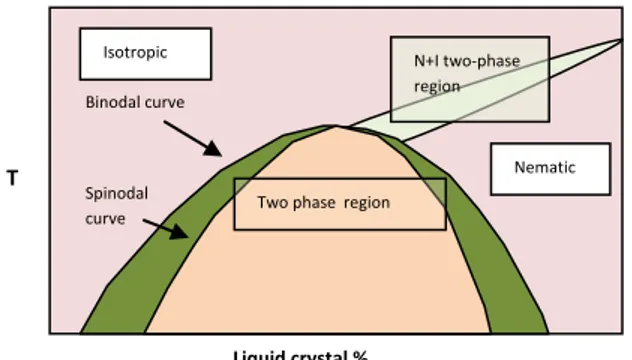
In PDLC system made by PIPS processes the initial system consist of a mixture of LC, monomers and sometimes low molecular weight oligomers. Plotting temperature versus LC composition the phase diagrams of PIPS systems typically show upper critical solution temperature (UCST) behavior (fig 2.4). A single phase is stable at high temperatures, the miscibility decreases with decreasing temperature and at low temperature we have a phase separation of the mixture.
31
The temperature at which phase separation is allowed depend on the relative concentration of the LC and monomer/polymer solution and on the relative solubility of the two components of the mixture. At the extremes of the concentration the two components are completely miscible and not phase separate at any temperature. The upper curve in the figure define the temperatures at which the separation is allowed for a solution at a given concentration.
There are two curves which separate single and dual-phase system:
- The lower curve (Spinodal curve) marks the region where the phase
separation occurs spontaneously without need of activation
- The upper curve (Binodal curve) defines the point at which the
phase separation become energetically possible, but not necessary.
In the region between spinodal and binodal curves the system is metastable, the phase separation is thermodynamically allowed but may occur depending of the size of the activation barrier and if nucleation sites are available.
If phase separation occur in spinodal or binodal regime, controls the kinetics of the phase separation process, affecting the structure of the polymeric matrix.
Fig 2.4 Idealized representation of a binary phase diagram between a liquid crystal and an isotropic monomer or polymer
Another important aspect is that, when we have phase separation, the two phases do not simply separate into a pure LC phase and a pure monomer/polymer phase, but the mixture separate into a LC-rich phase and a LC-poor phase. The concentrations of LC in each phase, at a given temperature, are defined by a line,
T Liquid crystal % Isotropic Nematic Spinodal curve Binodal curve
Two phaseregion
N+I two-phase region
32
which connects the opposite sides of bimodal and spinodal curve at the same temperature (34) (35).
2.6.2 Phase separation in the binodal and spinodal regimes
Phase separation is driven by the thermodynamics of the solution but kinetic processes like nucleation and molecular diffusion often determine the nature of the process (36).
Two distinct mechanisms, that can lead to a different types of polymer morphology in the final film, are recognized for the process of phase separation:
Nucleation and growth mechanism if the system requires an activation energy for the initiation of a new phase. This occur under the binodal curve in the metastable portion of the phase diagram,
Under the spinodal curve if the activation energy is not required (without activation barriers).
The lack of activation barriers changes significantly the nature of the process and lead to a spinodal decomposition mechanism. In this process concentration gradients spontaneously appear in an interconnected network structure, and these concentration gradients grow sharper and larger as phase separation proceeds. In contrast, the nucleation and growth process phase separation begin in random, unconnected spots which grow over time and these phase separated area do not
change in concentration (37) (38) .
Fig 2.5 Two-dimensional representation of the phase structure in a nucleation and growth phase separation process and in a spinodal decomposition.
Nucleation & growth Spinodal decomposition System evolution Single phase
33
2.7 Electro-optical effects
2.7.1 Light scattering and index matching
The contrast in a PDLC display is defined as the ratio between the transmitted
light in the transparent state and that transmitted in the opaque state (39). PDLC are
never completely transparent. For example, an object observed through a PDLC in
the on state, is darkened due to the residual scattering (40). The intensity of the
transmitted light is expressed by the following equation:
(2.1)
where is the volume density of the droplets, d the path length through the
shutter (d=d0cos, where d0 is the PDLC thickness), is the angle that the
incident light makes with the normal to the cell surface, is the scattering
capability of a droplet. In the transparent state ideally there is not light scattering
and =0. For nematic droplets of radius R used in PDLC light shutters in the
visible region, the cross section can be approximated by the following equation
(41) :
(2.2)
where 0 is the geometrical cross section of the droplet, K=2/, is the
wavelength of the light; np is the refraction index of the polymer matrix, n() is
the refraction index of a nematic droplet with a positive dielectric anisotropy
which has been aligned by an applied field at the angle , and given by:
(2.3)
where no and ne are the ordinary and extraordinary refractive indices of the
aligned droplet, respectively. The most transparent condition exists when =0,
34
equal to the ordinary refraction index of the liquid crystal, but at finite angle
when np>no. The angular dependence of the light transmitted through the shutter
falls off faster at lager angles than those calculated with the previous equations
due to the reflections from the air-glass surface of the cell (42).
The intensity of the transmitted light and, consequently, the contrast, depends
on the temperature. This feature was studied by Vaz et al (43) (44) (45) (46) .
From the experimental data results at temperatures above TNI, the refractive
indices of the liquid crystal and the polymer matrix decrease with temperature at nearly the same rate so that the index difference between liquid crystal and polymer is nearly independent of temperature. In the nematic phase, as the temperature decreases, the ordinary refractive index decreases while the extraordinary refractive index increases; this means that the OFF state scattering will increase and the OFF state transmittance will decrease with decreasing temperature. In the ON state, the transmittance will initially increase as the temperature is lowered below TNI, it will reach a maximum value at the temperature for which the refraction index of the polymer is equal to the ordinary refraction index of the liquid crystal, and will decrease monotonically as the temperature is decreased further. To maximize the PDLC ON state transmittance over a given operating temperature range, the polymer should be index-matched to the liquid crystal at some temperature within the operating range. Diffuse light incident on a PDLC device causes haze effect in the transparent state, limiting the
contrast of the shutter (47) . The contrast depends on the entity of the PDLC opacity
in the OFF state. Haze is defined as the fraction of light which is scattered out of
at 2.5° aperture, normalized to the total light transmitted by the sample. Zumer
(48)
has made theoretical studies of the light scattering from a single nematic droplet for various director configurations. Scattering profile, as well as the total and differential cross sections, were calculated in the Rayleigh-Gans (small droplet) and Anomalous Diffraction (large droplet) regimes. The RG approximation is an approach to light scattering appropriate to systems in which the induced phase shift of the light is weak. The Rayleigh-Gans (RG) approximation assumes that the maximum phase shift induced by the scattering object is small, on the order of
35
(2.4)
The anomalous diffraction (AD) approximation assumes that
(2.5)
Light scattering for PDLC light shutters lies intermediate between these two theoretical regimes where there is some overlap. In the opaque state single scattering calculations can describe the attenuation of light by PDLC films provided multiple scattering does not significantly change the fraction of the incident power scattered out of the acceptance solid angle of the detection system (49)
. Attenuation measurements are not sensitive to change in the angular distribution of the scattered light produced by multiple scattering outside the detector acceptance cone.
2.7.2 PDLC film operating voltage
Liquid crystals dispersed in a polymer matrix have been object of great interest over the last several years due to two principal reasons:
o These systems allow to study the behavior of nematic phases confined in small cavities and while subject to hard surface interactions;
o They can be easily utilized in the production of electro-optical shutters.
One of the most important electro-optical parameters of PDLC films is the voltage required to achieve an electro-optical effect. From a material point of view, it is more appropriate to discuss the reorientation field (voltage/film thickness) of a PDLC film. Like in other liquid crystal devices, this reorientation field is determined by the balance of the elastic forces (which resist orientation) and electric forces (which induce orientation).
36
transparent (ON state) after application of an electric or magnetic field of suitable intensity. The opaque-transparent transition (OFF-ON) induced by the field is known as "switching". The switching voltage of a PDLC light shutter depends upon a variety of factors: it depends on the nematic director configuration of the droplet, on the shape, the size and the density of the droplet, on the thickness of the PDLC cell. Perhaps the dominating factors for the response voltage are the resistive and the dielectric properties of the nematic liquid crystal and the polymer.
The electric field inside the droplets of PDLC shutters is not the same as the applied electric field, E= V/d, where V is the applied voltage and d the thickness of the PDLC film. Considering an isolated spherical droplet in a polymeric material, the electric field inside the droplet, E', is related to the applied field by the expression (50):
(2.6)
Where lc and p are the dielectric constants of the liquid crystal and the
polymer, respectively. The dielectric constant for materials with nonzero conductivity can by written as
(2.7)
where ‟ is the real component, is the resistivity and is frequency of the
applied voltage.
In the resistive regime ‟ << 1: such is the case in PDLC light shutters where the liquid crystal inside the droplet can be slightly contaminated with the polymer and the polymer can be plasticized with the liquid crystal, lowering the
37
(2.8)
Where V is the voltage applied to the electrodes and do the interelectrode
spacing.
To determine the threshold voltage for an electro-optic PDLC switch is necessary to consider the specific director configurations involved. In the case of a
radial configuration, droplets will switch at a threshold voltage, VR, according to
the expression:
(2.9)
Where de is the surface extrapolation length, and K is the elastic constant (in
the single constant approximation K=K11=K22=K33). In the case of a bipolar
configuration, choosing a simple elongated model, the switching voltage of a bipolar droplet is given by:
(2.10)
where l describe the extend of the elongation of the cavity defined as l=a/b, the ratio of the length of the semi-major axis, a, to the length of the semi-minor axis b.
The electro-optical response is determined studying the variation of the PDLC transmittance versus the applied electric field, whose values are calculated from the applied voltage normalized with respect to the film thickness. Two values of the electric field are particularly relevant: E10%, which is the electric field value able to increase the transparency to 10%, and E90%, the electric field value which induces an increase in the PDLC transmission of 90%. E10% is also known as the