2018
Publication Year
2021-02-01T16:53:50Z
Acceptance in OA@INAF
ASTRI data reduction software in the framework of the Cherenkov Telescope Array
Title
LOMBARDI, Saverio; ANTONELLI, Lucio Angelo; BIGONGIARI, Ciro; CARDILLO ,
MARTINA; LUCARELLI, Fabrizio; et al.
Authors
10.1117/12.2311293
DOI
http://hdl.handle.net/20.500.12386/30134
Handle
PROCEEDINGS OF SPIE
Series
10707
Number
ASTRI data reduction software in the framework of the
Cherenkov Telescope Array
Saverio Lombardi
∗a,b, Lucio Angelo Antonelli
a, Ciro Bigongiari
a, Martina Cardillo
c,
Fabrizio Lucarelli
a,b, Matteo Perri
a,b, Antonio Stamerra
a, Francesco Visconti
a,b, for the CTA
ASTRI Project
d,ea
INAF-OAR, Via Frascati 33, 00078 Monteporzio Catone (RM), Italy
b
ASI-SSDC, Viale del Politecnico s.n.c., 00133 Roma, Italy
c
INAF-IAPS, Via Fosso del Cavaliere 100, 00133 Roma, Italy
d
http://www.brera.inaf.it/astri/
ehttp://www.cta-observatory.org
ABSTRACT
The Cherenkov Telescope Array (CTA) is a worldwide project aimed at building the next-generation ground-based gamma-ray observatory. CTA will be composed of two arrays of telescopes of different sizes, one each in the Northern and Southern hemispheres, to achieve full-sky coverage and a ten-fold improvement in sensitivity with respect to the present-generation facilities. Within the CTA project, the Italian National Institute for Astrophysics (INAF) is developing an end-to-end prototype of one of the CTA Small-Size Telescope’s designs with a dual-mirror (SST-2M) Schwarzschild-Couder optics design. The prototype, named ASTRI SST-2M, is located at the INAF “M.C. Fracastoro” observing station in Serra La Nave (Mt. Etna, Sicily) and has started its verification and performance validation phase in fall 2017. A mini-array of (at least) nine ASTRI telescopes has been proposed to be deployed at the CTA southern site, during the pre-production phase, by means of a collaborative effort carried out by institutes from Italy, Brazil, and South Africa. The CTA ASTRI team has developed a complete end-to-end software package for the reduction, up to the final scientific products, of raw data acquired with ASTRI telescopes with the aim of actively contributing to the global ongoing activities for the official data handling system of the CTA observatory. The group is also undertaking a massive production of Monte Carlo simulation data using the same software chain adopted by the CTA Consortium. Both activities are also carried out in the framework of the European H2020-ASTERICS (Astronomy ESFRI and Research Infrastructure Cluster) project. In this work, we present the main components of the ASTRI data reduction software package and report the status of its development. Preliminary results on the validation of both data reduction and telescope simulation chains achieved with real data taken by the prototype and simulations are also discussed.
Keywords: Very-High-Energy Astrophysics, Imaging Atmospheric Cherenkov Telescopes, CTA, ASTRI, Data Reduction and Analysis Methods, Pipelines, Monte Carlo simulations.
1. INTRODUCTION
The Cherenkov Telescope Array (CTA)1,2is the next-generation ground-based observatory for very-high-energy
(VHE, E & 50 GeV) gamma-ray astronomy.3,4 To assure full-sky coverage, CTA will be composed of two arrays of
imaging atmospheric Cherenkov telescopes5(IACTs), one each in the Northern and Southern hemispheres, and of
three different classes of telescopes – large-size telescopes6(LSTs, diameter D∼23 m), medium-size telescopes7,8
(MSTs, D∼12 m and D∼9.5 m), and small-size telescopes9 (SSTs, D∼4 m) – with various fields-of-view and
designed to access different energy regimes in the wide energy range between ∼20 GeV and ∼300 TeV.10 The
LSTs (4 in each CTA site) will be sensitive to faint low-energy atmospheric showers and cover the full system sensitivity from ∼20 to ∼150 GeV. The MSTs (25 in the southern site, 10 in the northern site) will increase the
∗
Corresponding author
effective area and the number of telescopes that simultaneously observe each shower within the CTA core energy range (between ∼150 GeV and ∼5 TeV). The SSTs (70, placed in the southern site only) will be spread out over several square kilometers to increase the number of detected events and cover the sensitivity range from a few
TeV to the upper end of the electromagnetic spectrum accessible to CTA. The overall CTA sensitivity11–13 is
expected to be one order of magnitude better than the one of the current generation of IACT facilities (H.E.S.S.,14
MAGIC,15and VERITAS16) in the entire energy window. Alongside the improved angular and energy resolution,
this sensitivity will allow unprecedented insight into the non-thermal VHE Universe, casting light on fundamental
issues of galactic and extragalactic astrophysics, particle physics, fundamental physics, and cosmology.17
Three types of SSTs are foreseen in the CTA southern site, one with single-mirror and two with double-mirror
optics.9 One of the double-mirror implementations has been proposed and designed by the ASTRI (Astrofisica
con Specchi a Tecnologia Replicante Italiana) project,18–20a sub-project within CTA led by the Italian National
Institute for Astrophysics (INAF). ASTRI started in 2011 as a ”Flagship Project” with funds specifically assigned to INAF for CTA and provided by the Italian Ministry of Education, University and Research. The primary goal has been the design, deployment, and implementation of an end-to-end prototype of the CTA Small-Size Telescopes with a dual-mirror (SST-2M) Schwarzschild-Couder optics design. The prototype, named ASTRI SST-2M, has been installed in Serra La Nave (Mt. Etna, Sicily) and is currently undergoing the verification and performance validation phase. It is characterized by a wide-field dual-mirror Schwarzschild-Couder
opti-cal design21,22 and by an innovative Silicon photomultiplier (SiPM) camera23† managed by very fast read-out
electronics.24 Over the years, the ASTRI project has involved a wider community inside CTA and it is now a
collaborative international effort led by INAF and including Italian, Brazilian, and South African institutes. The current aim is to deploy a first set of (at least) nine ASTRI telescopes (hereafter named the ASTRI mini-array) so to contribute to the implementation of the initial part of the CTA southern site. The ultimate aim of the ASTRI project is to contribute to the installation of a considerable amount of the foreseen 70 CTA SSTs. A
detailed description of the ASTRI telescopes and overall project is given elsewhere in these proceedings.20 Other
ASTRI contributions included in these proceedings can be found in.23,25,26
Born as an end-to-end project, ASTRI, since its inception, has included the development of the full data
processing and archiving chain,27 from raw data up to final scientific products. For this purpose, dedicated
software for the reconstruction and scientific analysis of ASTRI data has been developed.28 The software has
been extensively checked on a MC basis and it is currently being tested with the first real data coming from the ASTRI SST-2M prototype, providing valuable feedback to the ongoing hardware verification and performance validation phase. In the following sections, we present an overview of the ASTRI data reduction software and report the status of its development and validation. The reduction of the first real data taking by the prototype is also discussed. Finally, a summary and outlook of this work is provided.
2. ASTRI DATA REDUCTION SOFTWARE
The ASTRI data reconstruction and scientific analysis software (henceforth A-SciSoft ) is the official software package of the ASTRI project for data reduction up to the final scientific products. After the initiation and definition phases, its design and development started in 2014 in full compliance with the general CTA data
management requirements29 and data model specifications30 available at that time. The software has been
designed to handle both real and Monte Carlo (MC) data, and to provide all necessary algorithms and analysis tools for characterizing the scientific performance of the ASTRI SST-2M prototype. Because the software was also designed with the array configuration in mind, it could potentially be used to perform the reduction of data acquired with the ASTRI mini-array. This will allow the realization of the proposed mini-array scientific
program31 during the pre-production phase of the CTA southern site. A-SciSoft is one of the first CTA data
reconstruction and analysis software prototypes to be developed and tested on a real data basis with the aim of
actively contributing to the ongoing global efforts for the official data handling system of the CTA observatory.32
†
The focal plane of the ASTRI prototype camera is currently composed of a matrix of SiPM sensors with a total of 1344 squared pixels with angular size of 0.19◦each (total camera field of view of ∼7.8◦) organized in 21 Photon Detection Modules (PDMs). The final layout for the ASTRI cameras to be installed in the CTA southern site will have 37 active PDMs (total camera field of view of ∼10.9◦).
Although the Earth’s atmosphere is opaque to VHE photons, astrophysical sources of VHE photons can be
observed from the ground by means of different types of instruments.5 Among them, the IACTs are capable
of efficiently imaging extended air showers generated by cosmic rays and astrophsyical gamma rays. The main purpose of A-SciSoft is to provide all necessary software tools to reconstruct the physical characteristics of astrophysical gamma rays (and background cosmic rays) from the raw data generated by the ASTRI telescopes. The software comprises a set of independent modules that implement every algorithm to perform the complete
data reduction‡. The final scientific products are then achieved by means of either science tools currently
being used in the CTA Consortium (e.g. ctools33 and Gammapy34) or specifically developed ones. The FITS
data format35 (currently adopted as input/output data format by the available CTA science tools packages and
considered as a possible data format for the entirety of CTA data processing) has been adopted for all ASTRI data levels (DLs) and data types. The software components have been written in C++ and Python and conceived to
be easily ported to parallel computing architectures such as multi-core CPUs and graphic accelerators (GPUs),36
and new hardware architectures based on low-power consumption processors (e.g. ARM37). NVIDIA R CUDA R38
has been used to port the most computationally demanding algorithms to GPUs. Python has been adopted to wrap the executable modules in efficient pipelines to be run on-site/off-site and interfaced to the ASTRI archive
system.39 To deploy A-SciSoft, a conda40package has been created making it very easy to install along with its
dependencies and run on Linux and MacOSX machines.
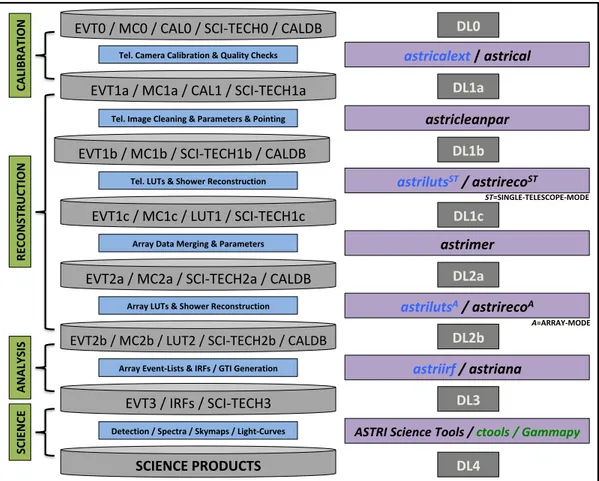
In Figure1, the functional design of the software package is depicted. A detailed and complete description of
general high-level requirements, data model, data flow, functional design, and framework of the A-SciSoft software
is given in a previous publication.28 In what follows, we simply recall some basic concepts and definitions that
are useful in this work (see Figure 1).
Data levels:
The ASTRI data levels are defined in compliance with the general CTA data model.30 To cope with
specific choices made for the actual ASTRI data processing implementation, some intermediate sub-data
levels (namely: DL1a, DL1b, DL1c, DL2a, and DL2b) have been introduced (see Figure 1). The main
ASTRI data levels are:
• Level 0 (DL0): raw data from the hardware/software data acquisition components that are perma-nently archived.
• Level 1 (DL1): telescope-wise reconstructed data (reconstructed shower image parameters per tele-scope).
• Level 2 (DL2): array-wise reconstructed data (reconstructed shower event parameters per array). • Level 3 (DL3): reduced data (selected list of events plus corresponding instrument response
func-tions).
• Level 4 (DL4): science data (high-level scientific data products).
• Level 5 (DL5): observatory data (legacy observatory data and catalogs). Data types:
The ASTRI data types definition follows the general specifications of the CTA data model.30 In order
to match the actual ASTRI data sub-levels layout, some specific data types have been introduced. The main ASTRI data types are:
‡
It is worth mentioning that a good number of the algorithms used by the A-SciSoft executable modules for the telescope- and array-wise reconstruction and analysis of the events are rather generic and independent of the specific ASTRI hardware. Hence, those algorithms could, in principle, be adapted for the reduction of data from different telescopes and array layouts.
EVT0 / MC0 / CAL0 / SCI-TECH0 / CALDB Tel. Camera Calibration & Quality Checks Array Event-Lists & IRFs / GTI Generation CAL IB RAT IO N RE CO N ST RU CT IO N AN AL YS IS SC IENC E astricalext / astrical astricleanpar astrilutsA / astrirecoA astriirf / astriana ASTRI Science Tools / ctools / Gammapy EVT1a / MC1a / CAL1 / SCI-TECH1a EVT1c / MC1c / LUT1 / SCI-TECH1c EVT2b / MC2b / LUT2 / SCI-TECH2b / CALDB EVT3 / IRFs / SCI-TECH3 SCIENCE PRODUCTS DL0 DL1a DL1c DL2b DL3 DL4 EVT1b / MC1b / SCI-TECH1b / CALDB astrilutsST / astrirecoST DL1b Tel. Image Cleaning & Parameters & Pointing Tel. LUTs & Shower Reconstruction Array LUTs & Shower Reconstruction Detection / Spectra / Skymaps / Light-Curves astrimer EVT2a / MC2a / SCI-TECH2a / CALDB DL2a Array Data Merging & Parameters ST=SINGLE-TELESCOPE-MODE A=ARRAY-MODE
Figure 1. Functional design layout of the ASTRI data reconstruction and scientific analysis software (A-SciSoft). Func-tional breakdown stages are shown as green boxes, data level inputs/outputs as gray cylinders, basic software funcFunc-tionalities as blue boxes, and data processing executables and packages as purple boxes. The executables written in black (pipeline executables) enter the pipeline for the end-to-end reduction of the scientific events, whereas the executables written in blue (auxiliary executables) are in charge of providing the auxiliary inputs to the pipeline (CAL1, LUT1/2, and IRF2) and they are employed only whenever necessary. ctools and Gammapy are written in green because they are external packages.
• EVTn (event data): EVT0 (telescope-wise raw shower image data); EVT1a (telescope-wise full cali-brated shower image data); EVT1b (telescope-wise cleaned shower image and image parameters data); EVT1c (telescope-wise fully reconstructed shower image data, including energy, arrival direction, and particle identity discrimination parameters); EVT2a (array-wise merged shower event data, includ-ing stereoscopic parameters); EVT2b (array-wise fully reconstructed shower event data, includinclud-ing energy, arrival direction, and particle identity discrimination parameters); EVT3 (array-wise reduced high-level event-list data).
• MCn (MC event data): similar to EVTn, including extra MC simulation information.
• CALn (calibration data): CAL0 (telescope-wise raw calibration data, triggered by calibration hard-ware); CAL1 (telescope-wise calibration coefficients/models to be applied to EVT0 data).
• MC-CALn (MC calibration data): similar to CALn, but from MC simulation.
• SCI-TECHn (technical data needed for data reduction and scientific analysis): SCI-TECH0 (subset of technical – engineering and auxiliary – data from array sub-systems and auxiliary facilities); SCI-TECH(1,2,3) (data-quality-check and monitoring data generated at each execution of each software module of the data reduction and including reduced information from original SCI-TECH0 data).
• LUTn (look-up-tables data): LUT1 (look-up-tables/models used by telescope-wise discrimination and reconstruction algorithms to estimate energy, arrival direction, and particle identity discrimination parameters of the events); LUT2 (look-up-tables/models used by array-wise discrimination and re-construction algorithms to estimate energy, arrival direction, and particle identity discrimination parameters of the events).
• IRFn (instrument response functions data): IRF2 (global IRFs covering all of the instrumental phase-space); IRF3 (reduced IRFs generated by filtering the IRF2 over several parameters, weighted by the observation configuration parameters of a particular event dataset).
• CALDB (calibration database): set of instrumental and pre-computed quantities stored in a dedicated (calibration) database available for being used throughout the entire data reduction chain.
Executables:
The executables that are implemented in the A-SciSoft software package are: Calibration executables:
• astricalext (ASTRI Calibration Coefficient Extractor): – Inputs: CAL0/MC-CAL0, SCI-TECH0;
– Outputs: CAL1, SCI-TECH1a;
– Basic functionalities: calibration coefficients extraction, data quality checks (using informa-tion from the camera system).
• astrical (ASTRI Calibration):
– Inputs: EVT0/MC0, CAL1/CALDB, SCI-TECH0; – Outputs: EVT1a/MC1a, SCI-TECH1a;
– Basic functionalities: calibration coefficients application, data quality checks (using informa-tion from different sub-systems).
Reconstruction executables:
• astricleanpar (ASTRI Cleaning and Parametrization): – Inputs: EVT1a/MC1a, SCI-TECH1a;
– Outputs: EVT1b/MC1b, SCI-TECH1b;
– Basic functionalities: image cleaning, image parameters calculation, telescope pointing calcu-lation, source position calculation.
• astrilutsST (ASTRI Single-Telescope-mode Look-Up-Tables):
– Inputs: EVT1b, MC1b; – Output: LUT1, SCI-TECH1c;
– Basic functionalities: telescope-wise discrimination and reconstruction LUTs generation.
• astrirecoST (ASTRI Single-Telescope-mode Reconstruction):
– Inputs: EVT1b/MC1b, LUT1/CALDB, SCI-TECH1b; – Outputs: EVT1c/MC1c, SCI-TECH1c;
– Basic functionalities: telescope-wise discrimination and reconstruction LUTs application. • astrimer (ASTRI Merging):
– Inputs: EVT1c/MC1c, SCI-TECH1c; – Outputs: EVT2a/MC2a, SCI-TECH2a;
– Basic functionalities: array-wise data merging and shower event parameters calculation.
• astrilutsA (ASTRI Array-mode Look-Up-Tables):
– Inputs: EVT2a, MC2a; – Output: LUT2, SCI-TECH2b;
– Basic functionalities: array-wise discrimination and reconstruction LUTs generation.
• astrirecoA (ASTRI Array-mode Reconstruction):
– Inputs: EVT2a/MC2a, LUT2/CALDB, SCI-TECH2a; – Outputs: EVT2b/MC2b, SCI-TECH2b;
– Basic functionalities: array-wise discrimination and reconstruction LUTs application. Analysis executables:
• astriirf (ASTRI Instrument Response Functions): – Inputs: EVT2b, MC2b;
– Outputs: IRF2, SCI-TECH2b;
– Basic functionalities: global IRFs generation. • astriana (ASTRI Analysis):
– Inputs: EVT2b, IRF2/CALDB, SCI-TECH2b; – Outputs: EVT3, IRF3, SCI-TECH3;
– Basic functionalities: reduced event-list generation, IRFs generation, good time interval (GTI) generation.
Science executables:
• ASTRI science tools, ctools,33Gammapy:34
– Inputs: EVT3, IRF3;
– Outputs: DL4 (scientific products);
– Basic functionalities: scientific products (detection plots, spectra, sky maps, light curves) generation.
Data flow overview:
• Calibration (DL0 → DL1a):
The ASTRI raw event data (EVT0/MC0) containing the full information available per pixel
(inte-grated signal amplitude in analog-to-digital converter41(ADC) counts and, if available, arrival time§)
for each triggered event are calibrated (separately for each telescope) in order to extract and convert
the signal into physically meaningful units (photo-electrons [pe]). The conversion coefficients42 are
extracted from specific camera calibration data (CAL0) and/or directly from a dedicated calibration
database (CALDB), organized following HEASARC’s CALDB format.43 All the engineering and
aux-iliary information coming from the different telescope(s) sub-systems that are needed for the scientific analysis and data-quality checks (SCI-TECH0) are extracted and processed from a subset of technical data. During the calibration process, the temporal evolution of the night sky background (NSB) level is evaluated and tracked for each camera pixel by means of specific data packets (taken simultane-ously with the EVT0 data). The A-SciSoft modules that perform the extraction of the calibration coefficients and their application to the raw events are astricalext and astrical, respectively. • Reconstruction (DL1a → DL2b):
– Telescope-wise reconstruction (DL1a → DL1c):
The calibrated data (EVT1a/MC1a) of each telescope undergo an image cleaning procedure aimed at removing pixels which most likely do not belong to a given Cherenkov shower image. The
default cleaning method implemented in A-SciSoft is a two-threshold two-pass cleaning.28 By
default, the upper cleaning threshold is set to be 3 times the mean value of the pixels’ pedestals, while the lower threshold is set to be half of the upper one. After this step, a parameterization of each resulting cleaned image is performed. The extracted parameters are mainly based on
the statistical moments, up to the third order, of the light distribution on the camera,44 and
§
The arrival time information is not yet available in the output data of the ASTRI prototype camera. However, we foresee that this information will be provided by the ASTRI cameras proposed to be deployed at the CTA southern site.
on arrival time information (if available). In this step, the telescope pointing and source posi-tion are extracted from the technical data and associated to each image. The A-SciSoft module in charge of performing the image cleaning and parameterization is astricleanpar. Once the events recorded by each telescope are cleaned and parametrized, a set of simulated gamma-ray (MC1b) data and a set of real or MC background (EVT1b or MC1b) data are used to train a machine learning algorithm for the calculation of suitable single-telescope (ST) look-up-tables (LUT1) for gamma/hadron separation, energy reconstruction, and arrival direction estimation. The default machine learning technique implemented in A-SciSoft is based on Breiman’s Random
Forest method,45 although implementation and testing of alternative methods, such as neural
networks, are ongoing. The module that performs the LUT1 calculation is called astrilutsST.
Once available, the LUT1 are applied to EVT1b/MC1b data to get the fully telescope-wise
recon-structed data (EVT1c/MC1c), by means of the astrirecoSTmodule. At this level of the analysis,
telescope-wise parameters for the gamma/hadron separation, energy reconstruction, and arrival direction estimation are available for each fully reconstructed image.
– Array-wise reconstruction (DL1c → DL2b):
The telescope-wise fully reconstructed data (EVT1c/MC1c) of each telescope are merged and a set of basic array-wise image parameters per event (such as the geometrical estimation of the shower direction, maximum height, and impact parameters relative to each telescope) are calculated by means of the astrimer module. Once available, a set of simulated gamma-ray (MC2a) data and a set of real or MC background (EVT2a or MC2a) data are used to compute array-wise (A) look-up-tables (LUT2) for gamma/hadron separation, energy reconstruction, and arrival direction
estimation (with the astrilutsA module). In this step, telescope-wise and array-wise pieces of
information are used together to train the machine learning method. Finally, the LUT2 are applied to EVT2a/MC2a data to get the fully array-wise reconstructed data (EVT2b/MC2b), by
means of the astrirecoA module. At this level of the analysis, array-wise parameters for the
gamma/hadron separation, energy reconstruction, and arrival direction estimation are available for each fully reconstructed event. In particular, the gamma/hadron separation is a crucial issue
for any IACTs analysis due to the overwhelming hadronic background. The gamma/hadron
discrimination parameter (called Gammaness) ranges from 1 (for showers confidently identified as initiated by gamma rays) to 0 (for those clearly showing the features of a hadronic cosmic-ray initiated shower).
• Analysis (DL2b → DL3):
The fully reconstructed array-wise data (EVT2b/MC2b) are further processed by the astriirf and astriana modules to achieve the fully reduced data (EVT3/IRF3). The former module is aimed at computing the global instrumental response functions (IRF2), which include the effective collection area, energy and angular resolution, and residual background rate (as a function mainly of energy, zenith and azimuth pointing, and gamma-ray source position). The latter module is then in charge of providing the final event-list (EVT3), extracted from the corresponding EVT2b, along with the corresponding reduced IRF3 (from the corresponding IRF2). In this last analysis step, both quality and gamma/hadron separation cuts are applied to get the final DL3 data.
• Science (DL3 → DL4):
The fully reduced data (EVT3/IRF3) are finally analyzed with either science tools currently being
used in the CTA Consortium (e.g. ctools33and Gammapy34) or with specifically developed ones (ASTRI
Science Tools). The final scientific products (DL4), such as detection plots, spectra, sky-maps, and light-curves, are thus generated. These products, if needed, can be further processed and merged to get high-level observatory data (DL5), which include legacy observatory data, such as survey sky-maps and/or source catalogs.
3. ASTRI MONTE CARLO SIMULATIONS
Simulations are an essential component for any IACT project, from its design phase to the end of its operational life cycle. The design optimization relies heavily on simulated data in order to assess the performance of different
hardware solutions and telescopes’ layouts. Furthermore, during the commissioning phase, an iterative compar-ison between acquired and simulated data leads to the validation of the simulation chain and, at the same time, to the optimization of the operational parameters that affect the telescopes’ performance. Finally, simulations are also mandatory during the entire operational phase in order to train the background rejection strategies and to estimate the IRFs. The ASTRI project is adopting this approach and large samples of simulated data
have been already produced specifically for ASTRI purposes¶ with the same simulation chain used by the CTA
Consortium.46 These dedicated MC productions were originally conceived to develop and test the A-SciSoft
software package and to estimate the performance of the ASTRI prototype and mini-array. In a second phase, when the prototype will gradually reach the nominal data taking (providing stable and coherent data), dedicated MC simulations will be produced to validate the entire simulation chain by means of the detailed comparison with real data taken with the prototype. This process will eventually be essential in accomplishing the scientific
verification phase of the ASTRI prototype31 by means of the proper data reduction of observations of
well-known gamma-ray emitters (Crab Nebula, Mrk 421, and Mrk 501). In particular, the Crab Nebula represents the standard candle for VHE gamma-ray astronomy.
For easiness of comparison and consistency, the simulations within the ASTRI project are achieved with
the same simulation chaink adopted by the CTA Consortium.46 Atmospheric showers are simulated using the
CORSIKA code48(version 6.99) while telescopes’ responses are simulated with the sim telarray package,49which
propagates photons hitting the primary mirror through the telescopes optical system to the camera and simulates the photon detection, the electronic response, and the trigger logic. The proper simulation of the main hardware
components of the ASTRI telescopes (optical system,22camera,23electronics24) has been carefully implemented
in the sim telarray package. The sim telarray outputs are finally converted into the official ASTRI DL0 FITS data
format25,28by a specific converter tool included in the A-SciSoft software package. The simulation productions
require rather large computing needs (even in the case of single-telescope simulations) which are achieved by
means of distributed computing resources such as the GRID technology, utilizing the DIRAC framework50 as
interware. For CTA MC activities, simulations are typically carried out on a dedicated CTA computing grid and managed by a permanent appointed team.
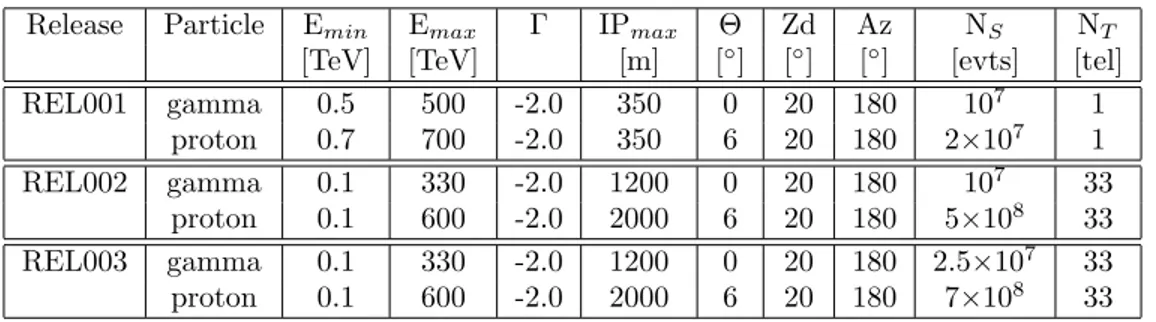
So far, three main ASTRI MC releases (hereafter, ASTRI REL00n, with n=1,2,3) have been generated: • ASTRI REL001: this release was generated considering a single ASTRI telescope and provided the first
MC data to test the main A-SciSoft components for the single-telescope data reduction (see Section4.1).
• ASTRI REL002: this release was generated considering a square array of 33 ASTRI telescopes∗∗(with the
same ASTRI hardware configurations adopted in the so-called CTA Production 212) and mainly used to
test the full stereoscopic reconstruction of the simulated events (see Section4.1).
• ASTRI REL003: this release was generated considering again 33 ASTRI telescopes (with same ASTRI
hardware configurations adopted in the so-called CTA Production 3b13) and mainly used to build the
so-called first ASTRI prototype data challenge (see Section4.2).
In Tab.1 the main configuration quantities adopted for the simulation of the particle showers of the three
main ASTRI MC releases produced so far are summarized. For each release, all the main hardware characteristics of the ASTRI telescopes were simulated according to the most updated measurements (e.g., mirrors’ reflectivity, electronic gains, ...) provided by the ASTRI hardware team. Along with the simulation of the particle showers, suitable raw calibration data (MC-CAL0) for each ASTRI release have been generated as well.
¶
The main configuration inputs (see Table 1) for the generation of MC data samples can be tailored once specific hardware and telescope/array layouts are considered. For this reason, ad hoc MC simulations have been generated specifically for ASTRI.
k
The CTA simulation chain is aimed at generating the DL0 inputs that are then processed by the MC data reduction pipelines in use in the CTA Consortium.12,13,47
∗∗
An array composed of four concentric square rings of ASTRI telescopes plus one more telescope at the center of the squares (33 telescopes overall) was simulated with inter-telescope distance ranging from 200 m to 350 m. Such arrangement was considered in order to allow the study of the performance of different telescope array layouts.
Table 1. Values of the main configuration quantities adopted for the production of the ASTRI MC releases. For each primary particle species: Eminand Emaxare the minimum and maximum simulated energy, Γ is the energy spectral slope
used for the simulation of the particles, IPmax is the maximum considered impact parameter, Θ is the cone aperture of
arrival directions of the simulated showers, Zd is the zenith observational angle, Az is the azimuth observational angle, NS is the number of simulated showers between Emin and Emax, and NT is the number of simulated ASTRI SST-2M
telescopes.
Release Particle Emin Emax Γ IPmax Θ Zd Az NS NT
[TeV] [TeV] [m] [◦] [◦] [◦] [evts] [tel]
REL001 gamma 0.5 500 -2.0 350 0 20 180 107 1 proton 0.7 700 -2.0 350 6 20 180 2×10⁷ 1 REL002 gamma 0.1 330 -2.0 1200 0 20 180 107 33 proton 0.1 600 -2.0 2000 6 20 180 5×10⁸ 33 REL003 gamma 0.1 330 -2.0 1200 0 20 180 2.5×10⁷ 33 proton 0.1 600 -2.0 2000 6 20 180 7×10⁸ 33
4. ASTRI DATA REDUCTION DEVELOPMENT STATUS AND VALIDATION
TESTS
At present, all main A-SciSoft components and modules have been implemented and successfully tested on a
MC basis (by means of data of the ASTRI release introduced in Section3), for both ASTRI single-telescope and
array data reduction chains. An important step toward the technical validation of the complete data reduction of the ASTRI SST-2M prototype has been accomplished on a realistic data basis by means of the so-called ”first
ASTRI data challenge”. In Sections4.1 and 4.2 we summarize some of these validation tests and discuss the
main outcomes. In addition to the activities carried out on conventional CPUs, it is worth mentioning that also first tests (on a MC basis) of the low-power consumption ASTRI SST-2M single-telescope data processing with
A-SciSoft have provided satisfying feedback on NVIDIA R Jetson TK1 and TX1 development boards. For more
details about the low-power consumption data processing implementation, tests, and results we refer the readers
to previous pubblications.27,36
As for the data reduction on a real data basis, some preliminary tests are being carried out with the first data acquired by the ASTRI SST-2M prototype since the beginning of its verification and performance validation
phase in 2017.20 All collected DL0 data (EVT0, CAL0, SCI-TECH0, see Section 2) have been so far properly
handled by the ASTRI archive system,39 which stores/sends the data in the on-site/off-site archive. Until now,
the different types of DL0 data have been acquired separately and with contents still under commissioning. This, along with the lack of validated MC simulations, has, until now, not permitted a full validation of the complete end-to-end data reduction. Nevertheless, a basic technical validation of the software by means of data reduction tests carried out on individual DL0 data types (and using, when needed, preliminary MC data sets) has been achieved. In fact, the A-SciSoft software package has so far proven to be virtually ready in all its core components for the ASTRI SST-2M prototype real data reduction, although some adjustments and further developments of the software (besides the validation of the entire MC simulation chain) will be likely needed
during the upcoming scientific verification phase. In Section4.3we present an overview of the data taking runs
carried out until January 2018 and discuss the data reduction tests that have been performed.
4.1 Validation tests on a MC basis
As mentioned in Section 3, the ASTRI MC releases have been specifically produced with the main aim of
developing and testing the A-SciSoft software package and estimating the performance of the ASTRI SST-2M prototype and ASTRI mini-array. While the ASTRI REL001 has been exploited for the single-telescope case, the REL002 has been used for the mini-array case (considering a square layout of 9 telescopes with a relative
For both analyses, the MC0 event data (produced by the simulation chain introduced in Section3) have been
reduced up to DL3 with the A-SciSoft executable modules (summarized in Section2), applying efficiency-based
gamma/hadron discrimination parameter cuts††optimized in each considered energy bin. The smooth processing
of the data has provided a first technical validation of the main software components implemented in A-SciSoft for the MC data reduction chain. Then, in order to derive the differential sensitivity curves, the reduced MC proton and gamma-ray events have been reweighed in order to match the experimental fluxes respectively of
the proton background, as measured by the BESS Collaboration,52and of the Crab Nebula, as measured by the
HEGRA Collaboration.53 This reweighing procedure is commonly adopted in the CTA framework12,13,47 and
allows us to derive the differential sensitivity curves under the same assumptions. In particular, the sensitivity is computed by considering 50 hours of observation time and requiring five standard deviations (5σ, with σ defined
as in Equation 17 of54) for a detection at each energy bin. In addition, signal excess is required to be larger
than 10 and at least five times the expected systematic uncertainty in the background estimation (1%). Finally, a ratio of the off-source to on-source exposure equal to 5 is considered. This is because several off-source regions can typically be extracted from the same observed field containing the on-source region.
In Figure2, the differential sensitivity curves (green points) achieved from the analysis of the ASTRI REL001
(single-telescope, left plot) and ASTRI REL002 (mini-array, right plot) are shown. The single-telescope
sensitiv-ity is well in line with preliminary analytic expectations.55 In the case of the mini-array, the results are compared
with those obtained with the MC data reduction pipelines12,13,47 used in the CTA Consortium, considering the
same ASTRI mini-array layout and MC production (red points). The two extra sensitivity points (at the lowest energy bins) and the different results (below a few TeV) achieved with the ASTRI data reduction are likely
due to the application of different algorithms and/or (low energy) analysis cuts with respect to the analysis51
performed with the MC data reduction pipelines currently being used in CTA. These differences are presently under investigation. Either way, the better overall behavior below a few TeV and the good agreement between the two analyses above those energies represent an important validation of the entire MC data reduction pipeline performed with the A-SciSoft software package.
log10(E/TeV) -0.5 0 0.5 1 1.5 [C.U.] -1 10 1 MC analysis) A-SciSoft ASTRI SST-2M prototype ( (E/TeV) 10 log -0.5 0 0.5 1 1.5 2 ] -1 s -2 dF/dE [erg cm 2 E -13 10 -12 10 -11 10
ASTRI mini-array (CTA MC analysis) MC analysis)
A-SciSoft
ASTRI mini-array ( CTA-South
Figure 2. Left: ASTRI SST-2M prototype differential sensitivity curve (5σ, 50 hours), in units of the Crab Nebula flux [C.U.], achieved with the A-SciSoft MC analysis (green points). The result is well in line with preliminary analytic expectations.55 Right: ASTRI mini-array (9 telescopes, relative distance ∼250 m, square layout) differential sensitivity curves (5σ, 50 hours) achieved with the A-SciSoft MC analysis (green points) and with the CTA MC analysis.51 The differential sensitivities of CTA-South11is also shown (blue line).
††
The efficiency-based gamma/hadron discrimination parameter cuts are calculated by means of dedicated MC gamma-ray samples and selected in such a way to guarantee that, in a certain energy range, a given percentage (e.g. 80%) of gamma-ray events are retained.
4.2 Validation tests on a realistic basis
The whole end-to-end single-telescope data reduction chain has been tested on a realistic basis by means of the so-called ”first ASTRI data challenge” (hereafter A-DC1). Here, the term ”realistic” means that, despite the fact that the actual contents of A-DC1 data have been entirely derived from MC simulations, the data sample generated at DL0 were built in such a way to get a complete set of data (i.e. all different DL0 types) in a real data format and with enough statistics. Hence, the data could be considered very close to that generated by an actual observation (of few hours) by a single ASTRI telescope. Indeed, the main purpose of this data challenge was to achieve a technical validation of the software under conditions as similar as possible (i.e. realistic) to those expected in the upcoming scientific validation phase of the ASTRI prototype.
All scientific events used to form the EVT0 of the A-DC1 were extracted from the ASTRI REL003 production
already introduced in Section3. To maximize the events’ statistics, all raw triggered MC proton events (which
constitute by far the major part of the scientific data events) coming from the overall 33 ASTRI simulated
telescopes were stacked together‡‡(as they would have seen by a single ”averaged” ASTRI telescope). The events
were then randomly filtered at the raw data level so to follow the experimental energy slope of -2.70, as measured
by the BESS Collaboration.52 After this filtering procedure, the available statistics resulted in ∼4.2×10⁶triggered
events, with a rate of ∼100 Hz (assuming the actual proton flux rate). This amount of events corresponded to ∼11.6 hours of (single telescope) data taking, which was then split equally in two sub-samples, dubbed ”ON” and ”OFF”, respectively. The ON sample was enriched with an amount of raw MC gamma-ray events randomly selected from the ASTRI REL003 production so to get one unit of Crab Nebula flux, as measured by the HEGRA
Collaboration.53 Part of the OFF sample statistics was instead kept in its original MC data format in order to
get the necessary amount of independent proton events to produce the LUT1 needed for the ON and OFF data
reduction (see Section2). The final ON and OFF data samples resulted in ∼5.8 and ∼5.5 hours, respectively.
In order to associate a realistic time stamp and local arrival direction to each event, the ON and OFF data samples were assigned celestial coordinates assuming observations at the ASTRI SST-2M prototype site at Mt.
Etna, Sicily, tracking the Crab Nebula (RA (J2000) = 5h34m31.94s and Dec (J2000) = +22◦00’52.2”) and a
close empty-sky region (RA (J2000) = 5h50m36s and Dec (J2000) = +22◦33’51”). Both ON and OFF data were
formatted at raw-data level in compliance with the ASTRI SST-2M prototype FITS format.25,28 In particular,
the data samples were divided in runs of ∼500 MB, each one containing ∼5.5×10⁴events, as foreseen in a real
data taking condition. In the end, the ON and OFF data samples resulted in 39 (∼5.8 hours) and 37 runs (∼5.5 hours) of data taking, respectively. Along with the scientific ON and OFF raw data, all other run-based
DL0 inputs (see Section2) were generated under realistic assumptions and using the actual real data formats.
A suitable set of DL0 calibration data (CAL0) was also created in order to extract the calibration coefficients to be applied to the raw ON and OFF data samples inputs in order to calibrate the events. Finally, to produce the global IRFs a suitable MC gamma-ray sample from the ASTRI REL003 was also considered. The background rate included in the global IRFs was extracted directly from the reduced OFF data sample. This background estimate was crosschecked with the one extracted from the corresponding proton events statistics in its original MC format.
All input data samples were successfully reduced from DL0 up to the generation of scientific products with
the A-SciSoft software package. From DL0 to DL3, an efficient pipeline, wrapping the modules needed to
perform the entire single telescope data reduction (see Section 2), was used. Then, the DL3 data (reduced
event-lists and associated IRFs) were analyzed by means of the ASTRI Science Tools (to generate detection
plots and sensitivity estimates) and of the ctools33 to produce the sky map, spectrum, and light curve of the
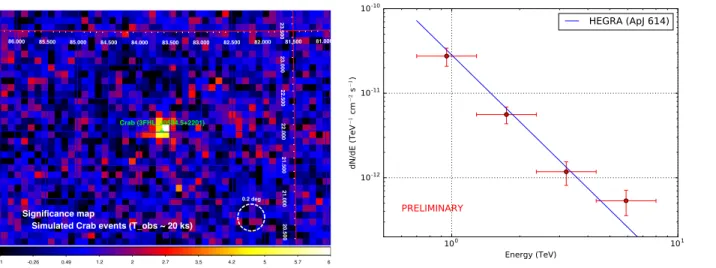
(Crab Nebula) observation. The left and right panels of Figure3 show the significance sky map (obtained by
means of the ctskymap ctools task) and the Crab Nebula differential spectrum (using the csspec ctools task), respectively. Both results were achieved from the ON event-list and associated IRFs, applying 80% efficiency-based gamma/hadron discrimination parameter cuts. All achieved results were found to be basically in line with
‡‡
This stacking procedure likely introduced some sort of systematics in the final results because of the general inter-dependence between images triggered by different telescopes (but coming from the same simulated atmospheric shower). However, for the purpose of testing the technical operation of the whole ASTRI end-to-end single-telescope data reduction, this can be considered as a second-order effect.
expectations†. The reasonable outcome of this data challenge constitutes the first end-to-end technical validation of the whole ASTRI single-telescope data reduction and scientific analysis chain under realistic conditions.
1 -0.26 0.49 1.2 2 2.7 3.5 4.2 5 5.7 6. 81.000 81.500 82.000 82.500 83.000 83.500 84.000 84.500 85.000 85.500 86.000 20.500 21.000 21.500 22.000 22.500 23.000 23.500
Simulated Crab events (T_obs ~ 20 ks) Significance map Crab (3FHL_J0534.5+2201) 0.2 deg 100 101 Energy (TeV) 10-12 10-11 10-10 dN /d E (T eV − 1 cm − 2 s − 1) PRELIMINARY HEGRA (ApJ 614)
Figure 3. Left: significance map of the ON data (∼5.8 hours) sky region obtained with the ctskymap ctools task. The white dotted circle in the lower right indicates the point-spread function (68% containment) of the analysis. Right: differential Crab Nebula spectrum between 0.7 TeV and 8 TeV obtained from the analysis of the ON data (∼5.8 hours), along with associated IRFs, obtained with the csspec ctools task. The blue line represents the Crab Nebula power-law best fit measured by the HEGRA Collaboration.53
4.3 Reduction of real data taken by the ASTRI SST-2M prototype
The ASTRI SST-2M prototype commissioning phase began in 2017.20 Since then, a flow of real data (gradually
improving in terms of reliability and completeness) has been acquired and handled by the archive system,39
which has stored/sent the data in the on-site/off-site archive. These data, although still taken in commissioning
conditions, are among the first real data ever taken with any of the CTA prototypes under development.6–9
So far, the real data acquired by the prototype has been processed only off-site and not in automatic mode.
The automatic on- and off-site data reduction28is planned to start as soon as the prototype commissioning phase
is accomplished. Nonetheless, the A-SciSoft software package has thus far proven to be capable of handling and processing the real data during the commissioning phase, providing the first valuable feedback to the hardware team. In what follows we present a selection of the main data reduction tests performed upon the data collected so far at the prototype site and discuss the results. All data considered in this work were taken in dark (i.e. moonless) conditions.
May 2017 data taking run:
The first cosmic showers were seen by the ASTRI prototype camera. Only 7 (out of 21) camera Photon
Detector Modules23 (PDMs) were connected. The acquisition rate was limited for technical reasons to
∼1 Hz. A few images were acquired, stored on the camera server,25 and copied to the on-site archive.39
The A-SciSoft software was able to read the data and to visualize the raw images of cosmic showers by the visualization tools implemented in the package.
July 2017 data taking run:
The first data runs in scientific mode (EVT0) were taken at fixed pointing directions and stored in the on-site archive. A total of 14 (out of 21) camera PDMs were connected and the acquisition rate was still limited to ∼1 Hz. The data were properly processed up to the full single-telescope reconstruction
†
of the events (EVT1c) by means of the A-SciSoft modules, although with preliminary and not validated
calibration auxiliary inputs (see Section 2). This achievement represents the first ever operational test of
the ASTRI single-telescope pipeline.
The CAL1 coefficients used for the calibration of the events were extracted from a CAL0 data sample taken in laboratory for the full set of 21 PDMs (1344 camera pixels), while the applied single-telescopes
LUTs were taken from the A-DC1 (which were far to be optimal for this use case). In Figure 4 (left
plots), the distributions of the main calibration coefficients42 – pedestals of the high gain (HG) channel
(PEDHG [ADC-counts]); pedestals of the low gain (LG) channel (PEDLG [ADC-counts]); gain of the HG
channel (PEQHG [ADC-counts/pe]) – extracted with the module astricalext are shown‡. The mean of
each distribution (from a gaussian fit) are also reported (values written in black) and compared to the results provided by the hardware team with independent routines (in green). The good agreement between the two estimates represents a first valuable validation of the A-SciSoft calibration coefficient extraction components on a real data basis (even though still under laboratory conditions). In the right plot of
figure 4, an example of a fully reconstructed single-telescope image is shown. The values of some basic
image parameters44Size, Width, Length, and Alpha§ are also superimposed along with those of the event
reconstruction parameters Gammaness, Energy, and Direction¶ (see Section2).
2060 2080 2100 2120 2140 2160 2180 2200 2220 2240 0 5 10 15 20 25 30 35 40 45 MAX1HG 20 22 24 26 28 30 32 34 36 38 40 0 100 200 300 400 500 600 PEQfp 2060 2080 2100 2120 2140 2160 2180 2200 0 10 20 30 40 50 MAXLGfp
HG channel Pedestals (1344 pixels)
LG channel Pedestals (1344 pixels)
HG channel Gains (1344 pixels)
Counts Counts Counts ADC-counts ADC-counts ADC-counts/pe <PEDHG> = 2150.8 ± 17.4 [ADC-counts]
<PEDHG>LAB = 2147.8 ± 32.2 [ADC-counts]
<PEDLG> = 2133.8 ± 14.3 [ADC-counts]
<PEDLG>LAB = 2132.3 ± 23.8 [ADC-counts]
<PEQHG> = 28.61 ± 0.88 [ADC-counts/pe]
<PEQHG>LAB = 28.57 ± 0.81 [ADC-counts/pe]
size = 25265.9961 [pe] centroid = (-0.4258, 2.9528) [deg] width = 0.7539 [deg] length = 1.2133 [deg] alpha = 65.6652 [deg] gammaness = 0.01 energy = 51.9642 [TeV] direction = (0.1753, 3.3363) [deg]
Figure 4. Left: distributions of the main calibration coefficients (pedestals of the HG and LG channels, gains of the HG channels) extracted with A-SciSoft from real CAL0 data taken in laboratory. The mean of the distributions (from a gaussian fit, written in black) are compared to the results provided by the hardware team with independent routines (in green). Right: example of a fully reconstructed single-telescope event. The values of some basic image parameters44(Size, Width, Length, and Alpha) and event reconstruction ones (Gammaness, Energy, and Direction) are also superimposed.
‡
For any data reduction of real data taken so far, the gain of the LG channel (PEQLG [ADC-counts/pe]) has been always set by default to 1.45 for all pixels.23 Data acquisition of dedicated CAL0 data for the extraction of more precise LG channel gain coefficients are ongoing.
§
Size, Width, Length, and Alpha are respectively the total content (in [pe]) of the cleaned image, the width and length of the cleaned image, and the angle between the major axis of the cleaned image and the direction joining the center of the image and the nominal source position (in this case, the center of the camera).
¶
Gammaness, Energy, and Direction are the parameters for the gamma/hadron discrimination, energy reconstruction, and arrival direction estimation, respectively (see Section2). In this specific analysis, those parameters (written in gray in Figure4, right plot) are likely affected by huge biases due to the application of both preliminary calibration coefficients and not optimal LUTs.
October 2017 data taking run:
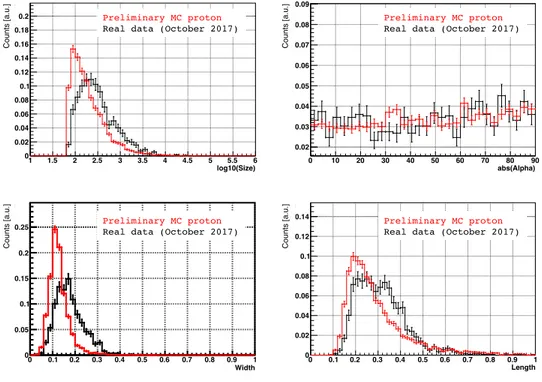
The first scientific data tracking astronomical targets (mainly, the Crab Nebula) were collected, despite the fact that the acquisition rate was still at ∼1 Hz. Only 2 (out of 21) camera PDMs were unconnected. Since no suitable CAL0 data were available, the same coefficients used in July 2017 were applied for the calibration of the raw scientific events. Even though any concrete chance of detecting any astronomical targets was prevented by the limited acquisition rate, the data provided for the first time enough statistics to perform a first rough comparison between the distributions of some basic image parameters of real cosmic (proton) shower events and those extracted from ASTRI single-telescope MC simulations (A-DC1, in the present case). To achieve that, the very same data reduction chain was applied to the real and simulated events, from the raw level up to the image parameters calculation. In particular, the 2 PDMs
unconnected during real data taken were disconnected also for the MC data analysis. In Figure 5, the
normalized distributions for the image parameters log10(Size), Width, Length, and |Alpha| are shown in
black for the real events and in red for the MC simulations. Although rather large mismatches were found (as expected) between the real and simulated distributions, this comparison represents a first significant step forward the validation of the whole MC simulation chain.
log10(Size) 1 1.5 2 2.5 3 3.5 4 4.5 5 5.5 6 counts 0 0.02 0.04 0.06 0.08 0.1 0.12 0.14 0.16 0.18 0.2 Width 0 0.1 0.2 0.3 0.4 0.5 0.6 0.7 0.8 0.9 1 counts 0 0.05 0.1 0.15 0.2 0.25 Length 0 0.1 0.2 0.3 0.4 0.5 0.6 0.7 0.8 0.9 1 counts 0 0.02 0.04 0.06 0.08 0.1 0.12 0.14 abs(Alpha) 0 10 20 30 40 50 60 70 80 90 counts 0.02 0.03 0.04 0.05 0.06 0.07 0.08 0.09 Preliminary MC proton
Real data (October 2017)
Preliminary MC proton
Real data (October 2017)
Preliminary MC proton
Real data (October 2017)
Preliminary MC proton
Real data (October 2017)
C o u n ts [a.u .] C o u n ts [a.u .] C o u n ts [a.u .] C o u n ts [a.u .]
Figure 5. Normalized distributions of the main image parameters log10(Size), Width, Length, and |Alpha| for the real
proton shower events and the simulated ones (after the application of the same data reduction up to the image parameters calculation).
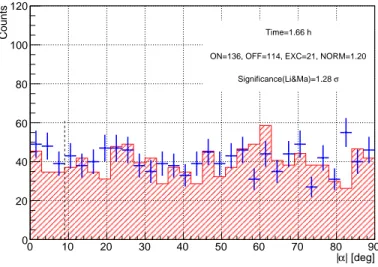
December 2017 data taking run:
Scientific data on Crab Nebula and on a corresponding empty regions (off-source data, for background
evaluation) were taken for the first time in nominal configuration, although with a trigger logic23still under
tuning and with 2 (out of 21) unconnected camera PDMs. Also, for technical reasons (still under careful investigation by the camera team), only the LG channel could be used for the data analysis. Nevertheless, ∼1.7 hours of Crab Nebula and ∼1.4 hours of off-target exploitable data were collected on overall. The data were smoothly reduced with A-SciSoft, using the same calibration coefficients employed for the reduction of data acquired in the previous data taking runs (considering this time only the LG channel for all pixels
in the entire ADC-counts signal range). The MC simulation events used to calculate the LUTs were extracted at raw data level from A-DC1 and reduced applying the same chain as the real data. They were then adjusted, at image-parameter level, in order to achieve a better match with the distributions of the main image parameters of the real events. While far from optimal, this procedure provided the possibility to compute LUTs that could better reconstruct both the real events from the Crab Nebula as well as
off-source observationsk. After the full reconstruction of the events, a set of analysis quality cuts∗∗was applied
to the Crab Nebula and off-source data. Finally, an 80% efficiency-based gamma/hadron discrimination parameter cut was applied to the data (in the entire energy range) in order to search for excess from the
source by means of the so-called detection |Alpha|-plot††, as shown in Figure 6. No hint of signal from
the Crab Nebula data (blue histogram) over the off-source data (red histogram) was found in a fiducial
|Alpha| signal region of 9◦ (estimated from the A-DC1 analysis). This result was mostly due to the rough
calibrations used for the data reduction, to the limited amount of on-source exposure time (compared to the expected sensitivity of the system), and to the sub-optimal condition of the hardware (still under commissioning) during the data taking. Nevertheless, this constitutes the first concrete attempt with the ASTRI SST-2M prototype to get a positive detection of a known gamma-ray emitter from actual real data.
| [deg] α | 0 10 20 30 40 50 60 70 80 90 Counts 0 20 40 60 80 100 120 Time=1.66 h
ON=136, OFF=114, EXC=21, NORM=1.20 σ Significance(Li&Ma)=1.28
Figure 6. |Alpha| distributions of the Crab Nebula signal (in blue) and background (in red) estimation from ∼1.7 hours of ASTRI SST-2M prototype observations taken in December 2017, after an 80% efficiency-based gamma/hadron dis-crimination parameter cut (in the entire energy range). The region between zero and the vertical dashed line (at 9◦) represents the fiducial signal region. See text for further details.
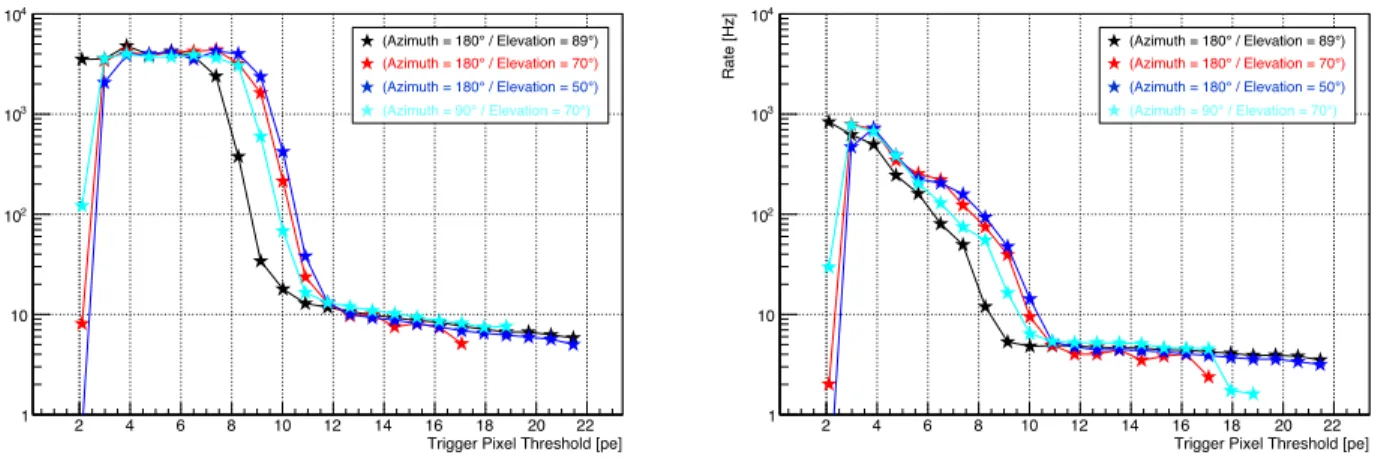
January 2018 data taking run:
This data taking run was mainly employed to perform the so-called ”trigger pixel thresholds (TPTs) scans”, i.e. a set of measurements taken with different individual pixel thresholds (in [pe]) entering the trigger
k
The procedure to adjust the main image parameters of the MC simulation events was tested on an independent MC gamma-ray sample. All things considered, the distributions of the reconstruction parameter Gammaness achieved with this procedure were found to be in line with expectations.
∗∗
The analysis quality cuts are typically applied in the single-telescope data reduction just before the final gamma/hadron separation cuts optimization. The most significant quality cut is Size>100 pe.
††
The distribution of the absolute value of the parameter Alpha is typically considered in the single-telescope data analysis in order to search for excess from a given source, after the application of a suitable cut in the gamma/hadron discrimination parameter (Gammaness). In fact, the |Alpha| distribution of the gamma-ray excess events should peak towards small values, since they are expected to have an orientation pointing towards the position of the nominal gamma-ray source. Instead, the background events, being isotropic, have a rather flat |Alpha| distribution.
decision logic.23 The aim was to determine suitable trigger settings to be used for subsequent scientific observations, by studying the evolution of the data taking rates as a function of the TPTs values.
Data runs performed in scientific mode (each of ∼104 triggered events) were taken with different values of
the TPTs (ranging between ∼2 pe and ∼22 pe, with a step of ∼1 pe, for all camera pixels), considering the LG channel at the trigger level. The measurements were performed during dark time and under stable weather conditions, whenever possible. To scan different levels of the night sky background (NSB), 4 fixed
Azimuth (Az) and Elevation (El) pointing directions were considered: (Az=180◦; El=89◦), (Az=180◦;
El=70◦), (Az=180◦; El=50◦), and (Az=90◦; El=70◦). Generally speaking, at the ASTRI prototype site,
the NSB is expected to diminish as the elevation increases, while the Azimuth pointing directions towards
the South (Az=180◦) are expected to have a larger NSB contribution with respect e.g pointing directions
towards North (Az=90◦), because of the presence of the city of Catania (which is just south of the
obser-vatory).
All 21 camera PDMs were connected and only the LG channel was used for the data reduction, as in the December 2017 data taking run. For the first time, dedicated CAL0 data were acquired and properly reduced to derive the calibration coefficients (mainly the LG channel pedestals of the pixels) needed to calibrate the TPTs scans data. After the calibration, image cleaning, and parameterization of the events, a set of analysis quality cuts (similar to those applied to the Crab Nebula data collected in December 2017) were finally applied to the data.
In Figure7(left plot), the rates achieved at trigger level as a function of the TPTs values for the 4 different
pointing positions are shown. The data taking rates decrease with increasing TPTs. A suitable trigger pixel thresholds configuration (or ”working point”) can be defined for each curve at that TPTs value where the maximum gradient of the data taking rate takes place. In fact, at the working point (and above) the rates cease to be dominated by spurious triggered events due to NSB (and/or instrumental noise). The working point is expected to be different for different pointing directions, as it depends on the level of NSB in the field of view (FoV). This behavior was indeed found in the collected TPTs scans data. The lower working point value (∼10 pe) was in fact achieved close to the Zenith (black points), while higher values were obtained for the other considered pointing directions, where the highest one (∼12 pe) was found
towards the South at a middle elevation (blue points), as expected. In Figure 7 (right plot), the rates
achieved from the different scans after the data reduction are also depicted. Rather similar conclusions for the working points estimates can be derived. However, it must be noted that the application of the image cleaning and analysis quality cuts did not drastically reduce the rates related to the lowest TPTs values, as one would have expected. This means that part of the noisy events under the working point thresholds are likely due to rather high signals from clusters of adjacent pixels (otherwise, they would not have survived the cleaning procedure, nor the Size>100 pe quality cuts). This issue is currently being investigated by the camera hardware team.
In addition to the trigger working points evaluation, the TPTs scans provided a clear picture of the trigger rates of the system in current nominal conditions for the first time. As shown, the rates at the working points were found to be rather low (∼10 Hz) with respect to expectations from MC simulations (&100 Hz). This behavior is likely due to some deterioration of the optical reflectivity of the primary and secondary mirrors, to be added to some current technical issues of the camera (and a possible rather high inaccuracy of the current available MC). In this respect, it should be noted that the ASTRI telescope prototype is located on the slopes of Mt. Etna whose volcanic dust contributes to the deterioration of the mirrors. A refurbishment of the optics of the prototype (re-coating of the reflective surfaces of the primary mirrors and replacement of the secondary mirror) is indeed foreseen for mid 2018.
In January 2018, other interesting tests were performed for the pointing behavior of the system and the
source position reconstruction. As mentioned in Section2, the temporal evolution of the NSB level is
eval-uated by means of specific interleaved CAL0 data (taken simultaneously with the EVT0 data, in nominal
conditions). These data are commonly dubbed ”VAR0” within the ASTRI community‡‡ and can be used
to spot pixels illuminated by the light of bright stars in the FoV.
‡‡
”VAR” stands for ”variance”, while ”0” indicates the data level. The name originates from the procedure (the ”variance technique”23) used to extract the NSB pixels contents during scientific observations performed with the ASTRI camera.
Trigger Pixel Threshold [pe] 2 4 6 8 10 12 14 16 18 20 22 Trigger Rate [Hz] 1 10 2 10 3 10 4 10 (Azimuth = 180° / Elevation = 89°) (Azimuth = 180° / Elevation = 70°) (Azimuth = 180° / Elevation = 50°) (Azimuth = 90° / Elevation = 70°)
Trigger Pixel Threshold [pe]
2 4 6 8 10 12 14 16 18 20 22 Rate [Hz] 1 10 2 10 3 10 4 10 (Azimuth = 180° / Elevation = 89°) (Azimuth = 180° / Elevation = 70°) (Azimuth = 180° / Elevation = 50°) (Azimuth = 90° / Elevation = 70°)
Figure 7. Left: trigger rates as a function of the TPTs values for 4 different pointing positions. See text for further details. Right: rates after data reduction (calibration, image cleaning and parameterization, and application of analysis quality cuts) as a function of the TPTs values for 4 different pointing positions. See text for further details.
A set of VAR0 and corresponding SCI-TECH0 data (including pointing information from the mount
sys-tem,56 see Section 2) were taken while tracking the central star of the Orion’s Belt (Alnilam, or Epsilon
Orionis) for ∼20 min. Both types of data were used to test the A-SciSoft routines for the reconstruction of the source position (as a function of the time) and to get some indications about the tracking precision and accuracy of the system (including possible systematic off-sets).
In Figure 8 (left plot), the NSB level of the camera pixels (at a given time) extracted from the VAR0
data is shown. The three bright stars of the Orion’s Belt – Zeta Orionis (magnitude 1.74), Epsilon Orionis (1.70 magnitude), and Delta Orionis (2.25 magnitude) – could be clearly identified in the FoV. A constant
systematic offset of ∼(−0.1◦,+0.3◦) with respect the center of the camera† was found for the position of
the tracked star (Epsilon Orionis). In Figure8(right plot), the reconstructed position of the tracked star
in camera coordinates (in [◦]) for the X (red line) and Y (blue line) directions, achieved with the A-SciSoft
routines, are shown. The systematic off-set was properly taken into account and subtracted. The mean value of both distributions is compatible with 0, indicating a correct and stable tracking of the source. The
maximum fluctuations were of the order of ±0.004◦ and ±0.001◦ for the X and Y coordinate, respectively,
i.e. well within the typical point spread function of the system (∼0.15◦). These results are in line with
independent estimates achieved by the mount system team57 and provide a first technical validation of the
A-SciSoft algorithms for the reconstruction of the source position.
5. SUMMARY AND OUTLOOK
In the framework of the international CTA gamma-ray observatory, the ASTRI project has proposed and designed a dual-mirror implementation as a candidate for the CTA SST class. A prototype, dubbed ASTRI SST-2M, has been installed at the INAF “M.C. Fracastoro” observing station in Serra La Nave (Mt. Etna, Sicily) and it is currently undergoing its verification and performance validation phase. Over the next few years, the project aims at deploying (at least) nine ASTRI telescopes at the CTA southern site in order to contribute to the implementation of the initial part of the array. The ultimate goal is to contribute to the installation of a considerable amount of the foreseen 70 CTA SSTs.
The ASTRI project has, since its beginning, included the development of the full data processing and archiv-ing chain. Therefore, a dedicated software package named A-SciSoft has been developed in compliance with the
†
The very same off-set was also found while tracking Zeta Tauri, the brightest star in the Crab Nebula field of view. This off-set was considered in the Crab Nebula data reduction of December 2017 data (see Figure6).
Variance event number 0 50 100 150 200 250 300 350 400 ] ° [ -0.01 -0.008 -0.006 -0.004 -0.002 0 0.002 0.004 0.006 0.008 0.01
Figure 8. Left: NSB level of the camera pixels (at a given time) extracted from the VAR0 data taken during the tracking of the star Epsilon Orion. The three bright stars of the Orion’s Belt (Zeta Orionis, Epsilon Orionis, and Delta Orionis) are indicated in the figure. Right: reconstructed position of Epsilon Orionis in camera coordinates (in [◦]) for the X (red line) and Y (blue line) directions, as a function of the VAR0 events (proportional to time).
general CTA data management requirements and data model specifications (available at the time of its develop-ment). The software has been designed to perform the whole data reduction of the ASTRI SST-2M prototype and of multiple ASTRI telescopes in array configuration. A-SciSoft is one of the first CTA data reconstruction and analysis software prototypes to be developed and tested on real data with the aim of actively contributing to the ongoing global activities for the official data handling system of the CTA observatory.
In this work we have presented the main features of the A-SciSoft software package (Section2), introduced the
MC production chain and the main dedicated ASTRI MC releases (Section3), and provided a detailed description
of the tests carried out so far for the technical validation of the software (Section4). The software is ready in
all its core components for the end-to-end data reduction. In particular, it has demonstrated it can properly
process MC data in both single-telescope and array configuration (Section4.1). Also, the entire single-telescope
real data reduction chain has been successfully tested by means of a realistic data challenge that included all
DL0 inputs expected in nominal ASTRI prototype data taking (Section 4.2). This achievement is particularly
important in view of the upcoming prototype scientific verification phase. As for the real data processing, the data collected until now by the prototype is not yet able to permit the validation of the full data reduction chain. Nevertheless, significant tests have been performed on commissioning data, providing a preliminary validation of
many software components (Section4.3). At the same time, the software has proven capable of giving valuable
feedback to the hardware team during the ongoing verification and performance validation phase.
In the next months, the possibility to perform more and more validation tests of the ASTRI data reduction software is expected to increase, as the prototype will gradually approach the end of its commissioning phase and start its scientific validation phase. Likewise, A-SciSoft is foreseen to become an essential tool to achieve the final end-to-end scientific validation of the ASTRI SST-2M prototype. The whole process will eventually provide us with a significant expertise of real data management to be shared within the CTA community.
![Figure 2. Left: ASTRI SST-2M prototype differential sensitivity curve (5σ, 50 hours), in units of the Crab Nebula flux [C.U.], achieved with the A-SciSoft MC analysis (green points)](https://thumb-eu.123doks.com/thumbv2/123dokorg/8106790.125090/11.918.120.821.604.863/figure-prototype-differential-sensitivity-nebula-achieved-scisoft-analysis.webp)