ALMA MATER STUDIORUM – UNIVERSITÀ DI BOLOGNA
SCUOLA DI INGEGNERIA E ARCHITETTURA
CORSO DI LAUREA MAGISTRALE IN CIVIL ENGINEERING DIPARTIMENTO DI INGEGNERIA CIVILE, AMBIENTALE E DEI MATERIALI
TESI DI LAUREA in
Advanced Hydrosystems Engineering
TOXICITY EVALUATION OF TiO2 NANOPARTICLES
EMBEDDED IN CONSUMER PRODUCTS
CANDIDATO RELATORE:
Andrea Galletti Chiar.mo Prof. Andrea Bolognesi
CORRELATORE: Prof. Sung Hee Joo
Anno Accademico 2015/2016 Sessione I
3
Keywords
Titanium Dioxide
Personal Care Products
Toxicity
Diatom
5 TABLE OF CONTENTS Chapter Page ABSTRACT 6 1 INTRODUCTION 7 2 LITERATURE REVIEW 11
3 INDUSTRIAL NANO-TiO2 TOXICITY TEST 21
3.1 Technical equipment 22
3.2 Manufacture of Artificial Seawater and f/2 medium 26
3.3 Nanoparticles 29
3.4 Diatom culture 29
3.5 Experimental setup 29
3.6 Results 38
4 PRODUCT-DERIVED NANO-TiO2 TOXICITY TEST 46
4.1 Technical equipment 46
4.2 Manufacture of Artificial Seawater and f/2 medium 48
4.3 Nanoparticles 48
4.4 Diatom culture 49
4.5 Experimental setup 49
4.6 Results 52
5 COMPARISON OF RESULTS AND DISCUSSION 60
6 LITERATURE SURVEY 68
6.1 Environmental parameters 69
6.2 Physical and chemical parameters 73
6.3 Biological parameters 89
7 CONCLUSION AND FUTURE OUTLOOKS 97
REFERENCES 100
6 Abstract
Lo studio è orientato alla determinazione dei rischi tossici posti dalle nanoparticelle di diossido di titanio rilasciate in ambiente marino. L’organismo modello utilizzato per questo studio è la diatomea Thalassiosira pseudonana, la quale è stata scelta per la sua semplicità biologica unita alla fondamentale rilevanza nella catena alimentare e nell’ecosistema marino.
Oltre alle nanoparticelle prodotte industrialmente, questo studio ha lo scopo di determinare e confrontare la tossicità delle nanoparticelle utilizzate in alcuni prodotti di cura personale (in particolare crema solare e dentifricio), estraendole direttamente da essi.
I nostri risultati mostrano una notevole ridondanza nel legame tra la natura (il tipo) delle nanoparticelle e l’inibizione della normale crescita delle diatomee, che supera la correlazione con tutti gli altri parametri monitorati (concentrazione di nanoparticelle, tempo di esposizione, pH, carica superficiale e dimensione delle particelle stesse), sebbene gli altri parametri risultino direttamente legati agli effetti inibitori.
Tali risultati suggeriscono un’intensificazione della ricerca nell’ambito delle nanotecnologie, orientata allo sviluppo di nanomateriali “sostenibili”, ovvero dei quali sono note le potenzialità di impiego, ma anche gli aspetti negativi, che possono di conseguenza essere monitorati con maggiore consapevolezza.
7 Chapter 1 – Introduction
In recent years, metal oxide nanoparticles (MONPs) have experienced a growing trend in their use in a wide range of industrial applications. Among them, titanium dioxide nanoparticles (commonly referred to as nano-TiO2 or TiO2 NPs) are by far
the most used, in industry, agriculture, personal care products (PCPs, including but not limited to, cosmetics, sunscreens, and toothpaste), electronics, food dressing, and food packaging. The main properties TiO2 NPs are their whiteness and opacity,
along with some known antibacterial effects. Different studies have tried to estimate the production rate of nano-TiO2, and how it is distributed among its different fields
of application.
Piccinno et al. (2012)1 surveyed 18 producers of nano-TiO2, assessing the top
usage of TiO2 in the field of PCPs, standing at 68% of the total produced nano-TiO2.
As it can be seen from Figure 1.1, other relevant fields of application for TiO2 NPs
are plastics (6%), paints (14%), and other applications (e.g., cement) (12%). In the same study, the globally produced TiO2 NPs is reported to be on average 3,000 tons
per year, in a range of 101 to 10,000 (5% and 95% confidence limits), based on a 56% response rate (10 producers out of 18).
Figure 1.1. Main applications of Titanium Dioxide nanoparticles in industry.1
Another study2 predicted that most of the currently produced TiO2 will be
converted into nano-TiO2 by the end of year 2026, reaching an overall production
8 TiO2 will replace the bulk scale material at an exponentially increasing rate,
substituting it completely by the end of year 2026.
Figure 1.2. Prediction of the demand of Titanium Dioxide for industrial applications.2
A study from Lewicka Z. et al. (2011)3 reported that the TiO2-NPs used in
commercial sunscreens exhibit the rutile crystalline structure rather than the anatase crystalline structure (which is dominant in the industrially produced TiO2-NPs).
TiO2 NPs are mostly needle or near-spherically-shaped, having a size generally
lower than 20 nm and are often coated with silica or alumina. However, despite the large production and usage of TiO2-NPs, little is known about their potential effects on health and the environment.
Chang X. et al. (2013)4 reviewed all the available studies concerning TiO2-NPs
toxicity to the human body. The selected articles (347 in total) were all related to particles smaller than 100 nm (i.e., nanoparticles), clearly stated the target cell or organism (either human or animal) and the experimental exposure conditions. Their findings highlighted the presence of nano-TiO2 in various important organs, such as
liver, kidney, spleen and brain.
Wang S. et al., (2013)5 investigated the effect of nano-TiO2 exposure in mice,
finding out that nanoparticles absorbed by adults were transmitted to their offsprings during pregnancy, leading to the presence of NPs in their brain and testes causing
9 decreased sperm production, along with other effects. In addition to its potential genotoxic effects, exposure to nano-TiO2 was also shown by Sun H. et al. (2007)6 to
increase the mortality of carp.
Regarding nano-TiO2 interaction with UV radiation, several studies7–9
highlighted the photo-activity of TiO2: when irradiated with solar light, nano-TiO2 was shown to increase the mortality of several viruses, bacteria, organic and
inorganic contaminants more than without UV irradiation; nano-TiO2 photo-toxicity
is mainly exerted through the production of ROS (reactive oxygen species) which may cause endocrine disruption. Furthermore, TiO2 NPs were shown to have
antimicrobial properties.9,10
Considering the increasing trend in the use of nano-TiO2 for an ever-increasing
range of applications and products, the occurrence of accumulation-related environmental events is likely, as much as their release and accumulation into the ecosystem, both fluvial and marine. However, to the current state of knowledge, no long term data on the potential hazards posed by nano-TiO2 pollution are available,
due to the relative newness of this technology. Given the significant production and consequent release of nanoparticles to the aquatic environment, the ecosystem might incur dangerous modifications, with detrimental impacts on its organisms. Nonetheless, release of TiO2 NPs to water bodies might ultimately result in its
accumulation in drinking water.11
Further concerns are posed for environmental systems in which a variety of pollutants are present. Due to its chemical and physical properties, nano-TiO2 can
effectively adsorb and transport other substances on its surface, easing their accumulation in different end-points. As an example, a study conducted by Hartmann N. B. et al. (2012)12 showed that cadmium metal strongly adsorbs onto
nano-TiO2 surface due to the nanoparticles’ small size, large surface area, and strong
electronic attraction. After being transported, cadmium was found to accumulate into various marine organisms with an increased uptake but without influencing its bioavailability to the tested organisms.
10 The goal of this study is to investigate the significance of toxicity of nano-TiO2
released by PCPs towards marine algae, and to compare it to industrially-produced TiO2 NPs. Two different commercialized PCPs will be investigated (sunscreen and
toothpaste), in accordance with the study`s aim. The toxicological results will hopefully provide more insight into the subject of nano-pollution of the marine environment, as well as a starting point for future investigation.
11 Chapter 2 - Literature review
Titanium dioxide is one of the most widely spread nano metal oxides in a variety of industrial applications. Due to its macroscopic characteristics of whiteness and opacity, it is used in many personal care products (including sunscreen and toothpaste), paintings and covers, whitening of foods and paper, etc. Nano-TiO2 has
an open cycle, meaning that at the end of its useful life it is released almost entirely into the environment, through different routes.1 As can be observed from Figure
2.1., Nano-TiO2 is the second most produced nano metal oxide worldwide, for a total
of 3000 tons every year. The world-wide produced amounts of other relevant metal oxide nanoparticles are summarized in Table 2.1.
Figure 2.1. Worldwide production of Metal Oxide nanoparticles in tons/year.1
Table 2.1. Worldwide produced amounts of Metal Oxide nanoparticles (tons/year). 1
MO-NP tons/y SiO2 5500 TiO2 3000 ZnO 550 CNT 300 FeOx 55 CeOx 55 AlOx 55
12 Yin T. et al. (2014)13 developed a probabilistic emission model for five
industrially used engineered nanoparticles (TiO2, ZnO, Ag, CNT, and fullerenes),
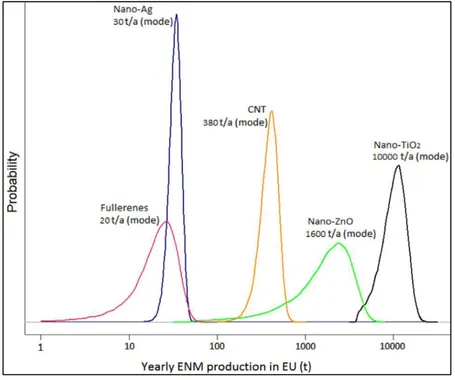
basing the model on the available information from producers and retailers in Europe (with a focus on Switzerland). The lifecycle flow charts were complemented with quantitative information retrieved from different companies in order to determine the final percentage of material released to the environment. According to the available data, different probability distributions were developed; in particular, as can be seen from Figure 2.2, nano-TiO2 production was modeled yielding a
resulting mode 10,000 tons/year, making it the engineered nanoparticle with the highest production.
Figure 2.2. Probabilistic distribution for various ENPs’ yearly production in Europe.13
Moreover, data were taken into account following the probabilistic approach named Degree of Belief, based on the precision and accuracy of each datum. In this way it was possible to model the intrinsic variability involved in the lifecycle of a nanoparticle via Monte Carlo simulation, managing to deal with sources of uncertainty in a uniform way.
Uncertainty parameters were related to different steps of the products’ lifecycle, such as production, distribution, and especially use and disposal, which determine
13 the highest share of release of nanoparticles to the environment. The same study also developed mass-flow logic diagrams for the five engineered nanoparticles on a European scale, eventually providing stepping stone for future development or for the regulation of emissions. Mass-flow diagrams concerning nano-TiO2 are shown
in Figure 2.3. A similar study should be conducted on a worldwide scale, to better understand the emission trend the environment is going to face in the upcoming years.
Figure 2.3. Mass-flow logic diagram for Nano TiO2 and TiO2 Pigment on a EU scale.13
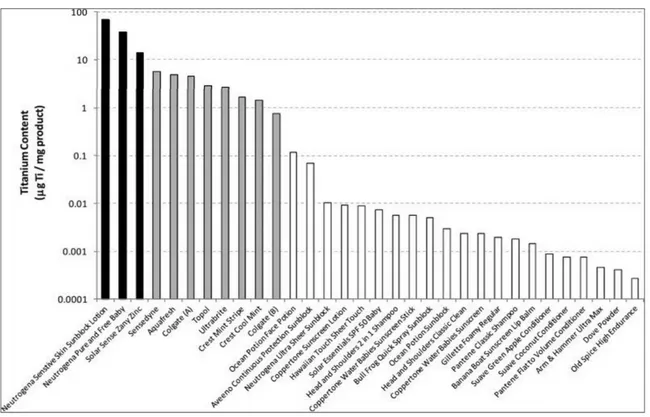
A study from Weir et al. (2012)14 investigated the presence of nano-TiO2 in a
range of personal care products, pharmaceuticals, foods, deodorants, as well as in other products known to make use of TiO2 NPs. From the analysis of eight different
toothpastes, the titanium content ranged from 0.7 to 5.6 mg/g-product, meaning from less than 0.1% to more than 0.5% in weight. All the findings were consistent with what was reported on labels. In the same study, a similar analysis conducted on three different sunscreens revealed a much higher content of TiO2, measured
between 14 and 90 mg/g-product (1.4% to 9% in weight). Among the tested products, sunscreens were by far the ones with the highest content of nano-TiO2.
Since sunscreens are directly washed off into the marine environment (when they are not completely absorbed into skin), this result poses a fundamental threat to the marine ecosystem.
14
Figure 2.4. Titanium Dioxide Nanoparticles content in sunscreens (black), toothpastes (grey), and other personal care products (white) expressed in parts-per-thousand.14
The physical properties of TiO2 NPs used in different commercial sunscreens
were investigated by Lewicka Z. et al. (2011)3 through different techniques,
including XRD, SEM and TEM observation, and BET surface area analysis. From their findings, eight sunscreens use nano-TiO2 in the rutile crystalline structure and
only one presented nano-TiO2 in the anatase crystalline structure. Particles were needle or near spherically-shaped and measured around 25 nm in their primary particle size. In their experiments Clément et al. (2013)15, analyzed the correlation
between crystalline structure and particle size of both anatase and rutile form nano-TiO2 and its toxicity to marine organisms using rotifers, algae, and daphnies as
model organisms. As a result, they discovered that anatase form nanoTiO2 is toxic in
all of the performed toxicity tests (acute, medium acute and long term); whereas rutile nanoTiO2 tends to form large agglomerates while in aqueous suspension, thus
becoming a minor threat in terms of toxicity. It was also demonstrated that exposure time, particle aggregation, and concentration are contributing factors in nanoparticle-mediated toxicity. Further analyses on the non-volatile inorganic residuals revealed
15 the presence of other nano metal oxides (Al2O3 and SiO2) used as coating agents for
TiO2 NPs, in order to reduce its photo-activity.3
Another study from Lewicka Z. et al. (2013)16 investigated the possible ROS
(Reactive Oxygen Species) production upon UVA and UVB irradiation for eight different commercial sunscreens, through quantitative measurements. TiO2 NPs
ROS production proved to be negligible, due to the effectiveness of the coating materials (silica and alumina) used to minimize their photo-activity. However, a similar study conducted by Rincon et al. (2004)17 demonstrated how water solar
disinfection through ROS production by means of nano-TiO2 is an effective process.
Additionally, Kwak S. Y. et al. (2001)18 found application for TiO2 antibacterial
properties in membrane filters: a nano-TiO2-based membrane was fouled by E. coli
less than a traditional one when irradiated with UV.
Rincon’s experimental procedure17 planned to irradiate various bacteria
(coliforms and cocci) with UV radiation, and to repeat the same treatment with the addition of TiO2 to the cultures. As a result, the sole UV irradiation did not prevent a
normal bacterial growth; however, the addition of TiO2 NPs caused a decrease in the
population count, even after terminating the irradiation process for the following 60 hours. ROS production is by far the most credited toxicity mechanism among metal oxide NPs, yet the real link between metal oxide NPs and ROS production remains ambiguous. ROS exist in different forms with slightly different toxicity mechanisms (e.g., OH- radicals, hydrogen peroxide in combination with other ROS, superoxide ions). ROS production is due mainly to UV light, although in some cases visible light can also contribute (e.g., ZnO, which has a large band gap). At a molecular level, ROS production seems to be due to oxygen vacancies in the NP. The mechanisms involved in nano-TiO2 photo-toxicity need, therefore, to undergo
further investigation in order to assess the risks posed by the nanomaterial.
Many studies on the possible genotoxicity caused by exposure to TiO2 NPs were
reviewed by Chen T. et al. (2013)19, who found that TiO2 NPs under UV radiation
may cause modifications in the DNA leading to cell mutation diseases (e.g., cancer). However, results are not unique among the existing studies. The review included a
16 variety of studies on in vivo and in vitro tests, on different organisms: tests on human lymphocytes, bronchial and lung cells yielded either positive or negative results, as well as studies conducted on hamsters and mice exposed to inhalation of nano-TiO2. In vivo mutation tests were conducted on mice and on Drosophila
Melanogaster, but still did not yield uniform results, thus urging us toward a deeper understanding of this phenomenon.
As for marine environment eco-toxicity, the available studies have been reviewed by Minetto D. et al. (2014)20 who found that the cell growth inhibition test
was the only kind of test used to assess nano-TiO2 eco-toxicity. Species that have
already been tested for nanoTiO2 toxicity are Dunaliella tertiolecta, Isochrysis
galbana, Phaeodactylum tricornutum, Thalassiosira pseudonana and Skeletonema. From the overall results of past studies, it appears still difficult to establish whether nanoTiO2 is toxic to the marine environment or not, as different species derived
different results. Also, tests were performed under non standardized environmental conditions, thus making their results inconsistent with other literature. The works reviewed by Minetto et al. are synthesized in Figure 2.5 and highlight the relatively low amount of studies on nanoparticles’ toxicity in the marine environment, as of 2014.
A review of toxicity tests for different metal oxide nanoparticles on marine
species is shown in Table 2.3.
Figure 2.5. Studies reviewed by Minetto et al. (2014) regarding nanoparticles’ toxicity in water environment, subdivided between freshwater, sea water and brackish water. 20
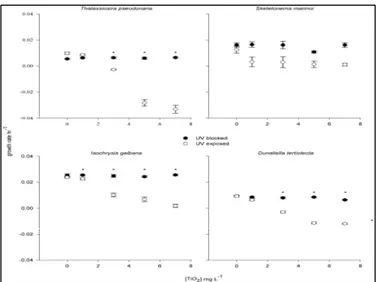
17 Miller et al. (2012)21 performed an inhibition test under different UV irradiation
conditions, for different industrial TiO2 NPs concentrations on four different marine
diatoms: T. pseudonana, S. costatum, I. galbana, and D. teriolecta. The test showed an inhibited growth under UV irradiation for all the algae except for I. galbana; the assumption made was that the main cause of inhibition is oxidative stress mediated by nano-TiO2 high photo-activity, assumption which was later supported by
measurements of increased oxygen radicals production as a function of nano-TiO2
concentration.
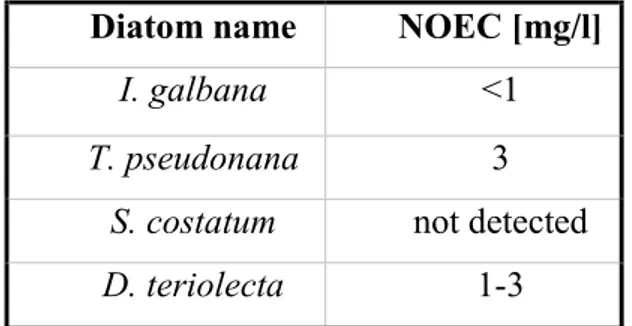
UV irradiation was calibrated in order to reproduce oceanic surface conditions (UVA 4.5 W/m2 and UVB 4.1 W/m2). Each of the three affected diatom species showed a different no-effect concentration (NOEC) threshold, yet all of them showed growth inhibition after a certain concentration only under UV exposure; the measured thresholds are shown in Table 2.2, and the different responses of the diatoms to UV irradiation are shown in Figure 2.6, where it can be seen that without UV irradiation no toxic effects occurred on any of the tested diatoms.
Table 2.2. NOEC for four different diatoms exposed to TiO2 nanoparticles.21
Diatom name NOEC [mg/l]
I. galbana <1
T. pseudonana 3
S. costatum not detected D. teriolecta 1-3
18 The study also highlighted the concern of ROS-induced stress on non-photosynthetic organisms. In fact, diatoms already live in hyperoxic conditions during photosynthesis, thus having naturally developed barriers against oxygen radicals. The same cannot be said for non-photosynthetic organisms, which therefore are into a potentially much greater danger.
Multiple studies on the release of metal ions from nano metal oxides as a potential toxicity mechanism toward different marine species were reviewed by Bondarenko O. et al.(2013)22. This toxicity mechanism is related mostly to particles
with higher water solubility (such as ZnO and CuO), while it is less relevant for nearly insoluble particles such as TiO2. To assess whether the toxicity is due to
metal ions release, usually diverse metal salts are used (sulphates, chlorides, etc.), and the environmental responses to Metal Oxide NPs and metal salt are compared. Metal ion release-based toxicity is much more time dependent than nanoparticle toxicity, so an appropriate exposure time has to be elapsed during the analysis. In fact, after some time, nanoparticles tend to aggregate, strongly decreasing their toxic power, so dissolved metal ions remain the only toxic factor.
Metal oxide NPs have also shown mechanisms of cytotoxicity, by which the nanoparticles attach themselves to the organism, remain there even after washing and end up being adsorbed onto the cell membrane. However, other studies assume
Figure 2.6. Effect of UV irradiation on TiO2 nanoparticles’ toxicity towards four different diatoms.21
19 that the toxicity does not have a direct relationship with surface adsorption of NPs, but with their electrostatic interaction with the membrane. Positively charged nanoparticles are attracted to the negatively charged bacteria, easing the adsorption on the outer membrane. It was found by Chang Y. (2012)23 that a single nanoparticle
is sufficient to disrupt a double layer lipid vesicle. Therefore, electrostatic interactions may have a significant role in NP toxicity.23
All of the cited experiments and the reviewed papers analyzed nTiO2 toxicity
with different methodologies, very few of which were standardized (OECD 201 guidelines24 seem to be the most authoritative source of protocol). As a first step, a
precise approach to nTiO2 analysis should be developed according to said
guidelines, to provide a milestone and a future consistent comparison for future toxicity studies and technological developments.
Then, it has been proved that commercial nTiO2 is always different from
nano-TiO2 extracted by sunscreens or other PPCPs.3 This often happens favoring a major
complexity of nTiO2 particles which are for example coated with other ENPs; since
nTiO2 is quite inert itself, a deep study of its interactions with coating agents and
other toxics should be performed, in order to have a real estimate of the potential hazard posed by this new material. Finally, since phytoplankton species make the foundation of marine ecosystems, a little change in their amount, life cycle or chemical behavior could lead to unexpected consequences for the whole ecosystem.
20
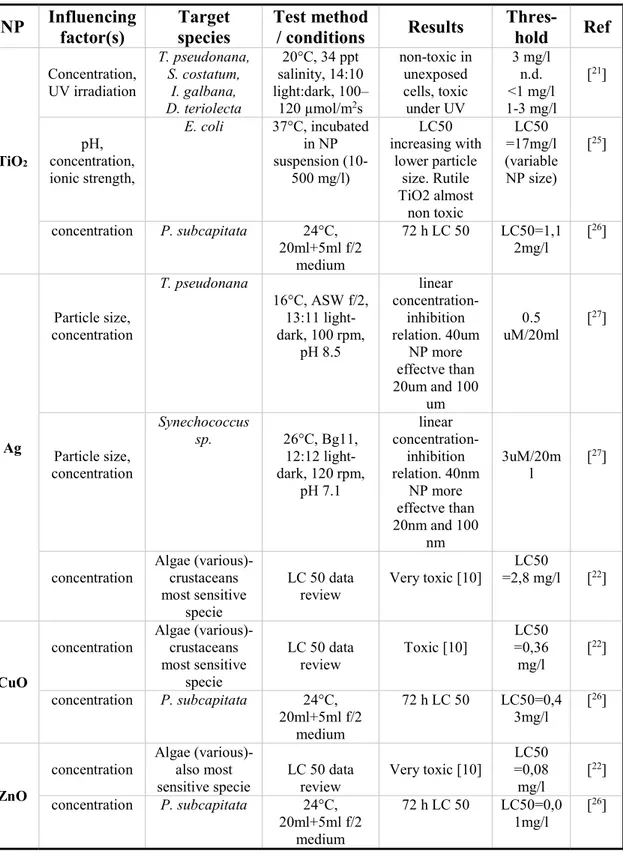
Table 2.3. Review of toxicity studies performed on several nanoparticles and organisms
NP Influencing factor(s) Target species Test method / conditions Results Thres-hold Ref
TiO2 Concentration, UV irradiation T. pseudonana, S. costatum, I. galbana, D. teriolecta 20°C, 34 ppt salinity, 14:10 light:dark, 100– 120 µmol/m2s non-toxic in unexposed cells, toxic under UV 3 mg/l n.d. <1 mg/l 1-3 mg/l [21] pH, concentration, ionic strength, E. coli 37°C, incubated in NP suspension (10-500 mg/l) LC50 increasing with lower particle size. Rutile TiO2 almost non toxic LC50 =17mg/l (variable NP size) [25] concentration P. subcapitata 24°C, 20ml+5ml f/2 medium 72 h LC 50 LC50=1,1 2mg/l [ 26] Ag Particle size, concentration T. pseudonana 16°C, ASW f/2, 13:11 light-dark, 100 rpm, pH 8.5 linear concentration- inhibition relation. 40um NP more effectve than 20um and 100 um 0.5 uM/20ml [ 27] Particle size, concentration Synechococcus sp. 26°C, Bg11, 12:12 light-dark, 120 rpm, pH 7.1 linear concentration- inhibition relation. 40nm NP more effectve than 20nm and 100 nm 3uM/20m l [ 27]
concentration Algae (various)- crustaceans most sensitive
specie
LC 50 data
review Very toxic [10]
LC50
=2,8 mg/l [22]
CuO
concentration Algae (various)- crustaceans most sensitive specie LC 50 data review Toxic [10] LC50 =0,36 mg/l [ 22] concentration P. subcapitata 24°C, 20ml+5ml f/2 medium 72 h LC 50 LC50=0,4 3mg/l [ 26] ZnO
concentration Algae (various)- also most
sensitive specie LC 50 data review Very toxic [10]
LC50 =0,08 mg/l [ 22] concentration P. subcapitata 24°C, 20ml+5ml f/2 medium 72 h LC 50 LC50=0,0 1mg/l [ 26]
21 Chapter 3 - Industrial nano-TiO2 Toxicity Test
In this section, the experimental analysis that was performed in order to assess the toxicity of industrial TiO2 nanoparticles towards the marine diatom
Thalassiosira pseudonana, that was chosen as the target organism for this study, will be presented. The assessment of toxicity will be based on the percentage growth inhibition detected between specimens exposed to nano-TiO2 and an
uncontaminated sample, from now referred to as “control”. All of the experiments were run at the Environmental Engineering Laboratory of the University of Miami.
The potential response of the marine environment to the variation of one or more factors is generally represented by a chosen model organism that has peculiar properties relevant to the study. Diatoms are often chosen as model organisms for marine toxicity studies given their relevance in the overall balance of the ecosystem: in fact, they account for the fixation of 40% of the total fixed carbon in the marine ecosystem28, meaning that they provide a solid basement for the marine food chain,
and due to their sensitivity to any physical or chemical variation in the environment. The marine diatom Thalassosira pseudonana is often considered as a reliable model organism for both marine and freshwater environments, as a wide knowledge is available on it: its genome was completely sequenced29, and its physical
conformation has been widely investigated through a variety of techniques. Such level of knowledge makes it easier to track the impact of a variety of factors on the diatom, allowing to draw more general conclusions.
Reported mechanisms of toxicity of TiO2 nanoparticles include genotoxicity19,30
and surface adsorption15, and Thalassiosira pseudonana has been already widely
used to better understand the aforementioned mechanisms, thanks to the fact that its genome has been completely sequenced, and given the peculiar shape of its outer silica shell (cylindrical shape, with a complex pattern of nanopores)31, which allows
particular adsorption and internalization mechanisms. Moreover, the shell of Thalassiosira pseudonana is peculiar, as silica is a relatively refractory (melting point >1700 °C) and highly abrasive material, and such properties are already employed in industry. However, little or no knowledge is currently available on the
22 change in susceptibility to nanoparticle-mediated toxicity that silica shells imply when compared to the organic cell walls of other marine microalgae; therefore, further research effort needs to be devoted to the clarification of the role of silica shells in the observed macroscopic toxic effects.
Given that the purpose of this study is to investigate the toxic effects of different types of TiO2 nanoparticles suspended in artificial seawater, and given the variety of
toxicity mechanisms that have already been reported for these nanoparticles, the chosen target organism for this study was the marine diatom Thalassiosira pseudonana, being it one of the most significant organisms in the marine environment, given its sensitivity to environmental modifications and fundamental role in the food chain and chemical balance of the ecosystem.
3.1 Technical equipment
After having received proper training from experienced personnel, Ph. D. students, and from online courses (completed the required modules from the Collaborative Institutional Training Initiative -C.I.T.I.- Program), the following equipment was used for the purposes of this study and will be now introduced.
3.1.1 Beckman Coulter DU 720 - Spectrophotometer
In order to determine the differences in diatom growth, it was decided to use the light absorbance of the tested samples. In order to do so, a DU 720 UV/Vis Spectrophotometer32 (Beckman Coulter, DU® 720, Pasadena, CA) was used; it can
be observed in Figure 3.1. The spectrophotometer that was used can detect wavelengths in the range of 190-1100 nm, and measure the light absorbance with an accuracy of 0.001 Abs. The operational protocol of the spectrophotometer requires to:
Define the wavelength range to be tested,
Scan a “blank” specimen (ultrapure water) in order to calibrate the device, and
23
Figure 3.1. DU 720 UV/Vis Spectrophotometer.32
3.1.2 Nano ZS90 – Zeta-sizer
The device that was used in order to carry over the measurements of particle size and zeta potential that were necessary to further characterize the colloidal suspensions formed by the tested nanoparticles was the Nano ZS90 Zeta-sizer33
(Malvern Instruments, UK) that is shown in Figure 3.2. Particle sizes (diameter) that can be measured range from 0.3 nm to 5.0 µm. Zeta potential can be measured for particles ranging from 3.8 nm to 100 µm (diameter), with an accuracy of 0.12 µm cm/Vs. The operational protocol for the Nano ZS90 Zeta-sizer requires to:
Wash the cuvettes with ethanol,
Fill the size-measurement cuvette up to the appropriate mark, Insert the cuvette in the zeta-sizer and run the measurement, Remove the size-measurement cuvette,
24 Fill the zeta potential-measurement cuvette appropriately, and
Insert the cuvette in the zeta-sizer and run the measurement.
Figure 3.2. Nano ZS90 zeta-sizer33 (Malvern Instruments, UK), and the special cuvettes used to
measure zeta potential (left) and particle size (right).
3.1.3 Verilux VT 10 - 5000 lux white UV Lamp
The culture conditions of the test samples were defined in accordance with existing literature, and the samples were stored in an incubator at a constant temperature T=26°C, being subjected to 12h dark:light cycles of white UV light, in order to recreate the ideal growth conditions for the marine diatom Thalassiosira pseudonana. The illumination was provided by the Verilux VT 10 - 5000 lux34
(Verilux, VT) lamp, shown in Figure 3.3, which was regulated by means of a timer that switched it every 12 hours.
25
Figure 3.3. Verilux VT 10 Lamp - 5000 lux34 (Verilux, VY), white UV light, shown in the incubator
together with a Petri dish and two cell Mass Cultures.
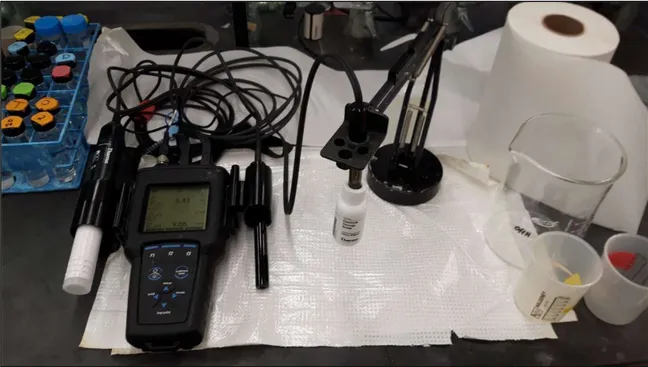
3.1.4 OrionTM pH-meter
The pH of the solution needs to be measured at the beginning and at the end of the experiment, as well as whenever zeta potential and particle size measurements are performed, in order to be able to plot the IEP (Isoelectric Point) of the measured nanoparticles and to keep track of possible changes in the sample. The monitoring of ph was achieved using the OrionTM 720Aplus pH-meter 35(Thermo Fisher Scientific,
MA) (Figure 34), in combination with the glass electrode Orion™ 8156BNUWP35
26
Figure 3.4. OrionTM 720Aplus pH-meter35 and glass electrode on its support.
3.2 Manufacture of artificial seawater and f/2 medium
In order to recreate the natural marine environment in which the tested diatom Thalassiosira pseudonana lives and reproduces, while maintaining standardized experimental conditions, Artificial Sea Water (ASW) and f/2 medium were used in each diatom culture. Guillard’s f/2 medium is among the recommended live foods for aquaculture from FAO36 for its composition and nutrients, along with Walne’s
medium (equivalent, not used in this study). Artificial Seawater and f/2 medium were prepared in the laboratory according to Guillard et al. (1962)37 and Keller et al.
(1988)38.
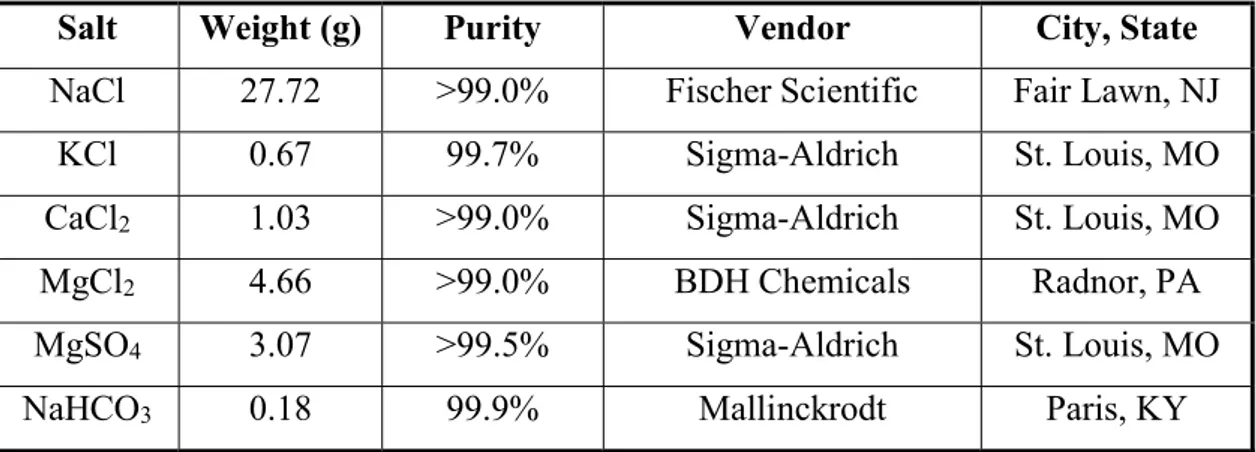
3.2.1 Preparation of artificial sea water
For the preparation of Artificial Sea Water, the salts shown in Table 3.1 have to be dissolved in 1 liter of ultrapure water (18.2 MΩ) produced with a three-stage Millipore Milli-Q plus 185 purification system (Millipore, Billerica, MA):
27
Table 3.1. Salts to be dissolved in Ultrapure water to obtain Artificial Sea Water
Salt Weight (g) Purity Vendor City, State
NaCl 27.72 >99.0% Fischer Scientific Fair Lawn, NJ
KCl 0.67 99.7% Sigma-Aldrich St. Louis, MO
CaCl2 1.03 >99.0% Sigma-Aldrich St. Louis, MO
MgCl2 4.66 >99.0% BDH Chemicals Radnor, PA
MgSO4 3.07 >99.5% Sigma-Aldrich St. Louis, MO
NaHCO3 0.18 99.9% Mallinckrodt Paris, KY
Once prepared, Artificial Sea Water is adjusted to a pH=8.0 by the progressive addition of 1 M NaOH or HCl; the pH was monitored with the pH-measurement apparatus that has been illustrated in Section 3.1.4.
3.2.2 Preparation of f/2 medium
The f/2 medium is a common addition to Artificial Sea Water in order to provide the ideal amount of chemicals and nutrients necessary to marine and coastal diatoms to thrive and reproduce. The name “f/2 medium” comes from the fact that the concentration given in the original formulation of this medium, named “f medium” (Guillard et al., 1962)37, has been reduced by a factor 2. The composition of f/2
medium is listed in Table 3.2; the prescribed quantities are to be added to an initial volume of 950 ml of ASW, which has then to be adjusted to a final volume of 1 l.
Table 3.2. f/2 medium composition.37
Component Stock solution Quantity (ml) Concentration
NaNo3 75 g/L 1 8.82 x 10⁻⁴ M
NaH2PO4H2O 5 g/L 1 3.62 x 10⁻⁵ M
Trace metal solution - 1 -
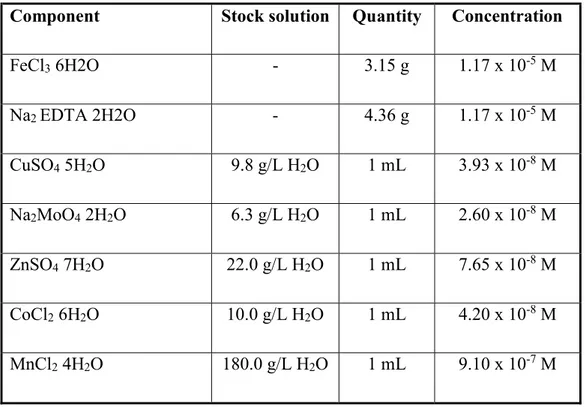
28 The detailed compositions of the trace metal solution and of the vitamin solution are shown in tables 3.3 and 3.4, respectively. The indicated stock solutions required for the making of the Trace Metal solution have to be prepared separately. The amounts indicated in the column “Quantity” are to be added to an initial volume of 950 ml ASW, which will be then adjusted to a final volume of 1l by the addition of ASW.
Table 3.3. Trace Metal solution composition.37
Component Stock solution Quantity Concentration
FeCl3 6H2O - 3.15 g 1.17 x 10⁻⁵ M Na2 EDTA 2H2O - 4.36 g 1.17 x 10⁻⁵ M CuSO4 5H2O 9.8 g/L H2O 1 mL 3.93 x 10⁻⁸ M Na2MoO4 2H2O 6.3 g/L H2O 1 mL 2.60 x 10⁻⁸ M ZnSO4 7H2O 22.0 g/L H2O 1 mL 7.65 x 10⁻⁸ M CoCl2 6H2O 10.0 g/L H2O 1 mL 4.20 x 10⁻⁸ M MnCl2 4H2O 180.0 g/L H2O 1 mL 9.10 x 10⁻⁷ M
The necessary components for the preparation of the Vitamin solution are presented in Table 3.4; the listed quantities are added to an initial volume 950 mL of ASW, and then adjusted to a final volume of 1 l by the addition of ASW.
Table 3.4. Vitamin solution composition.37
Component Stock solution Quantity Concentration Thiamine HCl (vit. B1) - 200 mg 2.96 x 10⁻⁷ M
29 Biotin (vit. H) 1.0 g/L H2O 1 mL 2.05 x 10⁻⁹ M
Cyanocobalamin (vit B12) 1.0 g/L H2O 1 mL 3.69 x 10⁻¹⁰ M
3.3 Nanoparticles
Commercial TiO2 nanopowder (>99.7% purity, <25nm particle size, 45–55 m2/g
surface area, anatase) was purchased from Sigma-Aldrich39 (St. Louis, MO). The set
of tested effective concentrations for industrial TiO2 nanoparticles was 1.0 mg/l, 2.5
mg/l, and 5.0 mg/l, obtained by adding the required amount of nanopowder to the final volume of diatom culture and ASW + f/2 medium.
3.4 Diatom culture
Thalassiosira pseudonana cells were purchased from Bigelow Laboratory for Ocean Sciences (CCMP 1335)40. The culture was created by adding the purchased
cells to a 1L mass flask containing ASW + f/2 medium. The culture was then incubated at a constant temperature of 26°C, with 12h:12h (dark:light) cycles using the Verilux VT 10 white UV lamp illustrated in Section 3.1.3.
3.5 Experimental setup
In order to perform the designed growth inhibition tests, both the diatom culture and the TiO2 nanoparticles needed to be characterized in terms of absorbance,
defining the peak absorbance wavelength for each of them. In fact, if the peak absorbance wavelengths of diatoms and nanoparticles were too close one to the other (i.e., enough to cause overlapping of absorbance peaks), the absorbance measurement would not have been a reliable indicator, and alternative ways to assess toxicity would have had to be found.
3.5.1 Detection of T. pseudonana peak absorbance wavelength In the present study, several measurements of absorbance were performed on control samples and on samples that were exposed to TiO2 nanoparticles under
designated conditions. Absorbance was chosen as an indirect measurement of growth inhibition: the rationale behind this choice was that, under the condition that
30 nanoparticles and diatoms had different and non-overlapping absorbance peaks, a lower absorbance in a contaminated sample would represent a decrease in diatom growth (i.e., growth inhibition), which has to be ascribed to the exposure to TiO2
nanoparticles, since they are the only modification made with respect to the control sample.
Prior to proceeding to the growth inhibition tests, the peak absorbance wavelength of the chosen target organism, Thalassiosira pseudonana, needed to be assessed. Given the wide range of wavelengths that the spectrophotometer can scan (i.e. 190-1100 nm, see Section 3.1.1), the range was preliminarily narrowed down by conducting a literature search on peak absorbance wavelengths for Thalassiosira pseudonana that were recorded in previous studies.
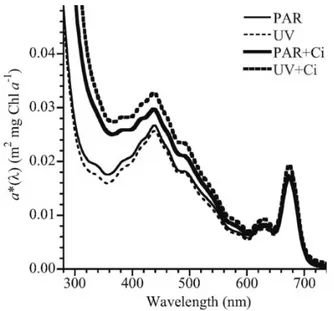
A study from Sobrino et al. (2008)41 recorded the specific absorbance of the
diatom Thalassiosira pseudonana, ranging from 290 nm to 750 nm. In this study, a clear absorbance peak was found between 650 nm and 690 nm, as it can be seen in Figure 3.5.
Figure 3.5. Absorbance spectrum of marine diatom Thalassiosira pseudonana under different culture conditions.41
The second study that was considered to assess the peak absorbance wavelength was a work from Davis et al. (2006)42: in this study, the culture of Thalassiosira
31 pseudonana was purchased by our same vendor (Bigelow Laboratory for Ocean Sciences, see Section 3.4), therefore it seemed reasonable to give credit to the emission wavelength that was used to monitor algal growth. In this case, the monitored wavelength has been near 670 nm.
Based on the reported works, we narrowed the inspected range of wavelength, starting from a 600 to 700 nm range, and moving the extremes that had lower absorbance. Once we reached a satisfying precision, having reduced the range of peak absorbance wavelengths to 668 to 679 nm, we further refined this range.
In order to do so, we measured and recorded the absorbance values of the cell culture (marine diatoms and ASW + f/2 medium, see Section 3.4), over the entire range (668-679 nm), performing the measurements at serial dilutions, with a dilution factor equal to 2 (i.e., after each measurement, the cell culture was diluted with ultrapure water to half of its original concentration).
A total of 8 dilutions were performed, reaching 1:256 of the initial concentration; at such dilution, the detection limit of the spectrophotometer was encountered (i.e. the measured absorbance was equal to 0.001, see Section 3.1.1), and therefore further dilutions would have been undetectable.
Absorbance values at each dilution were measured over the selected range and recorded, as it can be seen in Table 3.5. The performed measurement highlighted a peak absorbance wavelength of λ=674 nm, which was then assumed as the peak absorbance wavelength for the diatom Thalassiosira pseudonana, for all the purposes of this study.
32
Table 3.5. Light absorbance values of Thalassiosira pseudonana measured at different wavelengths and serial dilutions.
Wavelength (nm) 670 672 673 674 675 677 679 Dilution Factor 1 0.146 0.15 0.15 0.151 0.15 0.148 0.145 2 0.077 0.079 0.079 0.079 0.079 0.078 0.076 4 0.038 0.039 0.039 0.040 0.039 0.039 0.038 8 0.020 0.020 0.020 0.020 0.020 0.020 0.020 16 0.012 0.013 0.013 0.013 0.013 0.013 0.012 32 0.005 0.005 0.005 0.005 0.005 0.005 0.005 64 0.003 0.003 0.003 0.003 0.003 0.003 0.003 128 0.001 0.002 0.002 0.002 0.002 0.001 0.001 256 0.001 0.001 0.001 0.001 0.001 0.001 0.001
The absorbance values for λ=674 nm at each dilution were plotted on a Cartesian plan, and a trend line was calculated for the obtained (dilution, absorbance) set of points, to further assess the reliability of the chosen wavelength.
As a result, a linear relationship between absorbance and dilution factor was found, in agreement with our expectations (a decrease in the cell amount should lead to the same decrease in absorbance). The plot of the regression line is shown in Figure 3.6.
33
Figure 3.6. Regression line for the peak absorbance wavelength of Thalassiosira pseudonana, λ=674 nm.
R2=0.9993 further confirmed the reliability of the calibration experiment and
allowed us to move onto the following steps of the experiments.
3.5.2 Detection of nano-TiO2 peak absorbance wavelength
As it was anticipated, the indirect estimation of growth inhibition (i.e., TiO2
nanoparticles’ toxicity) by mean of absorbance measurements could only considered reliable in the case that the two peaks of light absorbance given by the diatom Thalassiosira pseudonana and by TiO2 nanoparticles occurred at significantly
different wavelengths, in order to avoid any kind of interference and subsequent misinterpretation. Therefore, the peak absorbance wavelength of TiO2 nanoparticles
had to be determined.
The procedure used was similar to the one illustrated in the previous section and used to determine the peak absorption wavelength of Thalassiosira pseudonana: absorbance measurements are performed on a colloidal suspension of TiO2 in ASW
+ f/2 medium, on a reasonably restricted range of wavelengths, and progressively diluting the original sample; the tested set of concentration was [100; 50; 20; 10; 5; 2; 1; 0.5; 0.25; 0,13] mg/L. In this way, we wanted to test the spectrophotometer for an upper and for a lower bound in detection limits, by measuring the absorbance of a
34 highly concentrated solution and by diluting the tested sample until the Limit of Detection (LOD).
Reported values in existing literature for TiO2 peak absorbance wavelength vary
in the range of 250 – 450 nm43,44, as it can be seen in Figure 3.7 and Figure 3.8;
therefore, the initial range was narrowed down qualitatively, using the absorbance plot function provided by the spectrophotometer. This allowed to assess a peak absorbance wavelength equal to λ=350 nm for the colloidal suspension of TiO2 in
ASW + f/2 medium.
Figure 3.7. Absorbance spectrum of visible light of Titanium Dioxide in different conditions.43
35 The results of the absorbance calibration test were plotted on a Cartesian plan, and a trend line was calculated for the obtained (concentration, absorbance) set of points, to further assess the reliability of the chosen wavelength.
As a result, a linear relationship between absorbance and dilution factor was found, in agreement with our expectations and with the findings that have been reported in the previous section. The R2=0.9957 further confirmed the reliability of
the results. The results are shown in Table 3.6 and in Figure 3.9.
Table 3.6. Results of the absorbance calibration test for industrial TiO2 nanoparticles; Detection Limit: 0.13 mg/L.
TiO2 conc. (mg/L) Abs
LOD - 0.13 0.001 0.25 0.002 0.5 0.003 1 0.004 2 0.007 5 0.014 10 0.028 20 0.036 50 0.114 100 0.244
36
Figure 3.9. Regression line for the peak absorbance wavelength of industrial TiO2 nanoparticles,
λ=350 nm.
3.5.3 Growth inhibition (%) as a function of exposure time
In this set of experiments, all of the tests were performed in triplicate copy. Each test sample was made by adding 15 mL of colloidal suspension of TiO2 in ASW +
f/2 medium to 15 mL of diatom culture (see Section 3.4 for reference) into a 50 mL Petri dish. The control samples (also triplicate) were prepared by adding 15 mL of ASW + f/2 medium to 15 mL of diatom culture into a 50 mL Petri dish. After having gently mixed each sample, they were tested for absorbance (see section 3.1.1 for operational protocol). After the absorbance measurement, the samples were put in the incubator, under the conditions stated in Section 3.1.4.
Absorbance measurements were repeated at scheduled times: 5h, 12h, 24h, 48h, 72h, and 96h.
The concentrations of industrial TiO2 nanoparticles that were tested in this
experiment were 2.5 mg/L and 5.0 mg/L.
The pH was measured at the beginning and at the end of the experiment using the pH-meter illustrated in section 3.1.4.
37 3.5.4 Growth inhibition (%) as a function of concentration
In this set of experiments, all of the tests were performed in triplicate copy. Each test sample was made by adding 15 mL of colloidal suspension of TiO2 in ASW +
f/2 medium to 15 mL of diatom culture (see Section 3.4 for reference) into a 50 mL Petri dish. The control samples (also triplicate) were prepared by adding 15 mL of ASW + f/2 medium to 15 mL of diatom culture into a 50 mL Petri dish. After having gently mixed each sample, they were tested for absorbance (see section 3.1.1 for operational protocol). After the absorbance measurement, the samples were put in the incubator, under the conditions stated in Section 3.1.4.
The samples were tested again for absorbance after a fixed elapsed time, t=72h. The concentrations of industrial TiO2 nanoparticles that were tested in this
experiment were 1.0 mg/L, 2.5 mg/L, and 5.0 mg/L.
The pH was measured at the beginning and at the end of the experiment using the pH-meter illustrated in section 3.1.4.
3.5.5 Monitoring of particle size, zeta potential, and pH
Hydrodynamic particle size and zeta potential were measured at the beginning of the experiment and at time steps of 5h, 12h, 24h, 48h and 72h (the latter was previously assessed to be the break-through time), by using the Nano ZS90 zetasizer illustrated in Section 3.1.2, following the measurement protocol illustrated in the same section.
pH was measured at the beginning of the experiment and at time steps of 5h, 12h, 24h, 48h and 72h (the latter was previously assessed to be the break-through time), by using the OrionTM pH-meter illustrated in Section 3.1.4. The measurements were performed by immersing the glass electrode in the sample, and then waiting for the stabilization before performing the reading of the current pH value.
38 All of the aforementioned measurements have been performed both on the control sample (see Section 3.5.3 for composition and preparation) and on the diatom cultures exposed to a 5 mg/L concentration of TiO2 nanoparticles.
3.6 Results
3.6.1 Particle size, zeta potential, and pH
The measurements for all of the cultures exposed to 5 mg/L colloidal suspensions of industrial, toothpaste-derived, and sunscreen-derived TiO2 nanoparticles are synthesized in Figure 5.3.
For industrial TiO2 nanoparticles, it can be seen that particle size experienced a net increase during the exposure time, going from an initial size of 70 nm to a final size of 81 nm. However, the particle size changed following a non-linear pattern, increasing until t=24h to a peak of 181nm, and then decreasing sharply.
The surface charge was relatively low immediately after injecting the colloidal suspension, at a value of -4.75 mV. After 5h, however, it increased its absolute value significantly up to -7.73 mV; from that time, it decreased its absolute value, reaching -5.72 mV.
The measured value of pH decreased slightly and rather linearly during time, going from 8.47 to 7.24.
3.6.2 Growth inhibition (%) as a function of exposure time
The measured values of absorbance and the calculated values of growth inhibition will be shown in the following page. At each time, triplicate values of absorbance were recorded both for the control sample and for every other test sample. A statistical analysis was conducted on each triplicate experiment, computing statistically relevant parameters such as average, variance, standard error on mean (i.e., SEM), and performing the student t-test, in order to assess its statistical significance.
39 The average values were then used to compute growth inhibition, according to the correlation proposed by Cao et al. (2011)45:
( ℎ ℎ , %) = − ∙ 100
The absorbance values used in the calculation are the average for each triplicate set.
The statistical parameters that were computed for this set of experiments are, as anticipated:
Standard deviation: this parameter allows to determine how disperse each triplicate set was. ̅ represents the average for the triplicate set.
σ= ∑(x-x)(n-1) 2
Standard error on mean (i.e., SEM): SEM is a measure of the precision of the mean.
SEM= σ √n
The student t-test was performed for all of the triplicate experiments, in order to assess their statistical significance. The test was conducted under the assumption of having two samples with equal variance. All of the tested concentrations showed statistical significance after t=96h (having p<0.05). Following are the tables and plots summarizing the data, statistical analysis and results of the time-dependent toxicity test at the concentrations of 2.5 mg/L and 5.0 mg/L.
40
Table 3.7. Dataset and results for inhibition as a function of exposure time; industrial nano-TiO2, 2.5
mg/L
Table 3.8. Dataset and results for inhibition as a function of exposure time; industrial nano-TiO2, 5.0
mg/L concentration 2,5 mg/L time 0 5 12 24 48 72 96 control 1 0,020 0,023 0,021 0,027 0,044 0,083 0,104 control 2 0,022 0,023 0,020 0,024 0,044 0,080 0,098 control 3 0,023 0,020 0,019 0,023 0,045 0,079 0,104 AVG 0,022 0,022 0,020 0,025 0,044 0,081 0,102 ST DEV 0,002 0,002 0,001 0,002 0,001 0,002 0,003 SEM 0,001 0,001 0,001 0,001 0,000 0,001 0,002 Indust. TiO2 1 0,026 0,021 0,019 0,024 0,038 0,044 0,065 Indust. TiO2 2 0,027 0,026 0,023 0,026 0,037 0,048 0,069 Indust. TiO2 3 0,027 0,024 0,022 0,023 0,038 0,046 0,071 AVG 0,027 0,024 0,021 0,024 0,038 0,046 0,068 ST DEV 0,001 0,003 0,002 0,002 0,001 0,002 0,003 SEM 0,000 0,001 0,001 0,001 0,000 0,001 0,002 G.I. (%) \ -8,12 -7,09 0,93 15,03 42,92 32,94 G.I. (%) ST DEV \ 7,48 7,20 4,88 0,61 1,82 2,05 G.I. (%) SEM \ 4,32 4,15 2,82 0,35 1,05 1,18 concentration 5 mg/L time (h) 0 5 12 24 48 72 96 control 1 0,029 0,024 0,020 0,032 0,043 0,100 0,119 control 2 0,027 0,024 0,022 0,031 0,048 0,103 0,122 control 3 0,027 0,026 0,020 0,033 0,047 0,106 0,126 AVG 0,028 0,025 0,021 0,032 0,046 0,103 0,122 ST DEV 0,001 0,001 0,001 0,001 0,003 0,003 0,004 SEM 0,001 0,001 0,001 0,001 0,002 0,002 0,002 TiO2 1 0,034 0,024 0,020 0,031 0,047 0,085 0,085 TiO2 2 0,031 0,024 0,020 0,031 0,046 0,091 0,091 TiO2 3 0,030 0,025 0,021 0,031 0,044 0,102 0,102 AVG 0,032 0,024 0,020 0,031 0,046 0,093 0,093 ST DEV 0,002 0,001 0,001 0,000 0,002 0,009 0,009 SEM 0,001 0,000 0,000 0,000 0,001 0,005 0,005 G.I. (%) \ 1,28 1,36 3,06 0,42 10,14 24,34 G.I. (%) ST DEV \ 1,11 3,57 1,52 4,24 2,88 2,43 G.I. (%) SEM \ 0,64 2,06 0,87 2,45 1,66 1,40
41
Figure 3.10. % Growth inhibition of Thalassiosira pseudonana as a function of exposure time; industrial nano-TiO2, 2.5 mg/L
Figure 3.11. % Growth inhibition of Thalassiosira pseudonana as a function of exposure time; industrial nano-TiO2, 5.0 mg/L
The task of the present set of experiments was to assess whether exposure time had a significant impact on the toxicity exerted by industrial nano-TiO2 towards
42 As it can be observed from both Figure 3.10 and Figure 3.11, a significant increase in % growth inhibition occurs after t=72h, while the preceeding growth inhibition is almost negligible and/or flawed by high standard deviations.
This can be explained analyzing the typical cellular growth curve, shown in Figure 3.12: cellular growth is initially characterized by a lag-phase, during which almost no growth can be observed on the population. After the lag-phase, a sudden increase in the slope of the plot (i.e. growth rate, growth per unit time) can be observed: this is the so-called log-phase, during which an evident increase (logaritmic growth rate) of the cell population can be observed. After this phase, a stationary phase (no growth) and a decline phase (negative growth rate) are present.
Figure 3.12. Typical cell growth curve.46
The initially low growth inhibition is due to the fact that no diatom growth is likely to occur at all during the first phase, thus reducing the potential for growth inhibition.
Our plots have a strong resemblance with the first two phases of the cellular growth curve, that can be therefore used to justify the existence of a break-through time between 48h and 72h from inoculation (i.e. acceleration phase). Given the
43 intrinsic variability involved in cell growth, it was concluded that t=72h was the proper breakthrough time for the tested system.
3.6.3 Growth inhibition (%) as a function of concentration The measured values of absorbance and the calculated values of growth inhibition will be shown in the following page. At t=0h and t=72h (previously assessed as a proper break-through time), triplicate values of absorbance were recorded both for the control sample and for every other test sample. A statistical analysis was conducted on each triplicate experiment, computing statistically relevant parameters such as average, variance, standard error on mean (i.e., SEM), and performing the student t-test, in order to assess its statistical significance.
The average values were then used to compute growth inhibition, according to the correlation proposed by Cao et al. (2011)45:
( ℎ ℎ , %) = − ∙ 100
The absorbance values used in the calculation are the average for each triplicate set.
The statistical parameters that were computed for this set of experiments are, as anticipated:
Standard deviation: this parameter allows to determine how disperse each triplicate set was. ̅ represents the average for the triplicate set.
σ= ∑(x-x)(n-1) 2
Standard error on mean (i.e., SEM): SEM is a measure of the precision of the mean.
SEM= σ √n
The Pearson Correlation Coefficient was computed for concentration versus percent growth inhibition.
44
= ∑[( − )( . . − . . )]
∑[( − ) ( . . − . . ) ]
The computed correlation coefficient between concentration and percent growth inhibition for industrial TiO2 nanoparticles is equal to 0,991, thus
showing high positive correlation between the aforementioned parameters. Following are the tables and plots summarizing the data, statistical analysis and results of the concentration-dependent toxicity test at the concentrations of 1.0 mg/L, 2.5 mg/L, and 5.0 mg/L.
Table 3.9. Dataset and results for inhibition as a function of concentration at breakthrough time t=72h.
Sample abs (t=0h) abs (t=72h) G.I. (%) G.I. (%) ST. DEV G.I. (%) SEM Control 1 0,010 0,030 Control 2 0,010 0,028 Control 3 0,009 0,023 IND TiO2 1mg/l #1 0,01300 0,02700 IND TiO2 1mg/l #2 0,01300 0,02500 IND TiO2 1mg/l #3 0,01300 0,02600 IND TiO2 2.5mg/l #1 0,01100 0,02600 IND TiO2 2.5mg/l #2 0,012 0,024 IND TiO2 2.5mg/l #3 0,010 0,026 IND TiO2 5mg/l #1 0,015 0,023 IND TiO2 5mg/l #2 0,010 0,024 IND TiO2 5mg/l #3 0,013 0,023 13,58025 0,42514 0,24545 6,17284 1,87061 1,08000 / / / 3,70370 2,70000 1,55885
45
Figure 3.13. % Growth inhibition of Thalassiosira pseudonana as a function of concentration; measured at breakthrough time t=72h.
46 Chapter 4 – Product-derived nano-TiO2 Toxicity
In this section, the experimental analysis that was performed in order to assess the toxicity of sunscreen-derived and toothpaste-derived TiO2 nanoparticles towards
the marine diatom Thalassiosira pseudonana, that was chosen as the target organism for this study, will be presented. The assessment of toxicity will be based on the percentage growth inhibition detected between specimens exposed to nano-TiO2 and
the control sample. All of the experiments were run at the Environmental Engineering Laboratory of the University of Miami.
4.1 Technical equipment
The following equipment was used for the purposes of this study and will be now introduced.
4.1.1 Beckman Coulter DU 720 - Spectrophotometer
In order to determine the differences in diatom growth, it was decided to use the light absorbance of the tested samples. In order to do so, a DU 720 UV/Vis Spectrophotometer32 (Beckman Coulter, DU® 720, Pasadena, CA) was used; it can
be observed in Figure 3.1. The spectrophotometer that was used can detect wavelengths in the range of 190-1100 nm, and measure the light absorbance with an accuracy of 0.001 Abs. The operational protocol of the spectrophotometer requires to:
Define the wavelength range to be tested,
Scan a “blank” specimen (ultrapure water) in order to calibrate the device, and
Scan all the tested samples. (use a 3mL specimen)
4.1.2 Nano ZS90 – Zeta-sizer
The device that was used in order to carry over the measurements of particle size and zeta potential that were necessary to further characterize the colloidal
47 suspensions formed by the tested nanoparticles was the Nano ZS90 Zeta-sizer33
(Malvern Instruments, UK) that is shown in Figure 3.2. Particle sizes (diameter) that can be measured range from 0.3 nm to 5.0 µm. Zeta potential can be measured for particles ranging from 3.8 nm to 100 µm (diameter), with an accuracy of 0.12 µm cm/Vs. The operational protocol for the Nano ZS90 Zeta-sizer requires to:
Wash the cuvettes with ethanol,
Fill the size-measurement cuvette up to the appropriate mark, Insert the cuvette in the zeta-sizer and run the measurement, Remove the size-measurement cuvette,
Fill the zeta potential-measurement cuvette appropriately, and Insert the cuvette in the zeta-sizer and run the measurement.
4.1.3 Verilux VT 10 - 5000 lux white UV Lamp
The culture conditions of the test samples were defined in accordance with existing literature, and the samples were stored in an incubator at a constant temperature T=26°C, being subjected to 12h dark:light cycles of white UV light, in order to recreate the ideal growth conditions for the marine diatom Thalassiosira pseudonana. The illumination was provided by the Verilux VT 10 - 5000 lux34
(Verilux, VT) lamp, shown in Figure 3.3, which was regulated by means of a timer that switched it every 12 hours.
4.1.4 OrionTM pH-meter
The pH of the solution needs to be measured at the beginning and at the end of the experiment, as well as whenever zeta potential and particle size measurements are performed, in order to be able to plot the IEP (Isoelectric Point) of the measured nanoparticles and to keep track of possible changes in the sample. The monitoring of ph was achieved using the OrionTM 720Aplus pH-meter 35(Thermo Fisher Scientific,
MA) (Figure 34), in combination with the glass electrode Orion™ 8156BNUWP35
48 4.2 Manufacture of artificial seawater and f/2 medium
Since the same target organism will be used for this study (marine diatom Thalassiosira pseudonana), the realization of ASW and of f/2 medium is the same as the one already covered in Section 3.2
4.3 Nanoparticles
TiO2 nanoparticles were extracted by two commercially available personal care
products: sunscreen (Gardener's Armor™, Cincinnati, OH, 4% TiO2, 4% colloidal
oatmeal) and toothpaste (Colgate-Palmolive company, New York, NY, primary ingredients: 0.24% of sodium fluoride and TiO2 as an inactive ingredient), both
purchased from a local public store (Miami, FL).
The nanoparticles were then extracted from their respective products following the modified version of the protocol developed by Barker et al. (2008)47:
Weight 3 g of product in a Falcon tube, using a precision scale, Add 30 mL of Hexane,
Sonicate for 1 min and centrifuge at 4400 rpm for 5 minutes, Remove Hexane solution and add 30 mL of Ethanol,
Centrifuge at 4400 rpm for 5 minutes, Discard the Ethanol solution,
Add 30 mL of DI (ultrapure) water, shake manually for 2 minutes and then centrifuge at 3000 rpm for 10 minutes, then discard the supernatant; repeat this step two more times, and
Place the open Falcon in the oven for 12 hours at a temperature of 100 °C,
Put the Falcon in the desiccator.
Following the above procedure twice for each product, a sufficient amount of titanium dioxide (in the form of nano-powder) was obtained. In order to further refine the obtained nano-powders, they were grinded in sterilized manual grinders.
49 4.4 Diatom culture
The culture of the marine diatom Thalassiosira pseudonana was realized following the procedure illustrated in Section 3.4, and was preserved under the same environmental conditions: it was incubated at a constant temperature of 26°C, with 12h:12h (dark:light) cycles using the Verilux VT 10 white UV lamp illustrated in Section 3.1.3.
4.5 Experimental setup
In order to perform the designed growth inhibition tests, both the diatom culture and the TiO2 nanoparticles were characterized in terms of absorbance, defining the peak
absorbance wavelength for each of them. In fact, if the peak absorbance wavelengths of diatoms and nanoparticles were too close one to the other (i.e., enough to cause overlapping of absorbance peaks), the absorbance measurement would not have been a reliable indicator, and alternative ways to assess toxicity would have had to be found.
4.5.1 Detection of T. pseudonana peak absorbance wavelength In the present study, several measurements of absorbance were performed on control samples and on samples that were exposed to TiO2 nanoparticles under
designated conditions. Absorbance was chosen as an indirect measurement of growth inhibition: the rationale behind this choice was that, under the condition that nanoparticles and diatoms had different and non-overlapping absorbance peaks, a lower absorbance in a contaminated sample would represent a decrease in diatom growth (i.e., growth inhibition), which has to be ascribed to the exposure to TiO2
nanoparticles, since they are the only modification made with respect to the control sample.
The assessment of the peak absorbance wavelength has been explained in Section 3.5.1. Since this set of experiments used the same diatom (Thalassiosira pseudonana) as its target organism, the same peak absorbance wavelength, λ=674 nm was assumed for Thalassiosira pseudonana.
50 4.5.2 Product-derived nano-TiO2 peak absorbance wavelength
As it was already stated in Section 3.5.2, the peak absorbance wavelength for TiO2 nanoparticles is characterized by a great variability, influenced by multiple
factors.
Since the nano-TiO2 embedded in the toothpaste and sunscreen that were used
this study will most likely differ from many of the titanium dioxide nanoparticles found in literature, it would have been unreasonable to assume a single value existing in literature.
Therefore, the same peak absorbance wavelength that has been used for industrial TiO2 nanoparticles was also used for the product-derived TiO2
nanoparticles, λ=350 nm.
4.5.3 Growth inhibition (%) as a function of exposure time In this set of experiments, all of the tests were performed in triplicate copy, and different test samples were realized for toothpaste-derived TiO2 nanoparticles and
for sunscreen-derived TiO2 nanoparticles. Test samples were prepared by adding 15
mL of colloidal suspension of TiO2 in ASW + f/2 medium to 15 mL of diatom
culture (see Section 3.4 for reference) into a 50 mL Petri dish. The control samples (also triplicate) were prepared by adding 15 mL of ASW + f/2 medium to 15 mL of diatom culture into a 50 mL Petri dish. After having gently mixed each sample, they were tested for absorbance (see section 3.1.1 for operational protocol). After the absorbance measurement, the samples were put in the incubator, under the conditions stated in Section 3.1.4.
Absorbance measurements were repeated at scheduled times: 5h, 12h, 24h, 48h, 72h, and 96h.
The concentration of toothpaste-derived and sunscreen-derived TiO2
51 The pH was measured at the beginning and at the end of the experiment using the pH-meter illustrated in section 3.1.4.
4.5.4 Growth inhibition (%) as a function of concentration In this set of experiments, all of the tests were performed in triplicate copy, and different test samples were realized for toothpaste-derived TiO2 nanoparticles and
for sunscreen-derived TiO2 nanoparticles. Each test sample was made by adding 15
mL of colloidal suspension of TiO2 in ASW + f/2 medium to 15 mL of diatom
culture (see Section 3.4 for reference) into a 50 mL Petri dish. The control samples (also triplicate) were prepared by adding 15 mL of ASW + f/2 medium to 15 mL of diatom culture into a 50 mL Petri dish. After having gently mixed each sample, they were tested for absorbance (see section 3.1.1 for operational protocol). After the absorbance measurement, the samples were put in the incubator, under the conditions stated in Section 3.1.4.
The samples were tested again for absorbance after a fixed elapsed time, t=72h. The concentrations of toothpaste-derived and sunscreen-derived TiO2
nanoparticles that were tested in this experiment were 1.0 mg/L, 2.5 mg/L, and 5.0 mg/L.
The pH was measured at the beginning and at the end of the experiment using the pH-meter illustrated in section 3.1.4.
4.5.5 Monitoring of particle size, zeta potential, and pH
Hydrodynamic particle size and zeta potential were measured at the beginning of the experiment and at time steps of 5h, 12h, 24h, 48h and 72h (the latter was previously assessed to be the break-through time), by using the Nano ZS90 zetasizer illustrated in Section 3.1.2, following the measurement protocol illustrated in the same section.
pH was measured at the beginning of the experiment and at time steps of 5h, 12h, 24h, 48h and 72h (the latter was previously assessed to be the break-through time), by using the OrionTM pH-meter illustrated in Section 3.1.4. The
52 measurements were performed by immersing the glass electrode in the sample, and then waiting for the stabilization before performing the reading of the current pH value.
All of the aforementioned measurements have been performed both on the control sample (see Section 3.5.3 for composition and preparation) and on the diatom cultures exposed to a 5 mg/L concentration of TiO2 nanoparticles.
4.6 Results
4.6.1 Particle size, zeta potential, and pH
The measurements for all of the cultures exposed to 5 mg/L colloidal suspensions of industrial, toothpaste-derived, and sunscreen-derived TiO2
nanoparticles are synthesized in Figure 5.3.
As it can be seen, in the case of toothpaste-derived TiO2 nanoparticles a likely
outliar is present at t=0h; neglecting it, it can be observed that particle size experienced a net increase during the exposure time, going from an initial size of 89 nm to a final size of 114 nm. Again, like in the case of industrial TiO2, the particle
size changed following a non-linear pattern, increasing until t=24h to a peak of 165 nm, and then decreasing sharply.
The surface charge was relatively low immediately after injecting the colloidal suspension, at a value of -4.56 mV. After 12h, however, it increased its absolute value up to -6.98 mV; from that time, it decreased its absolute value, reaching -5.37 mV at t= 48h; the value recorded at t=72h is most likely an outlier.
The measured value of pH decreased slightly and rather linearly during time, going from 8.48 to 7.39.
For sunscreen-derived TiO2 nanoparticles, it can be seen that particle size
experienced a net increase during the exposure time, going from an initial size of 46 nm to a final size of 92 nm. However, the particle size changed following a