ALMA MATER STUDIORUM
UNIVERSITA' DI BOLOGNA
SCUOLA DI SCIENZE
Corso di laurea magistrale in Biologia Marina
Effects of okadaic acid and dinophysistoxins on swimming and
metabolic fitness of marine fish
Tesi di laurea in Botanica Marina Applicata
Relatrice: Presentata da: Prof.ssa Pistocchi Rossella Corriere Mauro
Correlatore:
Dott. Pedro Reis Costa
III sessione
Table of contents
Abstract………7
1. Introduction……….9
1.1. Harmful algal blooms (HABs)………10
1.2. Harmful algal blooms and Climate change……….13
1.3. Marine Biotoxins………...20
1.3.1. Routes of toxin exposure……….20
1.4. Overview on Diarrhetic Shellfish Poisoning (DSP)………...23
1.4.1. Okadaic acid group of toxins……….24
1.5. Okadaic acid in aquatic animals………28
1.5.1. Field observations………..29
1.5.2. Investigation of Okadaic acid effects in fish under controlled conditions………...29
2. Project Purpose……….32
3. Materials and Methods……….33
3.1. PART A. Accumulation and Elimination Dynamics………33
3.1.1. Fish collections………...33
3.1.2. Preparation of contaminated OA diet………...34
3.1.3. Exposure experiments………..35
3.1.4. Toxin extraction and quantification……….36
3.1.5. Model fitting………...36
3.1.6. Statistical analysis………37
3.2. PART B. Swim Tunnel Experiment………..37
3.2.1. Animal conditions……….37
3.2.2. Experimental design……….38
3.2.3. Analysis of Fish Metabolism………41
3.2.4. Toxins evaluation………46
3.2.5. Toxins extraction………...46
3.2.6. Toxins determination (LC-MS/MS)………....47
3.2.7. Statistical analysis………...47
4. Results………49
4.1. Accumulation and Elimination Kinetics………..49
4.2. Results from swim tunnel………....51
4.2.1. Levels of toxins accumulated in exposed fish………..51
4.2.2. Effects of toxin on aerobic capacity and swimming performance52
5. Discussion………..56
6. Conclusions………...61
7
Abstract
Harmful algal blooms (HABs) are natural occurrences that can severely impact marine communities. Depending on the species, they can produce a wide array of toxins, which may elicit devastating effects on marine life. Diarrhetic Shellfish Poisoning (DSP) is a specific type of food poisoning, characterized by severe gastrointestinal illness due to the ingestion of filter feeding bivalves contaminated with a specific suite of toxins such as okadaic acid (OA) and dinophysistoxins (DTXs). OA and DTXs are lipophilic and heat-stable compounds that frequently accumulate in bivalve mollusks along European coasts. It is established that organisms such as bivalves accumulate these toxins in their tissues, mostly in the digestive gland, through their filter feeding behavior acting therefore as a vectors for other organisms such as planktivorous fish. Here, for the first time, the time course of accumulation and elimination of Diarrhetic shellfish toxins (DSTs) in juveniles of Zebra seabream (Diplodus
cervinus) was assessed during an experimental period of 15 days. It was shown
that fish present a high excretion rate and low toxin conversion, in fact no other compounds except for DTX-1 were found. Then fish aerobic metabolism and swimming performance were investigated, exposing individuals to OA group of toxins via dietary route during 3 days, after which fish were challenged with increasing swimming velocity trials using a swim tunnel respirometer. Results show that OA impaired on metabolic performance, assessed both during the standard metabolic rate (SMR) and during the maximum metabolic rate (MMR) as an oxygen consumption increment. Moreover, from critical swimming speed (Ucrit) analysis, significant differences among the two tested groups were observed. In conclusion, these studies show that fish can act temporary as a vector and, although a high elimination rate was found, at the same time toxins ingestion was able to impair their fitness.
8
Keywords: HABs, biotoxins, Okadaic acid, DSP, elimination rate, swim tunnel respirometer, Standard metabolic rate, Maximum metabolic rate, Oxygen
9
1. Introduction
Phytoplankton communities are vital to marine ecosystems. They represent the basis of marine food webs throughout the planet, providing food, for most organisms such as bivalves, planktivorous fish and a great number of vertebrate and invertebrate larval stages.
Over the last decades, countries throughout the world have experienced a worrisome trend in the incidence of problems known as “harmful algal blooms” (HABs). HAB events are natural phenomena characterized by the proliferation and occasional dominance of particular species of harmful or toxic algae (Anderson 2007).
The presence of specific adaptive strategies and appropriate chemical-physical conditions allows to species to reach high numbers. In some cases, these microscopic cells increase in abundance and this explosion of algal biomass brings advantages for the whole ecosystem, increasing feeding opportunities for countless organisms.
On the other hand, if individuals reproduce and become the dominant element in the ecological community in few days, reaching high numbers of cells per liter, repercussions on the ecosystem are unavoidable.
In fact, this increase can provoke damage to the aquatic fauna due to the formation of anoxic environments, creating an anoxic barrier between the surface and deeper waters and impacting on coastal recreational activities with discoloration of water, mucus and unpleasant smells production (Granéli & Turner, 2006).
In other cases, there are blooms of species which do not reach high cell concentrations and which do not discolor the surface, but at the same time cause harm, typically through the production of potent toxins.
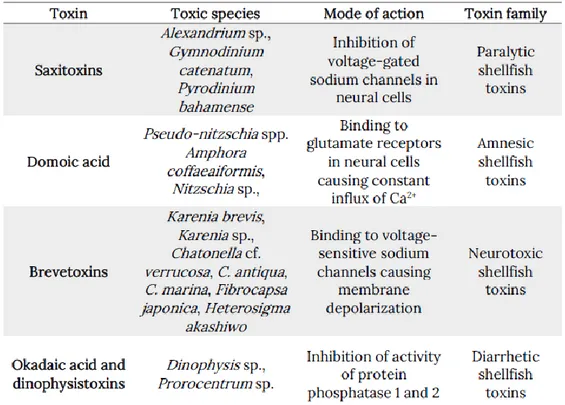
Out of 5000 species of phytoplankton presently known, approximately the 2% produce toxins and significantly impact marine communities (Hallegraeff,
10
2014). Mainly belonging to the dinoflagellate taxa, these organisms can produce toxic events even when their concentration is not relatively high, resulting especially hazardous for human health and marine ecosystem. Biochemically, bio-toxins are secondary metabolites that can have a wide range of effects (Table 1). They can act on the nervous system, which can induce permanent short-term memory loss (domoic acid) or cause sensorimotor impairment, leading to death (paralytic shellfish toxins) or act on the digestive tract, inducing gastrointestinal distress. During the last two decades several new toxins and new
toxin derivatives, such as gymnodimines,azaspiracids, pterotoxins, pinnatoxins,
ovatoxins, hydroxybenzoate saxitoxin, okadaic and domoic acid analogues have been described, mostly due to scientific and technological advances (Cruz et al., 2006; Miles et al., 2000; Negri et al., 2003; Takada et al., 2000).
Changes on global climate conditions and anthropogenic pressures have been causing several tropical and subtropical endemic HAB-toxins, namely ciguatoxins, palytoxins and brevetoxins, to expand geographical range into temperate waters (Botana et al., 2015; Villareal et al., 2007).
1.1 Harmful algal blooms (HABs)
Andersen (1996) classified blooms depending on the effects produced:
Blooms of species which produce basically harmless water discolorations (es. Noctiluca scintillans or Skeletonema costatum), with the result that the recreational value of the bloom area decreases due to low visibility of the water and eventually, under exceptionally weather conditions in sheltered bays, the blooms can grow so dense that they cause escape reactions and indiscriminate fish kills and kills of benthic invertebrates due to oxygen depletion.
11
Blooms of species which produce potent toxins which accumulate in food chains and cause a variety of gastrointestinal and neurological illnesses in humans and other organisms such as fish, marine mammals and seabirds.
Blooms of species which in most cases are non-toxic to humans but harmful to fish and invertebrates, especially in intensive aquaculture systems, e.g. by intoxication, damaging or clogging of the gills or other means (es. Alexandrium tamarense, Prymnesium parvum, Chattonella
antiqua and Nodularia spumigena).
Blooms of species which produces toxins which are toxic to humans and which are transported by air in aerosols from the bloom area to the coast.
Table 1: The most common toxins produced by marine phytoplankton.
However, the term “harmful algal bloom” is very broad and covers many types of blooms, but HABs all have one unique feature in common; they cause harm,
12
either due to their production of toxins or to the manner in which the cell’s physical structure or accumulated biomass affect co-occurring organisms and alter food web dynamics (Andersen 2007).
Several decades ago, relatively few countries were affected by HABs.
Since the ‘70-‘80 most coastal countries are threatened, in many cases over large geographic areas and by more than one harmful or toxic species (Anderson 1989; Hallegraeff 1993; Grattan et al., 2016).
The causes behind this expansion are debated, with possible explanations ranging from natural mechanisms of species dispersal and enhancement (e.g., climate change) to a host of human-related phenomena such as pollution-related nutrient enrichment, climatic shifts, and transport of algal species via ship ballast water (Anderson 1989; Hallegraeff 1993; Hallegraeff 2010).
Whatever the reasons, coastal regions throughout the world are now subjected to an unprecedented increase of HABs events in terms of number, frequency, duration and intensity.
Until now, many countries are faced with a remarkable array of toxic or harmful species, sometimes these are geographic areas never affected before or which are affected in larger proportion. Such coastal areas face the ever - increasing impacts on human activity such as fisheries and aquaculture resources, and the resulting economic losses.
13
1.2 Harmful algal blooms and climate change
As suggested before, the warming of the global system is considered to this day unequivocal, resulting in decadal climatic shifts and unprecedented changes in overall weather characteristics.
There is increasing concern that this shifting will cause changes in phytoplankton community structure and composition, including a greater prevalence and geographical spread of HABs, even if the anticipated linkages with climate change are founded on limited and often conflicting experimental and observational data.
Current spatial and temporal ranges of HABs will most certainly change under future climate scenarios. Spatially, it would be normal to expect that the geographic ranges of species may expand, contract, or just shift with latitude. On the other hand, the seasonal windows for growth will also contract and expand in terms of time. Thus successful invasions of new HABs will depend fundamentally on the species ‘‘getting there’’, through spatial transport, ‘‘being there’’ as indigenous species that potentially can grow in abundance within the phytoplankton community, and ‘‘staying there’’ by persistence through unfavorable conditions such as high temperature and nutrient depletion (Wells et al., 2015).
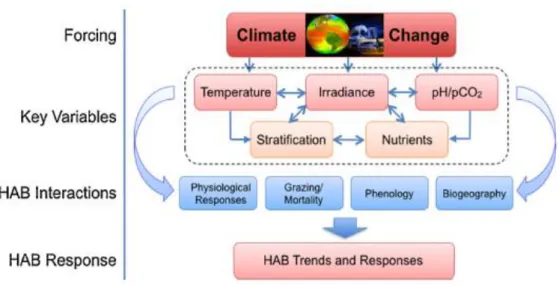
A focus on this progression of climate change pressure on key variables and related HABs interactions that will drive HABs responses (Fig.1) in the future ocean is hereby presented:
14
Figure 1: The progression of climate change pressure on key variables and related HAB interactions that will drive HAB responses in the future ocean (Wells et al., 2015).
1-Temperature:
Temperature is considered one of the main environmental drivers affecting physiological processes in phytoplankton expected to change with climate.
Increases in atmospheric and surface water temperature will be accompanied by altered seasonal patterns (e.g., longer summertime or shifts in the timing of spring -autumn). These changes extend the ‘‘windows of opportunity’’ for growth and germination affecting phytoplankton population dynamics in temperate and boreal habitats. At the same time, increased temperature may narrow “growth windows” of HAB species in sub-tropical/tropical waters if temperature optima are exceeded. The biogeography of phytoplankton species is therefore determined in large part by temperature regimes even if HABs can show strong intraspecific differences in temperature tolerance and responses. All species in fact, have a temperature niche described by optimal, lethal and tolerable water temperatures at which cells do not grow well, but can survive. Usually there is a mismatch between optimal growth rate temperatures for
15
species in culture and those at which these species occur in natural systems. Moreover, there are genetic differences among isolates that may reflect their adaptive strategies to different regions. Some non-toxic species differ from toxic species within the same genus in their temperature–growth relationship, but in most cases, specific information about differences between HAB and non-HAB species is lacking.
For example, various cyanobacterial species respond differently than other groups to temperature changes even if there are differences in temperature tolerance among toxic and non-toxic cyanobacteria within the same species. The dinoflagellate Gambierdiscus toxicus is known to generally prefer warmer conditions, in fact an increment in the related biointoxication, ciguatera fish poisoning, has been observed with elevated sea surface temperatures related to El Nino Southern Oscillation (ENSO) (Rongo and van Woesik, 2011).
It has been observed that temperature may also influence the chemical composition of a species.
While higher toxin accumulation can occur with slowing growth, in some species toxin production and temperature appear to be directly linked (Guerrini et al., 2007).
2-Stratification:
The ocean surface is anticipated to become generally more stratified with increasing global temperature, glacial melting and precipitation runoff (Grattan et al., 2016; Hallegraeff, 2010). Based on future global biomass and productivity projections, it is likely that mid- and high-latitude regions will be most strongly impacted by changes in stratification; while changes at low-latitude tropical systems will be relatively minor. However species respond to local and regional changes, not to global patterns, and the manifested effects will incorporate changes in wind stress (leading to changes in turbulence), local
16
hydrography, depth and intensity of the pycnocline, relative contribution of upwelled nutrients versus runoff as well as changes in nutrient ratios, and indirect changes in subsurface irradiance.
Perhaps the most obvious effect of increased stratification on phytoplankton, and therefore HABs organisms, will be the changing patterns of nutrient availability.
These altered seasonal patterns may extend the ‘‘window of opportunity’’ for some HABs, particularly chain-forming dinoflagellates that take advantage of strong thermal stratification with higher nutrient concentrations at relatively shallow depths.
3-Nutrient:
Microalgae growth requires micronutrients, vitamins, chelators, and macronutrients, such as nitrogen and phosphorus. In seawater, the concentrations of nitrogen and phosphorus may not support the demand of the algae, because their concentrations can vary with time under dynamic conditions. The growth rates, maximum cell densities, and cellular toxin levels of the algal cells may be affected by multi-nutrient interactions and the complex composition of the culturing media. However, information on the effect of these interactions and the composition is scant.Nitrogen (N) in particular, is involved in the synthesis of different essential cellular components, such as proteins and chlorophyll but also affects the growth rate, maximum cell density, and toxin production in algal cells (Lee et al., 2016).
The most common approach to study this core ecological principle is to quantify the presence or flux of dissolved forms of nitrogen, phosphorus, and silicon, or trace nutrients such as iron and vitamins, and then to seek correlations with the competitive outcomes among species (e.g., nutrient preferences, nutrient affinities). The most common metrics for measuring HABs success are biomass
17
accumulation (i.e., assimilation of a large portion of the nutrient pool), or changes in the levels of ecologically- or socially-important compounds (e.g., allelochemicals, food chain toxins) (Wells et al., 2015).
The importance of nutrient supply-changes is, without question, critically important in community development, yet the complexity of response of individual species and their subsequent competitive or adversarial activities (allelopathy, mixotrophy) remains elusive (Smayda, 1998). A well stratified surface water provides a common environment of enhanced nutrient regeneration, and comparative studies generally show that these conditions favor flagellate dominance. Flagellates can flourish under long periods of low nutrient concentrations where reduced forms of nitrogen (e.g., ammonium) comprise a large proportion of the available N pool. This does not mean that all flagellates prefer reduced nitrogen forms—only that reduced forms tend to dominate when ambient N concentrations are low (Maguer et al., 2007; Anderson et al., 2012). Indeed some HABs appear to favor greater ambient (i.e., non- reduced) nutrient conditions, due perhaps to higher physiological quota requirements; e.g.,
Alexandrium spp. and Prorocentrum spp.
The relative supply rates of N and P to surface waters can significantly impact the physiology and dynamics of the phytoplankton community, as well as the community composition. But this ratio is of most use in interpreting succession and resultant community composition only when either the ambient N or P concentrations are low. When there is an abundance of both, or when nutrients are not limiting phytoplankton growth, there is no compelling evidence that N: P ratios provide a predictive value for the floristic composition of the phytoplankton community and the likelihood of HAB development (Wells et al., 2015).
However climate change will affect nutrient flux to surface waters, through alteration in vertical mixing and runoff, and the challenge will be to incorporate
18
quantitative measures of nutrient acquisition among HAB and non-HAB species, along with the effects of strain variability, to forecast likely outcomes.
4-Other factors:
Ocean acidification
Progressively increasing ocean acidification has the potential to alter many aspects of phytoplankton physiology. The two proximal effects of ocean acidification on cell physiology will result from increased pCO2 (reducing the value and costs for carbon concentrating mechanisms) and potentially altered transmembrane proton gradients (with impacts on ion transport and ion-channel activities). More distal effects include altered micronutrient chemistries with likely impacts on their bioavailability. Both will exert selective pressure on phytoplankton community composition, but how these might alter the competitive success of HAB species is unknown. More than any other climate-associated stress factor discussed here, small methodological differences among okadaic acid studies have the potential to alter experimental findings dramatically, so it is critical that well-defined and uniform methods be adopted (Wells et al., 2015).
Grazing
Considerable research has been done to understand how light, nutrients and biological–physical interactions affect the amount of phytoplankton available to fuel marine food webs, often referred to as ‘‘bottom-up’’ controls. The role of loss processes that can assert ‘‘top-down’’ controls on phytoplankton biomass and community structure are less well understood in marine planktonic systems. However these top-down controls include viral lysis, algicidal bacteria, sinking out of the photic zone and other mortality sources, but the major top-down control is thought to be through grazing (Buskey, 2008).
19
The prevailing conceptual view is that HAB species are grazed, their blooms develop when the population growth rate exceeds grazing rate, and phycotoxins allelochemically protect against grazers. But the ultimate predator–prey interactions occur at the organismal level, and the experimental results, primarily with copepod species, indicate that those concepts are conditional. The physiological and ecological effects on copepods that graze on toxic species and their growth and bloom responses vary greatly. Copepod species generally feed on a variety of HAB species, selecting preys based on their cell size and toxicity, with the latter selection mode indicative of highly sensitive and specific chemoreceptive abilities. Ingestion of toxic prey can adversely affect predator grazing rate, fecundity, egg hatching success, growth, survival, and incapacitate or cause death of the grazer. At the same time, some copepod species actively graze, grow and reproduce without deleterious effect; Some copepod species actively graze, grow and reproduce on HAB preys without deleterious effects; conversely, they can reject non toxic species, and a species which is toxic or avoided by one species can be grazed by another species.
Hence, the availability of alternative prey influence grazing rates on HAB species, with the intensity of grazing being a function of the inherent toxicity of each prey species and the magnitude of toxicity induced by nutrient-limitation. The presence of a toxic species can reduce feeding rates on all species. There is the possibility that all these interactions may shift if climate change pressures lead to changes in the toxicity or nutritional quality of the HAB preys (Wells et al., 2015).
20
1.3 Marine biotoxins
Marine bio-toxins are a heterogeneous group of chemical compounds produced by living organisms capable to provoke, even at low concentration, harmful physiological manifestations in most of living organisms.
Biochemically, bio-toxins are secondary metabolites having very complex structures. They present from very low to very high molecular weights and have a strictly hydrophilic or lipophilic behavior based on the polarity of the molecule.
In the last decades, it has been observed how these compounds can affect marine life with repercussion especially in human populations, inducing a series of pathological clinical frameworks such as on gastrointestinal system either after consumption of fisheries products (raw, cooked or processed), through the respiratory system (marine aerosol, spray) or through the skin after bathing activity.
Seafood consumption has become the leading cause of food-borne illness; in fact it is responsible for 10–20% of outbreaks and about 5% of all individual illnesses among all food types (Grattan et al., 2016).
But, how this contamination is achieved?
1.3.1 Routes of toxin exposure
The exposure pathway of aquatic animals to marine toxins depends essentially by three factors: the ecology of the toxin producer (e.g., pelagic or epibenthic), the environmental conditions at the time of the bloom and the probability of the organisms to become in contact with the toxin.
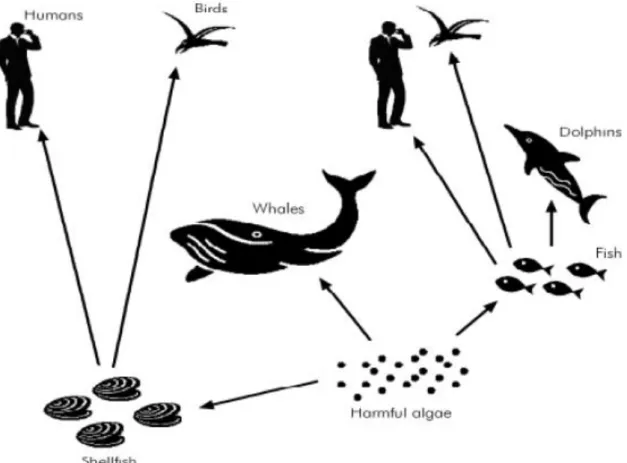
Toxin transfer in fact can be foodborne or waterborne. Toxicity can manifest itself along the food web or from the toxins dissolved in the water after the excretion or cell release (Fig. 2).
21
Figure 2: Harmful algal blooms along the trophic chain and relatives routes of dietary exposure.
Through ingestion of toxic phytoplankton cells by filter-feeding organisms, such as bivalve mollusks, zooplankton and planktivorous fish, the toxins present inside the cells can accumulate in the predator’s viscera.
This can create a chain of vectors throughout the food web, potentially eliciting adverse effects in marine communities, reaching in this way the top predators. Depending by the vector, these toxins can be transferred to humans and cause a variety of shellfish poisonings, due to the ingestion of contaminated shellfish, such as Paralytic Shellfish Poisoning (PSP), Amnesic Shellfish Poisoning (ASP), Diarrhetic shellfish poisoning (DSP) and Neurotoxic shellfish poisoning (NSP).
22
Filter- feeding organisms such as mollusks has been considered the most common bio-intoxication vectors for humans. They eliminate part of the toxins ingested together with the water through their excretory apparatus, but a discrete quantity remains in their body, especially when the accumulation is rapid and the toxin producers are abundant.
Instead, ciguatera fish poisoning (CFP) is considered the most common foodborne illness related to finfish consumption in the world. Macroalgal epiphytes belonging to certain species and strains of the dinoflagellate
Gambierdiscus produce liphophilic neurotoxin (ciguatoxins and gambiertoxins)
that, through bioaccumulation and magnification, advance in the food web starting from herbivorous-omnivorous fishes during grazing, until they reach piscivores species and humans after their consumption (Grattan et al., 2016; Catania et al., 2017).
Waterborne exposure may result from toxin release into the water column due to cell lysis during bloom senescence, causing other organisms to come inadvertently in contact with these compounds.
The persistence of the toxin in the water depends on the physical and chemical properties of seawater, as well as on the volume of water where the toxin has been released, i.e., larger volumes of water tend to dilute the toxin and reduce significantly the risk of contamination. Similarly, when the bloom becomes senescent or when seawater properties are no longer optimal for cell growth, microalgae die and, as their cells lyse, the toxins within the cells are released to the surrounding environment (Lopes et al., 2018).
However, the amount of toxin accumulated in the organism’s system is essentially dependent on: the solubility (hydrophilic or lypophilic) of a given toxin, the capability of the organism to excrete/detoxify it effectively; and the organism’s physiological tolerance.
23
1.4 Overview on Diarrhetic Shellfish Poisoning (DSP)
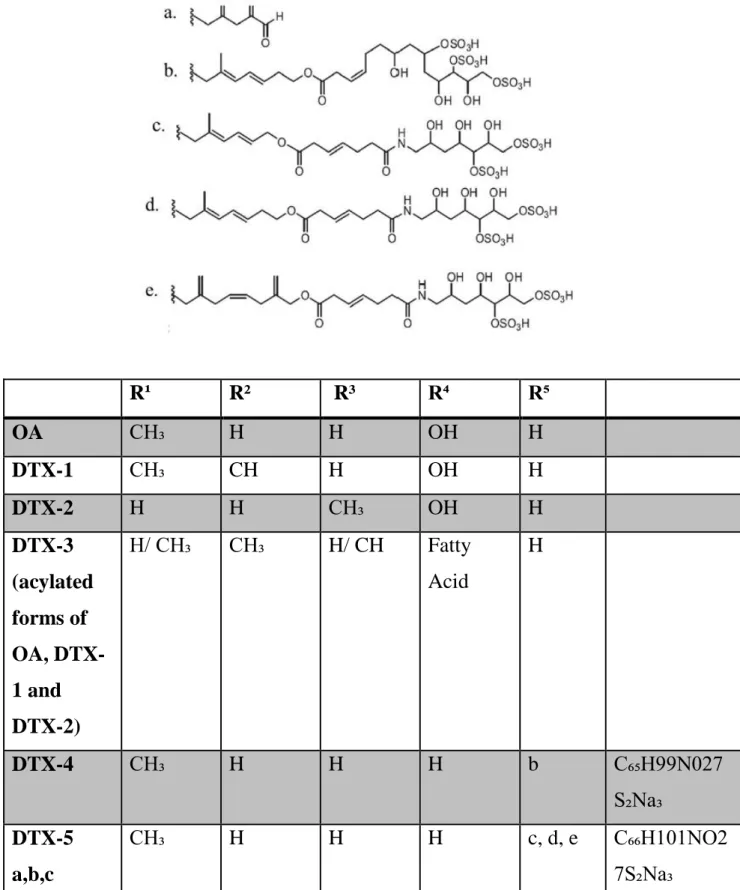
One of the most studied marine toxins is Okadaic acid (OA) and its analogs, the dinophysistoxins (DTXs, Figure 3), lipophilic and heat-stable polyether compounds responsible for Diarrhetic Shellfish Poisoning (DSP).
DSP is a human foodborne illness characterized by gastrointestinal disorders with acute symptoms including diarrhea, nausea, abdominal pain and vomiting which may arise after consumption of contaminated bivalve mollusks such as mussels, scallops, oysters or clams, i.e. the most common vectors for DSP toxins. These are produced by a community of dinoflagellates, most notably,
Dinophysis spp and Prorocentrum spp(EFSA 2008; Braga et al., 2016).
The earliest clinical report of a gastrointestinal illness associated with consumption of cooked mussels came from the Netherlands in 1961, but the causative agent was not identified (Reguera et al., 2014). It was not until the late 1970s that a syndrome, Diarrhoetic Shellfish Poisoning (DSP), was described after severe gastrointestinal outbreaks occurred, in 1976 and 1977, among mussel (Mytilus edulis) and scallop (Patinopecten yessoensis) consumers in Miyagi, Aomori and Tohoku prefectures, Northeast Japan (Reguera et al., 2014). Between 1976 and 1982, some 1300 DSP cases were reported in Japan, in 1981 more than 5000 cases were reported in Spain, and in 1983 some 3300 cases were reported in France (Hallegraeff 1993).
In Italy, it began to appear in 1989, when there were 100 cases of diarrheal disorders in mussel consumers, affecting mainly the coastline of Emilia Romagna, but also the coasts of Veneto, Friuli Venezia Giulia, Marche and Abruzzo.
There was circumstantial evidence in the 80’s for the association of DSP toxicity with Dinophysis spp. in USA where very high levels of OA were found in scallops (Placopecten magellanicus) in Rhode Island, Nova Scotia and Canada (Reguera et al., 2014).The responsible organisms (Dinophysis spp) also have
24
been identified in Texas Gulf coastal waters and oysters in that region reportedly tested positive for OA. High concentrations of diarrhetic shellfish toxins recently have been measured for the first time in New York shellfish (Hattenrath-Lehmann et al., 2013), suggesting that a ‘‘tipping point’’ was exceeded across the U.S., allowing these toxins to affect several coastal regions that historically have not been impacted by them.
Based on their structures, DSP toxins were initially classified into three groups: OA/DTX analogues, pectenotoxins (PTXs), and yessotoxins (YTXs).
OA and DTXs have been shown to be potent phosphatase inhibitors, a property that can cause inflammation of the intestinal tract and diarrhea.
Several toxicological studies about PTXs and YTXs evidenced that symptoms of intoxication produced in humans are relatively unknown due to the fact that no human intoxication has been reported to date, while animal studies indicated that PTXs and YTXs are much less toxic via the oral route and that they do not induce diarrhea (Suzuki and Quilliam 2011). Since 2002 these molecules were not considered DSP toxins anymore because they have different chemical structure and mode of action; these toxins lead to liver necrosis and cardiac muscle damage without diarrhea symptoms (Lee et al., 2016).
1.4.1 Okadaic acid group of toxins
Currently, OA and its derivates are truly associated to DSP syndrome.
Discovered and described in 1981 from the black sponge Halichondria okadai, as well as from H. melanodocia, OA and its related toxins are produced by several planktonic species of dinoflagellates belonging to the genus Dinophysis such as Dinophysis acuminata, D. acuta, D. rotundata, D. fortii , D. norvegica,
D. sacculus, D. caudata.
There are a few reports in which the presence of OA in bivalves has been associated with epibenthic dinoflagellates of the genus Prorocentrum spp. These
25
may, at times, contribute to the accumulation of DSP toxins in shellfish from shallow coastal embayments or in aquaculture sites with high turbulence, where benthic microalgae are easily re-suspended in the water column and become available to filter-feeders in significant amounts (Reguera et al., 2014).
OA (C₄₄H₆₈O₁₃) is a polyether molecule with a molecular weight of 804.46, soluble in chloroform, ethanol, methanol, acetone and ethylacetate, not soluble in water (EFSA, 2008). It is known as an inhibitor of serine/threonine phosphoprotein phosphatase 1 and 2A (PP1 and PP2A) activities, two of the four main classes of enzymes (PP1, PP2A, PP2B, PP2C) which act by dephosphorylating serine / threonine residues of proteins and act as modulators of protein kinases in eukaryotic cells (Hanana et al.,2012).
The action of PP1 and PP2A represents 90% of the activity of phosphatase proteins in the cell (Cohen 1989); they participate in many cellular processes such as cellular division, cell differentiation, neuronal activity, muscle contraction and metabolic functions.
However, this property is not unique of OA; most OA group toxins in fact have shown the ability to inhibit some PP to a greater or lesser extent. OA, DTX-1 and DTX-2 have all been demonstrated to be potent inhibitors of both PP1 and PP2A, with a significantly higher affinity for PP2A (Valdiglesias et al., 2013). However, this toxin is also considered more than a simple diarrheic agent, exerting a role far beyond the induction of gastrointestinal disorders, and including cytotoxic, neurotoxic, immunotoxic, carcinotoxic and genotoxic effects (Valdiglesias et al., 2013).
Structurally, OA and DTXs are polyketide compounds containing furane and pyrane-type ether rings and an alpha-hydroxycarboxyl function, which differs between them only in the number or position of the methyl group (Dominguez et al., 2010; Rossignoli et al., 2010).
DTX-1 is a 35-methyl-okadaic acid, while the DTX-2 has only one methyl in position C35 (R3) (Marr et al., 1992).
26
However, a number of naturally occurring derivatives of OA and DTX toxins were observed in dinoflagellates and bivalves. They can be, on the basis of the chemical structure, divided in two different groups.
The first is defined as “OA diol-esters” in which the carboxyl group of OA is conjugated to several different unsaturated C7 to C9 diols to form allylic diol-esters while the second group is a complex mixture of 7-O-acyl ester derivatives of OA, DTX-1 and DTX-2 (also known as the DTX-3 complex) (Fig. 3).
When these compounds enter bivalves they undergo a series of transformations, mainly hydrolysis and acylation (Rossignoli et al., 2011). OA/DTX toxins are often transformed to fatty acid esters (collectively known as DTX-3), and these frequently comprise more than half the total OA/DTX in mussels that have consumed toxic dinoflagellates (Nielsen et al., 2016).
From esterification of the diol-esters with sulphated chains DTX-4 and DTX-5 a-b-c derivatives are produced. DTX-4 and DTX-5 are hydrosoluble and rapidly hydrolised to produce OA (Hu et al., 1995).
However, in various shellfish species, OA esterification is an important step in the depuration of this toxin and this process takes place inside the cells of the digestive gland by the action of acyltransferases associated to the endoplasmic reticulum (Rossignoli et al., 2011).
27
Figure 3: Chemical structure of the main DSP toxins: Okadaic acid and its derivatives (Chun-Hung Lee et al., 2016).
R¹ R² R³ R⁴ R⁵ OA CH₃ H H OH H DTX-1 CH₃ CH H OH H DTX-2 H H CH₃ OH H DTX-3 (acylated forms of OA, DTX-1 and DTX-2) H/ CH₃ CH₃ H/ CH Fatty Acid H DTX-4 CH₃ H H H b C₆₅H99N027 S₂Na₃ DTX-5 a,b,c CH₃ H H H c, d, e C₆₆H101NO2 7S₂Na₃
28
1.5 Okadaic acid in aquatic animals
Small pelagic fish, such as sardines and anchovies, which are also planktivorous filter-feeders have been previously identified as vectors of marine biotoxins in the trophic chain during the blooms of toxic algae (Lefebvre et al 2012, Costa and Garrido 2014). Indeed, several poisoning outbreaks with massive mortalities of marine top predators, such as marine mammals and seabirds, have been reported worldwide after ingestion of small pelagic fish containing high levels of marine biotoxins (Costa 2016). However, fish may be exposed to marine toxins due to intense feeding on bivalves harboring large amounts of HAB-toxins. Okadaic acid - group of toxins are the most abundant and frequent group of toxins in EU waters (EFSA 2008). These toxins accumulate to great extent in mussels, reaching frequently high concentrations and remaining accumulated in tissues of this shellfish species for long periods of time (Vale et al., 2008; Rossignoli et al., 2011). Shellfish in fact can convert toxins into less toxic compounds or magnify their toxicity (Landsberg 2002).
While the effects and accumulation/elimination dynamics of PSP and ASP toxins in fish have been investigated before (Lefebvre et al 2012, Costa 2016), mostly due to their neurotoxic properties, little is known about the effects of DSP toxins such as Okadaic acid in fish.
In addition to their role far beyond DSP inducer (Valdiglesias et al., 2013), OA has also been considered a key molecule with high potential impact on the biology of aquatic animals, including effects on fitness and dependent functions of fishes (Ajuzie 2008; Le Du et al., 2017).
A summary of the available data on bioaccumulation of DSPs in marine fish and their toxic effects and impacts is hereby presented.
29 1.5.1 Field observations
The first observation in marine fishes dates back to 1996 in the northern Baltic Sea. Flounders (Platichthys jlesus) collected in the Gulf of Finland during August shown in their livers OA after a Dinophysis acuminata bloom, occurred in concentrations of 520-1960 cells L-1. Caught at depths between 6 and 20 meters, flounders showed a concentration in the liver of 222 ± 10 ng OA g-1 (Sipia et al., 2000).
In 2016, along the southern coast of Brazil, moderate OA levels in the viscera of combtooth blenny, Hypleurochilus fissicornis, during a Dinophysis blooms was recorded. Dinophysis species found included D. acuminata, D. ovum and D.
caudata and during the bloom the maximum dinoflagellate cell density, the OA
cellular quota, as measured from individually-picked cells of the D. acuminata complex, ranged from 48 ± 31 SD pg.cells-1 on 2 June to 143 ±93 pg.cell-1 on 3 June.
Fish remained contaminated for short periods, in particular during the mid-bloom period, accumulating 56.2 µg kg-1 of its free form (Alves and Mafra, 2018). Another recent study reported, even if at low levels (44 ng g-1), OA in a pool of liver and digestive tract tissues from the filter-feeder fish Cetengraulis edentulus in Paranaguá Bay (Mafra et al., 2014).
1.5.2 Investigation of OA effects in fish under controlled conditions
Ajuzie (2008) has shown that OA exposure on sea bass Dicentrarchus labrax juveniles can affect their survival, assuming that fish’s behavior can be altered by toxic algae and impact on body organs.
From histological examinations of kidney, stomach and intestinal tissues of fish, directly or indirectly exposed to P. lima showed no alterations, instead gill and liver tissues were highly impacted.
30
Moreover, they noticed fish in contact with the cell free medium of P. lima, repeatedly jumped out of the medium into the air. Enough oxygen was not passing over the gills of fish due to the high viscosity of the cell-free medium. Gill swellings and the separation of lamellar epithelia from the gill vessels could have affected gaseous exchange and the appearance overwhelmingly of secreted mucus covered the respiratory epithelium of the primary and secondary gill lamellae causing the aorta blood to become hypoxic, triggering a cascade of events that can disrupt the normal metabolic systems of fish and cause their death.
Results shown that P. lima caused fatal degeneration in liver architecture. Hydropic degeneration, hypertrophy, and dissociation of the hepatocytes may have led to the dissolution of the parenchymal architecture, loss of tissue integrity and functions.
Le Du et al., 2017 explored the impact of dissolved DSP toxin in Seriola
rivoliana, another fish with a high commercial value, to understand mainly the
global toxic effect in hatching percentage and secondly the effects at molecular levels thought phosphatase enzyme activities measure. Exposing the eggs to two different concentrations, one low, 120 µg L -1, and one high, 175 µg L-1 of OA, the results showed very strong toxicity to embryos, with mortality from 60 % to 100 % between the 2 treatments.
Other embryotoxic effect was detected in medaka fish Oryzias latipes embryos which were incubated in a medium containing OA and a retardation of embryo development was observed reducing survival rate, up to 100%, depending on the dose (Escoffier et al., 2007).
Souid et al., 2018 demonstrated if oxidative damage could be relevant for OA toxicity on aquatic animals, in one of the most important fish species in the food web of Mediterranean coast with economical value, like Sparus aurata. Using the analysis of individual antioxidant enzymes such as Catalase activity (CAT),
31
Glutathione level (GSH) and the assessment of the accumulation of lipid peroxidation product malondialdehyde (MDA) in liver tissue of Sparus aurata, they found that the highest activity of CAT and GSH was noticed after an exposition of 24 hours. Also a severe lipid peroxidation took place after 24 hours observed as increased levels of MDA. Measurement of MDA as an end product of lipid peroxidation is widely used as a simple and reliable approach to evaluate the ROS induced lipid peroxidation.
From histological observations the most pronounced histopathological changes in the liver were observed after 24 h of OA exposure, corresponding to capillary hyperemia, vascular dilation, alteration in the size of the hepatocyte and visible hepatocellular membrane disintegration. From gills histopathology many histological changes reached the maximum of lesions frequency after 24 h of exposure to the toxin, where hypertrophy was observed in the secondary lamellae with the enlargement of the tissues and a fusion of the primary lamella, dealing with a necrotic alteration.
Fladmark (1998) revealed as salmon hepatocytes appeared to have higher sensitivity towards algal toxins, in particular for OA and DTX-1 which were 10 times more potent as apoptosis inducer and aggregation inhibitor for salmon. The surface of salmon hepatocytes that were exposed to OA altered its properties by loosing microvilli and displaying surface buds. Thus at cytotoxic level, this means that salmon has not evolved any special intracellular resistance towards common marine toxins.
32
2. Project purpose
The study here reported had the purpose to focus on one of the most important marine bio-toxins, belong to the group of DSP toxins, in particular the polyether Okadaic Acid (OA), which is very abundant and frequent in most European waters.
The aim was to investigate a subject poorly studied such as the responses of fish in consequences of the exposition to this toxin. Experimentation has been divided into two different phases, carried out in two different periods.
Firstly, the kinetics of OA uptake by fish was evaluated, by administering toxic food to juveniles of Diplodus cervinus in order to evaluate and quantify, during a period of 15 days, how much toxin was accumulated; other experiments were aimed at understanding if the toxin could be chemically transformed and, finally, it was calculated the elimination’s rate by marine organisms such as fish as data available in the literature are very scarce.
This species was selected as a suitable biological model since it generally inhabits coastal areas particularly susceptible to hydrographic changes and where climate change effects may certainly pose greater ecological and toxicological challenges. Additionally, this seabream species plays an important role in the coastal food web, since they link top predators with species occupying low trophic levels.
Subsequently, once the possible uptake, transformation and elimination rates have been ascertained, another aim was to observe the impacts that OAs may exert on fish fitness. During this step, the presence of possible negative effects was evaluated by analyzing an aspect of fundamental importance for all organisms, such as the respiratory metabolism.
33
3. Materials and methods
Experimental evaluations about the possible effects of the biotoxin were performed at Guia Marine Laboratory (LMG-CO), a research sub-unit of the Centro de Oceanografia (CO), Faculty of Sciences of the University of Lisbon (FCUL), located at Cascais. The main research lines in LMG-CO focus on marine ecology and physiology, integrated coastal management and marine cultures. Every single tool used during the experiments belong to this laboratory while every single procedure, from toxin’s manipulation to analysis of contaminated samples post experiment, have been carried out at IPMA (Portuguese Institute of the Sea and Atmosphere), placed in Lisbon.
3.1.
Part A – Accumulation and Elimination Dynamics
3.1.1. Fish collection
Sixty-six specimens of juvenile zebra seabream (Diplodus cervinus) ranging from 17 to 31 g weight were obtained from CRIPSul–IPMA (Centro Regional de Investigação Pesqueira do Sul–Instituto Português do Mar e da Atmosfera, Olhão, Portugal) and transferred to the aquaculture facilities of Laboratorio Maritimo da Guia (Cascais).
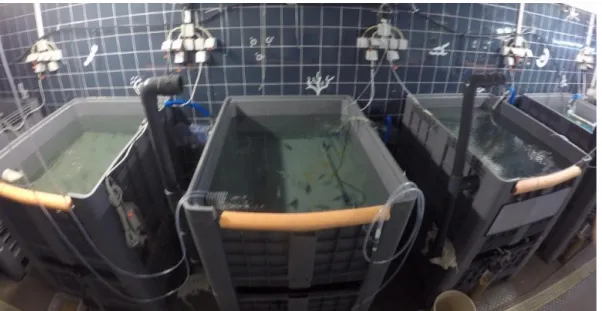
Upon arrival, fish were placed in three separated tanks (270 L) in order to obtain twenty-two fish for each (Fig 4). Tanks placed in parallel were equipped with a wet-dry filter with bio balls (assuring biological filtration) and one 36 W ultraviolet sterilizer. The tanks were illuminated from above with a photoperiod of 14h L: 10h D.
34
Figure 4: Fish (n=66) assigned in the 3 tanks (270 L) were housed for a brief acclimation period, before to start the experiment based on two different diet and asses the toxin kinetic dynamic.
Abiotic conditions were monitored every two days in each tanks using a multi-parameter measuring instrument (Multi 3420 SET G, WTW, Germany) until the end of experiments with the following range of values: temperature = 24.5 ± 0.25 °C, pH= 8 ± 0.07, salinity= 33 ± 4 ‰ for the first tank, temperature = 23 ± 0.80 °C, pH= 8.1 ± 0.04, salinity= 35 ± 2 ‰ for the second tank and temperature = 23.5 ± 0.3 °C, pH= 7.9 ± 0.04, salinity= 34 ± 2.9 ‰ for the last one. Also ammonia, nitrite levels were checked every two day and maintained below 2.0 mg L−1.
3.1.2. Preparation of OA contaminated diet
Food was based on a diet for European Seabass (Dicentrarchus labrax), composed by 430 g fishmeal, 20 g fish oil, 45 g maize starch and 5 g sodium alginate, characterized by the following percentage: 40% protein, 40% lipid and 20% carbohydrate (600-800Kcal).
35
The contaminated feed was prepared with lyophilized Prorocentrum lima
culture containing a toxin concentration of 1000 µg OA eq kg-1, and composed
by approximately 74 % OA and 26% DTX1.
The daily ratio of food for each tank was calculated by multiplying fish’s number, the mean weight (25 g) and the 5% of body mass.
3.1.3.
Exposure experiments
Being the animals derived from aquaculture facilities it was not necessary to withdraw some individuals from each tanks, as control group, to check a possible toxin contamination. The experiment was conducted along fifteen days, divided in two main phases. After a couple of days of acclimation in the three tanks, during the first five days (uptake period) fish were fed with the toxic meal following the rule previously described (Fig.5).
Figure 5: Design of fish feeding experiments with toxic dinoflagellates Prorocentrum lima showing uptake (grey) and elimination (white) phases.
More specifically, 27.5 g were necessary to feed the fish in every tank for the first day, 25 g for the second day and 22.5 g, 20 g, 17.5 g for the third, fourth and fifth day, respectively. In the following 10 days a non contaminated diet replaced the toxic meal. Every 24 h after feeding two specimens in triplicate were randomly sampled and dissected. Viscera were carefully taken, weighted and prepared for toxin analysis.
36
3.1.4.
Toxin extraction and quantification
Toxins from fish’s viscera were extracted and determined via liquid chromatography with tandem mass spectrometry (LC-MS/MS) detection following and adapted version of the Standardised Operating Procedure of the European Reference Laboratory for the determination of marine lipophilic biotoxins (EURLMB, 2015).
2 g of fish’s viscera were homogenated, extracted with 9.0 mL MeOH by vortexing for 2 min. After centrifugation at 2000 g for 10 min, the resulting supernatant was transferred to a new 30 mL centrifuge tube. The remaining tissue was re-extracted with 9.0 mL MeOH and homogenized with a Polytron mixer (Kinematica, Switzerland). After centrifugation, supernatants were combined and the volume adjusted to 20 mL with MeOH. An aliquot of this extract was filtered through a 0.2 mm syringe filter and 10 ml injected to the LC-MS/MS system for determination of OA toxin group.
3.1.5.
Model fitting
For the empirical kinetics of DSP toxins elimination, a one-compartment model was used to describe elimination kinetics using a single component first-order kinetic model:
where Cm is the toxin concentration in fish viscera and kel denotes the
37
The toxin concentration decreases according to an exponential decay, with the steepness of the decay being determined by the elimination rate (k) and the size of the curve depending on the initial concentration of the toxin (Cm0) at the beginning of the elimination period, when the fish diet was changed to non-toxic feed.
3.1.6.
Statistical analysis
Data were tested for normality and homogeneity of variance by the Kolmogorov-Smirnov test and the Levene Median test. Differences were considered significant at p < 0.05. Data analysis was performed using the statistical program SigmaPlot Version 10.0.
3.2.
Part B – Swim Tunnel Experiment
3.2.1.
Animal conditions
Cultured juvenile individuals of zebra seabream Diplodus cervinus from the same cohort were obtained from the Aquaculture Research Station of Portuguese Institute of the Sea and Atmosphere (IPMA) and transported within thermal isolated containers to Guia Marine Laboratory (MARE-FCUL, Cascais, Portugal) where the study was carried out. The fish specimens (n= 16) were housed into two life support systems (LSS, indicated respectively as System 1 and System 2).
LSS were filled with filtered (0.35 µm) natural seawater (NSW), comprising a total volume of 400 L. The LSS acclimation tanks were equipped with a submergible seawater pump (Turbelle® nanostream - 6025, Tunze®), in order to provide seawater circulation (2500 L h−1) within the tank. Seawater
38
disinfection was performed with biological filtration (ouriço®, Fernando Ribeiro Lda, Portugal) and with a germicidal UVC device (V2ecton 300/600, TMC Iberia, Portugal) to maintain seawater quality. Abiotic conditions were monitored every two days using a multi-parameter measuring instrument (Multi 3420 SET G, WTW, Germany) until the end of experiments. Dissolved oxygen (DO) 9.0 ± 2 mg L¯¹, temperature 18.8 ± 0.5 °C, pH 8.19 ± 0.04 and salinity 35 ± 0.77 ‰ were daily controlled. A photoperiod of 12h light and 12h dark (12L: 12D) was set. Ammonia, nitrite and nitrate levels were checked as well every two days by means of colorimetric test kits (Salifert Profi Test, Holland) and kept below 2.0 mg L−1.
Fish were feed to satiation with a commercial food twice a day.
3.2.2.
Experimental Design
The trial system was comprised of four plexiglas cylinders (17 L) submerged into a tank with the same features of System 1 and 2 (Fig. 5). This procedure assured the same temperature in the four trial tanks and in the rearing system during the whole experiment. Exposure tanks were static, provided with aeration. In order to assure the water quality, a one-third water was changed every day and a complete water change was performed before the introduction of a new test fish. During the experiments abiotic conditions were checked every two days. Dissolved oxygen ranged 9.21 ± 0.04 mg L¯¹, temperature 18.0 ± 0.07 °C, pH 7.90 ± 0.18, salinity 34.8 ± 0.34 ‰ and nitrite levels were maintained below 0.1 mg L−1.
Twelve zebra seabreams (7.2 ± 0.6 cm, 6.5 ± 1.3 g) were randomly used for the experiment, six as the control group and six as the exposed group. To minimize fish variability, both exposed and control fish were tested in an alternating mode.
39
The fish were individually placed into a plexiglas cylinder and fed with an OA-enriched experimental feed for 3 days.
The contaminated food was prepared with lyophilized Prorocentrum lima culture containing a toxin concentration of 1000 µg OA eq kg-1, also in this case composed by approximately 74% of OA and 26% of DTX-1. The daily ration approximately represented 5% of the fish body mass and was administered twice a day (one time in the morning and one time in the afternoon) until fish satiation. The remaining food on the bottom was picked up, 30 minutes after meal. Then, it was dried and weighted, allowing for the calculation of the daily food uptake. The day prior to swim tunnel experiments fish were let on starvation.
Figure 6: Top view of the cylinders, where the fish in turn were housed and fed for three days before to be fished and ready for swimming trials into the swimming tunnel.
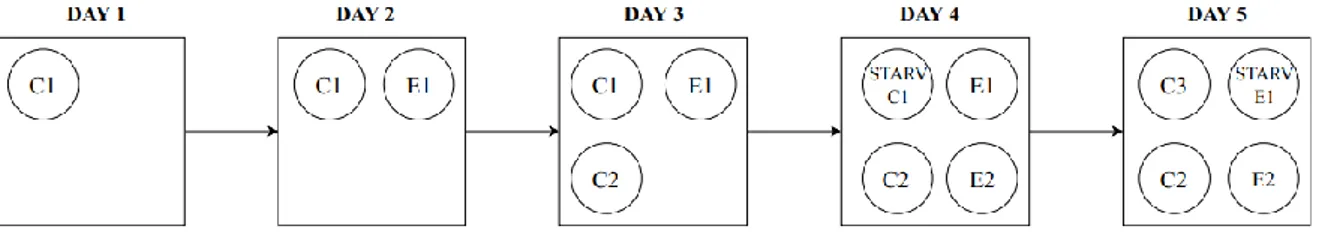
When the experiments began a fish (C1), belonging to the control group, was taken randomly from system 1 and recovered in the first cylinders where it was fed twice a day. On day two, the second fish belonging to the exposed group
40
(E1), was fished from system 2, recovered in the second cylinders and fed twice a day. Following this method, the same rules were used for C2 and so on until fish E6 (Fig. 6). The only difference was the type of meal.
Figure 7: Schematic description of the experimental design. Taking as an example the C1 fish: it has to spent three days into the cylinder, on the fourth day it has to be starved and in the afternoon the SMR measurement begin, while on the fifth day (in the morning) the fish starts the swimming trial for MMR measurement.
Summing up, for each fish, in turn, the following steps were performed until the sixth exposed fish:
1) fished from LLS, 2) housed and fed in the cylinders until the swimming trials, 3) weighed before to start, 4) weighted at the end and at last dissected.
According to our experimental design, every fish had to spend 3 days into the cylinders before to enter starved, on the fourth day, into the swimming tunnel (Fig. 7) and start the swimming performance as will be described afterwards.
41
Figure 8: Schematic diagram of the swimming tunnel respirometer used in this study (Rummer et al., 2016).
3.2.3.
Analysis of Fish Metabolism
3.2.3.1.
Swim Trials
Fish standard metabolic rate (SMR), maximum metabolic rate (MMR) and swimming performance were measured in an intermittent closed swim tunnel respirometer (Fig.8). Respirometer was placed into a closed room to avoid disturbance to fishes during trials.
Respirometer’s equipment was composed by one-unity of clear acrylic Plexiglas subdivided into two major areas: swim tunnel exterior part (Bath Area), which serve as a water buffer during flush’s respirometer after each run cycle and a swim tunnel interior part (Test Area), composed by a fish chamber of 55 x 14 x 14 cm (10 L water volume Loligo® Systems) dimension where the fishes were placed.
To guarantee constant water replacement, a large tank of 100 L was connected to the bath area. In this way water was constantly aerated, pumped from the buffer tank into the water bath across experiments and thus the respirometer was
42
filled with temperature-controlled, filtered and ultraviolet-sterilized seawater. The water was completely replaced every two days.
A speed control and external motor were used to set up water velocities in the fish chamber. Flow calibrations were made with a hand held flux meter (Hontzsch).
Respirometer runs and flushing were controlled with an interface connected to
the PC equipped with Aquaresp software while temperature and O2 were
continuously measured thought two fiber optic probes placed into the water current within the respirometer and connected to the program PyroOxygen. Fish were starved for 24 h prior to the experimentation. Fish standard length and weight were taken immediately before being placed into the fish chamber. For SMR assessment, oxygen consumption was recorded for a 15 hours spanning overnight period, exposing fish to minimal current velocity (half body length s-1, BL s-1).
Water flush cycles were set for a 12 min measurement period followed by a 3 min flush period to replenish the chamber with oxygen-saturated water. A 5-second non measurement period was set after every flush to avoid interferences in oxygen records.
MMR measurements were performed with the same fish on the following day. It was determined using fish oxygen consumption continuously measured undergoing fish at different velocity currents. The swimming trials started by increasing current velocity through steps of 8 cm s-1 (1 BL s-1) each, from 8 cm s-1 (1 BL s-1) to 72 cm s-1 (9 BL s¯¹). Fish swam at each speed for two cycles of 15 min (i.e. 30 min at each speed). Each 15 min cycle consisted of a 12 min measurement period, 5 seconds of non measuring period, and a 3 min flush period to replenish the chamber with filtered, well-aerated seawater, until fish exhaustion. This study considered fish completely exhausted when became pinned parallel against the metal grid, placed at the rear end of the chamber, without regain activity after a brief decrease in current velocity (Fig.9).
44
Figure 9: Frames extrapolated from MMR assessment during which fish swim for some time until exhaustion and place itself at the rear end of the chamber.
Meanwhile, the total swimming time and flow speed were recorded, the trial was considerate terminated, and the fish was collected to take note about weight and successively dissected for toxins analysis.
According with Wegner et al. (2018), maximum sustainable swimming speed (Ucrit) was determined by the equation: Ucrit = Ui + Uii (T/t) where Ui is the fastest swimming speed maintained for the whole cycle, Uii is the velocity step, T is the time swimming at the highest velocity and t is the length of time for each step in swimming speed (15\30min).
Oxygen consumption (MO₂) was calculated as the slope of the linear regression of oxygen concentration decline over time, during the measurement period of each cycle, using the following equation: MO₂ = SVresp M¯¹ where S is the slope (in milligrams of O₂ per litre per second), Vresp is the respirmoter’volume corrected by the fish’s volume while M is the mass of the fish (in kilograms).
45
Figure 10: Schematic representation of the swimming tunnel equipment (10/18 L) used for fish experiment. Current velocity is generated by a propeller driven by his controller. An external tank (reservoir tank) for recirculation, equipped with a submersible pump, provide seawater that enters the bath tank before being sterilized by UV. A cooler maintains water temperature while a computer allows for the management of water flushing into the fish chamber.
46
3.2.4.
Toxins evaluation
After the swimming performances into the swim tunnel respirometer, each fish (belonging to exposed group) was decapitated. Gills, viscera, liver and muscles were quickly dissected and immediately stored at – 20 º C until toxin extraction procedure.
3.2.5.
Toxins extraction
Extraction of OA-group toxins, hydrolysis and their determination via liquid chromatography with tandem mass spectrometry (LC-MS/MS) detection was carried out as described in Braga et al (2016), with some modifications. For each fish, 2 g of muscle tissues and digestive tract were extracted with 9.0 mL MeOH. After 3 minutes in the vortex and centrifugation at 2000 g for 10 min, the resulting supernatant was transferred into a 30 mL centrifuge tube. The remaining tissue was re-extracted with 9.0 mL MeOH and homogenized with a Polytron mixer (Kinematica, Switzerland) for one minute. After a second centrifugation, supernatants were combined and the volume was adjusted to 20 mL with MeOH.
An aliquot of this extract was filtered through a 0.2 mm syringe filter and 10 ml injected to the LC-MS/MS system for determination of free OA and DTX1. To detect any eventual product of OA or DTX1 esterification with fatty acids, an alkaline hydrolysis step was introduced to convert these compounds, collectively known as DTX3, into their parent compounds, OA or DTX1.
Hydrolysis started by adding 313 µl 2.5 M NaOH to a 2.5 mL aliquot of the methanolic extract in a test tube, which was homogenized for 30 s in the vortex and heated at 76 °C for 40 min in a heating block.
47
Upon cooling, the samples were neutralized with 313 µl of 2.5M HCl, mixed by vortex for additional 30 s. The extract was filtered through 0.2 mm syringe filter and injected in the LC-MS/MS system.
3.2.6.
Toxins determination (LC-MS/MS)
The LC-MS/MS equipment consisted of an Agilent 1290 Infinity coupled to a triple quadrupole mass spectrometer Agilent 6470. The chromatographic separation was conducted using an Zorbax SB-C8 RRHT (2.1 x 50 mm, 1.8 µm), protected with a guard column (2.1 x 5 mm, 1.8 µm). Elution was achieved using a binary eluent system: eluent A was water with 2 mM ammonium formate and 50 mM formic acid, and eluent B was 95% acetonitrile with 2 mM ammonium formate and 50 mM formic acid. Two MRM transitions in negative mode were monitored for OA and DTX1 ion: m/z 803>255 and m/z 803>113 for OA, and m/z 817>255 and m/z 817>113 for DTX1. The optimized source settings were as following: gas temperature 225 °C, gas flow 12 L min-1, nebulizer 45 psi, sheath gas temperature 375 °C, sheath gas flow 11 L min-1 and capillary voltage 400 V.
OA and DTX1 certified reference standards were purchased from the National Research Council, Halifax, Canada.
3.2.7.
Statistical analysis
All statistics were performed using R Studio (R Development Core Team 2014). Generalized linear models (GLM), predominantly of gamma families were used to compare estimates of MMR and SMR obtained on the same individuals after visualizing data distribution using histograms and tendency lines, case by case.
48
This repeated measures design minimized inter-individual variation in metabolic rate estimates.
The effect of feeding on Ucrit was analyzed through a one way analysis of variance (ANOVA). The ANOVA was followed by a Bartlett’s test to determine the difference between the values of different treatment groups (P < 0.05).
49
4. Results
4.1.
Accumulation and Elimination Kinetics
The toxic meal provided to Diplodus cervinus was consumed within the first hour. During the whole period of toxin uptake were not observed episodes of mortality or behavioral changes.
The shift from contaminated diet (uptake period) to non-contaminated one (elimination period) resulted in an exponential decay trend of toxin concentrations traced in fish viscera (Fig. 11). During elimination period toxins traced in fish’s viscera revealed that animals did not esterified OA. OA and DTX-1 were the only toxins of the DSP group detected. Moreover, from the exponential decay pattern it is possible to observe that OA was excreted before, in that it occurred only 5 days for its depuration while DTX-1 was still detectable, in fact it was excreted more slowly than OA, about in 10 days with an elimination rate illustrated in Table 2.
D SP to xin co n cent ratio n (µ g. k g -1) Time (days) OA DTX1
50
Figure 11: Elimination of okadaic acid (black line) and dinophysistoxin-1 (red line) in fish exposed to DSP toxins enriched diet measured in fish viscera. Dots and error bars represent experimental data; the coloured lines represent the output of the simulation model (Cm = Cm0 e
-kel t
).
Table 2: Elimination rate (kel, d-1) (± standard error) and coefficient of
determination R2 of each DSP toxin determined in fish after 5 days exposure.
Toxin Elimination
rate R
2
OA 0.523 (± 0.06)* 0.98
DTX1 0.658 (± 0.11)* 0.95
51
4.2.
Results from swim tunnel
4.2.1.
Levels of toxins accumulated in exposed fish
OA and DTX1 were found in viscera of fish fed with the contaminated diet. Toxins concentration, measured in fish after the swimming trial, ranged from 74.4 to 361.1 µg OA kg-1 and 34.2 to 94.4 μg DTX1 kg-1 (Table 4) which, in terms of OA/DTX1 proportion, is similar to the proportion of the contaminated diet. Toxins were not detected in fish muscle, and no other compounds of the OA-group toxins were detected including the esterified forms of OA and DTX1, collectively known as DTX3.
Table 3: Concentration (µg kg-1) of okadaic acid (OA) and dinophysistoxin 1 (DTX1) determined in viscera of zebra seabream Diplodus cervinus.
Fish Weight (g) Length (cm) Toxin (µg kg-1) OA DTX1 Exposed fish E1 4.7 6.5 74.4 34.2 E2 5.0 7.5 177.3 69.3 E3 4.8 6.0 361.1 94.4 E4 8.2 7.5 247.3 76.3 E5 8.8 8.0 149.7 66.1 E6 5.7 7.0 77.8 47.9 Control group n = 6 6.7 ± 1.0 7.3 ± 0.6 nd nd