Research Institute of Applied Economics 2009 Working Papers 2009/11, 8 pages
A missing spatial link in institutional quality
By Peter Claeys and Fabio Manca1
1
Universitat de Barcelona, Facultat de Economia i Empresa, Grup AQR IREA, Torre IV, Av. Diagonal, 690, E-08034 Barcelona, Spain. Email: [email protected]
Abstract: History tells that institutions evolve gradually over
time, pushing new ideas across borders and cultures. Globalisation is argued to accelerate this process. We examine the spatial links of different political institutions across borders. Applying various tests for spatial proximity, we do not find evidence of contemporaneous spatial links. This result is robust to various measures of distance and of cultural proximity across countries. Instead, when we analyse long run dynamics diffusion of institutions seems to occur only gradually.
.
Key words: institutions, spatial econometrics, spillover
.
JEL codes: C5, O1, O5, P5.
.
Peter Claeys acknowledges support by a Marie Curie Intra-European Fellowship within the 6th European Community Framework Programme.
1. Introduction
Good institutions are crucial in setting off economic development. Empirical tests that relate indicators of institutional quality to economic growth confirm that good governance, i.e. an accountable government, rule of law, economic freedom, spurs economic growth (Hall and Jones, 1999).
Institutions are the outcome of a conflict between various interests. The result depends on the de facto political power balance between these groups (Acemoglu et al., 2005). Different ways of resolving this political conflict shapes the way a country’s institutions develop over time. Institutional quality is not just determined by this domestic conflict, however. The winning group has to resolve a conflict with the winners in other countries too. This link is most obvious in episodes like wars or colonialism. History books are full of examples of conquerors imposing new structures and ideas on different cultures. Institutions also spread in less bloody ways. Common practices are often forced on countries through mutual exchanges, leading to a convergence in standards. Governments compete for foreign direct investment (Qiang and Roland, 1998). Traders and merchants exchange ideas and set common benchmarks (Eichengreen and Leblang, 2006). Governments learn from the experiences in other countries (Berkowitz et al., 2003). Migration makes governments refrain from adopting bad policies (Fleck and Hansen, 2005). Institutions are likely to spill from one country to another when some “link” ties the winning interest groups. These links may not only be geographical (due to low trading costs or easy migration), but also cultural (common traditions, religion or language) or economic (stage of development, trade).
In this paper, we examine whether institutional indices are spatially correlated, and test this hypothesis on two well-known sets of indicators developed by the World Bank (Kaufmann et
al., 2007), and the Fraser Institute respectively. In contrast to Keleijan et al. (2008), we do
not detect contemporaneous spatial links between indicators of institutional quality. Our result is robust to various measures of geographic, economic and cultural links across countries. We do not find evidence of increased spillover in recent periods. Institutions, however, take time to develop, and consequently, also to affect neighbouring countries. We find some slight evidence of institutional spatial correlation when testing for changes in institutional quality allowing for such long run dynamics.
2. Spatial indicators
Spatial autocorrelation occurs when the value of a variable at any one point in space depends on values at contiguous points. This spatial proximity between observations can be described with an exogenously specified weight matrix – call it W – that reflects the structure and intensity of these spatial links.
There are three basic tests for spatial correlation. The Moran I test is defined as:
∑
∑∑
= − − − = N i i j N i i ij N j x x x x x x w S N I 1 2 0 ( ) ) ( ) ( (1)where xi and xj are the observations for units i and j;
x
is the mean over the sample ofobservations; and wij is the i-j element of the row-standardised W matrix of weights. In (1),
∑∑
=
i j ij 0 w
S is a standardisation factor for the weights. A positive sign for I points to
positive spatial correlation, meaning that similar values tend to be near each other. Negative spatial correlation means that different values are close. The null hypothesis of no spatial autocorrelation can be rejected if the test statistic exceeds the (normally distributed) critical value.
The Getis Ord test identifies clusters of points with values higher in magnitude:
∑
∑∑
= = N i j i N i j i ij N j x x x x w G 1 (2)The higher (or lower) is G, the stronger the association between the observations. A test statistic near zero indicates no apparent concentration, and implies a random distribution of values in space. Finally, the Geary test indicates the cluster pattern of high/low values:
∑
∑∑
= − − − = N i i N i j i ij N j x x x x w S N C 1 2 2 0 ( ) ) ( 2 1 (3)C falls in a range between 0 and 2, with 0 indicating strong positive spatial correlation, and 2
negative correlation. Values vary around 1 indicate no spatial autocorrelation.
3. Statistical evidence
We use two well-know datasets of institutional indicators. First, the World Bank indicators (henceforth KKZ) measure the quality of political and economic institutions between 1998
and 2006, and cover six areas: (i) voice and accountability, (ii) political stability, (iii) government effectiveness, (iv) regulatory quality, (v) rule of law, and (vi) control of corruption. Second, the slightly more economics oriented Economic Freedom index (henceforth EF) of the Fraser Institute quantifies institutions at 5 year intervals between 1970 and 2005 in five major areas: (i) size of government: expenditures, taxes, and enterprises, (ii) legal structure and security of property rights, (iii) access to sound money, (iv) international trade, and (v) market regulation.
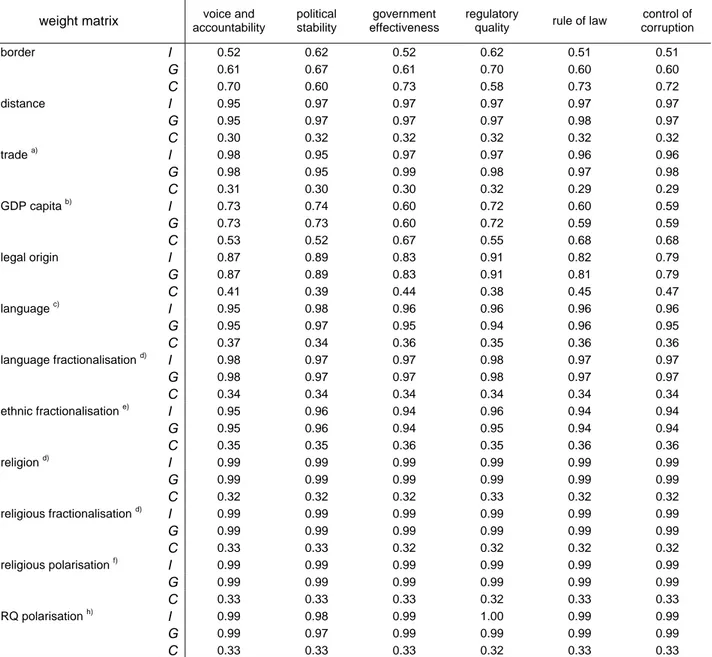
We test spatial correlation with various weight matrices. The links can be geographical, where contiguity (common border dummy) or physical distance (great circle distance between country centroids) is a good proxy for the cost of diffusion. Alternatively, we directly choose some economic linkage, such as trade, or differences in countries’ stage of development proxied by GDP per capita. Finally, spatial links may depend on the ease of exchange across cultures. We use measures for linguistic diversity (fraction of English or European languages spoken), measures of fractionalisation and polarisation along ethnic or religious lines, and legal origin.
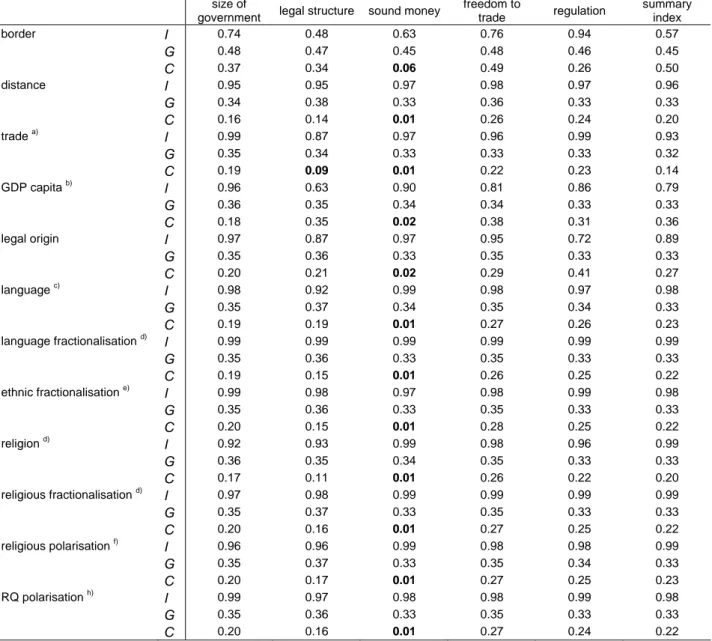
Table 1 reports the p-values for the different spatial tests on the 5 main KKZ indices for the year 2000. We cannot reject the null that spatial correlation does not exist. This result is robust to the use of all measures of geographic, economic, or cultural channels. The results are unequivocally similar for the 5 main EF indices.
The lack of spatial links between institutions is an extremely robust finding.2 First, results are similar for all years in the sample. Hence, there is no evidence that spillover has become stronger over time, due to globalisation, for example. Second, if we calculate the spatial tests for the entire set of indices, there still is no spatial correlation. Over the range spanned by the KKZ indices plus/minus two standard errors, there is no spatial link. The lack of spatial correlation might be due to aggregation over various sub-indices. The EF indices can be split up in 21 components, which in turn comprise several sub-components. We run the spatial test for each, but cannot find evidence of significant spillover for a single one. Third, linkages could be multidimensional. Economic and cultural links mutually reinforce each other. We capture this effect by multiplying the cultural weight matrix with bilateral trade (or GDP per capita). We still do not find evidence of institutional spillover. Finally, as spatial links could be more important for certain groups of countries, we repeat the tests for each continent (Africa,
2
Asia and Europe), and a group of emerging or OECD economies. However, we can refute that linkages are stronger within regional groups.
The spatial tests are static. However, institutions are very persistent over time (Hall and Jones, 1999) and the spillover mechanism may require time to develop through the different channels we proposed. We introduce these dynamics by testing spatial correlation on the difference in institutional quality over time. Only the EF index extends sufficiently back in time to examine a time span over which institutions can develop. In particular, we consider the change in the institutional indicator between 1980 and 2005, and use the weight matrix for the initial year. We still find little evidence of spatial links (Table 2). However, we do find some evidence of positive spatial correlation in the index of sound money. This indicates the growing similarity of monetary conditions on globalised financial markets over the nineties. Interestingly, when we use bilateral trade as the weight matrix, the legal structure index is highly spatially correlated. This may indicate that legal standards have slowly spilled over by forcing common practices on countries, their main channel being bilateral trade. This result is evidence in support of current practices in the institutional empirical literature that models spillover by focusing on long run dynamics (Persson and Tabellini, 2006; Bosker and Garretsen, 2006).
4. Conclusions
Although spillover in institutions is often implicitly recognised, we find no evidence that indicators of institutional quality are contemporaneously spatially correlated. Our result is good news for the literature examining the effects of institutional quality on economic development since their findings are not biased when implicitly ignoring spatial linkages. Diffusion of institutions across borders seems instead a long-run phenomenon. Some channels, trade in particular, may act in the long-run as a catalyst for standardisation in legal structure.
REFERENCES
Acemoglu D., Johnson S. and Robinson S., 2005, “Institutions as the Fundamental Cause of Long-Run Growth” in: Aghion, P., and Durlauf, S. (Eds.) Handbook of Economic Growth, vol. 1, Part A, p. 385-472. Elsevier.
Berkowitz, D., Pistor K. and Richard J., 2003, "Economic Development, Legality and the Transplant Effect," European Economic Review. vol. 47(1), p. 165-195.
Bosker M. and Garretsen H., 2006, “Geography Rules Too! Economic Development And The Geography Of Institutions.” Cesifo Working Paper No. 1769, July.
Easterly, W., and Levine R., 1997, “Africa's Growth Tragedy: Policies and Ethnic Divisions” Quarterly Journal of Economics, vol. 112(4), p.1203-50.
Eichengreen, B., and Leblang, D., 2006, “Democracy and Globalization,” available at http://www.bis.org/events/conf060619eichengreen.pdf.
Fleck R. and Hansen A., 2005, “How Bad Can a Government Be? Neighborhood Constraints and the Quality of National Governments”, Levy Institute, mimeo.
Hall R. and Jones C., 1999, “Why Do Some Countries Produce So Much More Output Per Worker Than Others?” The Quarterly Journal of Economics, vol. 114(1), p. 83-116.
Kaufmann D., et al., 2007, “Governance Matters V: Aggregate and Individual Governance Indicators for 1996-2005” The World Bank, September.
Keleijan et al., 2008, "Spatial Spillovers in the Development of Institutions," Working Paper 08-1, University of Maryland, Department of Economics.
Montalvo J. and Reynal-Querol J., 2005, “Ethnic polarization, potential conflict and civil war”, American Economic Review, vol. 95 (3), 796-816, June 2005.
Persson T. and Tabellini G., 2006, "Democratic Capital: The Nexus of Political and Economic Change," CEPR Discussion Paper No. 5654.
Qian, Y. and Roland G., 1998. "Federalism and the Soft Budget Constraint," American Economic Review, vol. 88, pp. 1143-62.
Wacziarg R. et al., 2003, “Fractionalization”, Journal of Economic Growth, vol. 8, no. 2, pp. 155-194.
TABLES
Table 1. Tests for spatial correlation, KKZ data.
weight matrix accountability voice and political stability effectiveness government regulatory quality rule of law control of
corruption border I 0.52 0.62 0.52 0.62 0.51 0.51 G 0.61 0.67 0.61 0.70 0.60 0.60 C 0.70 0.60 0.73 0.58 0.73 0.72 distance I 0.95 0.97 0.97 0.97 0.97 0.97 G 0.95 0.97 0.97 0.97 0.98 0.97 C 0.30 0.32 0.32 0.32 0.32 0.32 trade a) I 0.98 0.95 0.97 0.97 0.96 0.96 G 0.98 0.95 0.99 0.98 0.97 0.98 C 0.31 0.30 0.30 0.32 0.29 0.29 GDP capita b) I 0.73 0.74 0.60 0.72 0.60 0.59 G 0.73 0.73 0.60 0.72 0.59 0.59 C 0.53 0.52 0.67 0.55 0.68 0.68 legal origin I 0.87 0.89 0.83 0.91 0.82 0.79 G 0.87 0.89 0.83 0.91 0.81 0.79 C 0.41 0.39 0.44 0.38 0.45 0.47 language c) I 0.95 0.98 0.96 0.96 0.96 0.96 G 0.95 0.97 0.95 0.94 0.96 0.95 C 0.37 0.34 0.36 0.35 0.36 0.36 language fractionalisation d) I 0.98 0.97 0.97 0.98 0.97 0.97 G 0.98 0.97 0.97 0.98 0.97 0.97 C 0.34 0.34 0.34 0.34 0.34 0.34 ethnic fractionalisation e) I 0.95 0.96 0.94 0.96 0.94 0.94 G 0.95 0.96 0.94 0.95 0.94 0.94 C 0.35 0.35 0.36 0.35 0.36 0.36 religion d) I 0.99 0.99 0.99 0.99 0.99 0.99 G 0.99 0.99 0.99 0.99 0.99 0.99 C 0.32 0.32 0.32 0.33 0.32 0.32 religious fractionalisation d) I 0.99 0.99 0.99 0.99 0.99 0.99 G 0.99 0.99 0.99 0.99 0.99 0.99 C 0.33 0.33 0.32 0.32 0.32 0.32 religious polarisation f) I 0.99 0.99 0.99 0.99 0.99 0.99 G 0.99 0.99 0.99 0.99 0.99 0.99 C 0.33 0.33 0.33 0.32 0.33 0.33 RQ polarisation h) I 0.99 0.98 0.99 1.00 0.99 0.99 G 0.99 0.97 0.99 0.99 0.99 0.99 C 0.33 0.33 0.33 0.32 0.33 0.33
Notes: a) Frankel Romer trade index, b) Penn World Tables, c) fraction of English speaking population, d) Wacziarg et al. (2003), e) Easterly and Levine (1997), f) our measure based on fractions of main religions, i) Montalvo and
Table 2. Tests for spatial correlation, EF data.
size of
government legal structure sound money
freedom to trade regulation summary index border I 0.74 0.48 0.63 0.76 0.94 0.57 G 0.48 0.47 0.45 0.48 0.46 0.45 C 0.37 0.34 0.06 0.49 0.26 0.50 distance I 0.95 0.95 0.97 0.98 0.97 0.96 G 0.34 0.38 0.33 0.36 0.33 0.33 C 0.16 0.14 0.01 0.26 0.24 0.20 trade a) I 0.99 0.87 0.97 0.96 0.99 0.93 G 0.35 0.34 0.33 0.33 0.33 0.32 C 0.19 0.09 0.01 0.22 0.23 0.14 GDP capita b) I 0.96 0.63 0.90 0.81 0.86 0.79 G 0.36 0.35 0.34 0.34 0.33 0.33 C 0.18 0.35 0.02 0.38 0.31 0.36 legal origin I 0.97 0.87 0.97 0.95 0.72 0.89 G 0.35 0.36 0.33 0.35 0.33 0.33 C 0.20 0.21 0.02 0.29 0.41 0.27 language c) I 0.98 0.92 0.99 0.98 0.97 0.98 G 0.35 0.37 0.34 0.35 0.34 0.33 C 0.19 0.19 0.01 0.27 0.26 0.23 language fractionalisation d) I 0.99 0.99 0.99 0.99 0.99 0.99 G 0.35 0.36 0.33 0.35 0.33 0.33 C 0.19 0.15 0.01 0.26 0.25 0.22 ethnic fractionalisation e) I 0.99 0.98 0.97 0.98 0.99 0.98 G 0.35 0.36 0.33 0.35 0.33 0.33 C 0.20 0.15 0.01 0.28 0.25 0.22 religion d) I 0.92 0.93 0.99 0.98 0.96 0.99 G 0.36 0.35 0.34 0.35 0.33 0.33 C 0.17 0.11 0.01 0.26 0.22 0.20 religious fractionalisation d) I 0.97 0.98 0.99 0.99 0.99 0.99 G 0.35 0.37 0.33 0.35 0.33 0.33 C 0.20 0.16 0.01 0.27 0.25 0.22 religious polarisation f) I 0.96 0.96 0.99 0.98 0.98 0.99 G 0.35 0.37 0.33 0.35 0.34 0.33 C 0.20 0.17 0.01 0.27 0.25 0.23 RQ polarisation h) I 0.99 0.97 0.98 0.98 0.99 0.98 G 0.35 0.36 0.33 0.35 0.33 0.33 C 0.20 0.16 0.01 0.27 0.24 0.22