MATERIAL DEPRIVATION AS MARKER OF HEALTH NEEDS L. Grisotto, D. Catelan, G. Accetta, A. Biggeri
1. INTRODUCTION
In the epidemiological literature a relationship between socio-economic status and health was largely documented both by individual-level and ecological stud-ies. A pubmed search on “socio-economic status and health” returns 21,319 pa-pers (for Italy see Costa et al., 2004; Dreassi et al., 2005; Catelan et al., 2006).
There was also a variety of health indicators (e.g. mortality, hospital admis-sions, out-patient visits, pharmaceutical prescriptions) and socio-economic indica-tors (e.g. simple vs composite; income vs social) used in studying this association. In the present paper we faced with statistical aspects that need to be addressed and that directly depend on the level of available data.
Ecological regression analysis (Morgenstern 2008) are usually performed on a response variable (e.g. Standardized Mortality Ratio) which is adjusted for some relevant confounder (such as age). This approach is also useful to reduce the di-mensionality of the data since disease counts are collapsed by age classes within area. However, it is common to find that the covariates included in the ecological regression model are not adjusted for the same confounder. Rosenbaum and Rubin (1984) denoted this as the “mutual standardization” problem. They shown that in linear regression models where directly age standardized rates are used as dependent variable and covariates are not age-adjusted the regression coefficients are biased. When the independent variable is not adjuted we are implicitely as-suming that it is constant throughtout all the strata of the confounding variable. If this assumption is not true the result is biased (Rosenbaum and Rubin 1984, p. 440). Wakefield (2007) suggested that to correctly estimate the covariate effect it is sufficient to know the bivariate confounder by regressor joint distribution and not the full tri-variate response by confounder by regressor joint distribution.
Some aspects of poverty exert their action at an ecological and not only at an individual level. The effect of socio-economic variables on health is complex, and might be mediated by the average level of deprivation of the area in which a per-son lives. It means that a better off perper-son that lives in a poor area have worst health outcomes than he would have living in a non disadvantaged area. In the sociological literature this was named “contextual effect” (Firebaugh, 1978).
Eventually, the observed mortality in a high deprivated area would be bigger than that we would expect summing up the effects of all the disadvantaged conditions observed at individual level in that area.
These arguments are relevant when considering the issue of introducing socio-economic indicators in resource allocation formulas (Carr Hill et al., 1994, Minis-tero della Salute, 1998). Generally speaking, allocation criteria are usually based on a weighted capitation formula determined by some weighting scheme (Stone and Galbraith, 2006). The weights may reflect the demographic and socio-economic structure of the population, which are strong determinants of the health needs of a given population. First attempts in this direction were done in UK with the creation in 1948 of the National Health Service (NHS). The initial allocation formu-las considered only demographic characteristic of the population (age). The emerging evidence of a relationship between health and socio-economic status motivated the introduction in the allocation formula of some measures of social or material deprivation (Jarman, 1983, Carr Hill et al., 1994). In Italy, in the 2006 State-Regions Conference (Roma, 20 aprile 2006), it was discussed the introduc-tion of socio-economic indicators in the allocaintroduc-tion formula.
In this work we considered a material deprivation index as predictor of health needs and we addressed the problem of mutual standardization comparing results when adjusting or not health outcome and deprivation for the same confounding variable. The availability of individual-level data allowed us to compare models with different data hierarchies and to evaluate both the individual effect of depri-vation on heath status and the aggregate effect, disentagling the individual from the contextual effects. Infact, we took advantage of data from the Florence 1991 census cohort (Tuscan Longitudinal Study, Biggeri et al., 2001).
In section 2 we decribe the data. In section 3 we present the individual and the ecological models used. Results are presented in section 4. Discussion and con-clusions follow in section 5.
2. MATERIALS
2.1 Mortality data
Individual mortality data come from the Florence 1991 census cohort which is part of the Tuscan Longitudinal Study (SLTo, Biggeri et al., 2001). We considered the resident population present in the city of Florence at the census day 31st Oc-tober, 1991. The follow-up ended on 31st December, 1995. We analyzed mortality for all causes (ICD IX 001-999) among males aged between 18 and 75 at entry. We enrolled 144,001 people for 568,713 person years of follow up and observed 4,312 deaths (a crude mortality rate of 7.6 10-3) in 2,752 census blocks.
2.2 Material Deprivation data
Data on socio-economic factors derived from individual records of the 1991 census. A material deprivation index at individual level has been constructed as
the sum of four indicators of adverse events: low education (less then 6 years of formal education), unemployment, house characteristics (<25 sqm and bathroom outside the house). The index is zero if a person has none of the four events, one if a person has 1 adverse event and two if she has 2 or more adverse events. 3.METHODS
3.1 Individual level models
Let Yjisa be a Bernoulli variable wich take the value 1 if the j-th subject in the i-th level of deprivation s-th census block and a-th age class died and 0 otherwise.
Indeed, the material deprivation index is discrete with value i=0, 1, 2. If we con-sider the frequency of people by each i-th level of deprivation, s-th census block and a-th age classes then Yisa = j Yjisa is the observed number of death, and it
fol-lows a Poisson distribution with mean (Tisa isa) where isa is the relative risk and Tisa the number of person years of observation or the expected number of cases under internal indirect standardization.
Infact, to adjust by age, internal indirect standardization is used and the ex-pected number of deaths is calculated as *
isa sa isa
PY E , where PY is person isa
year of observation, * sa
is the reference rate and E the expected counts. No-isa
tice that we assume the multiplicative model isa issa (Breslow and Day 1978, 1986).
We specified three generalized linear models on the logarithm of the relative risk:
1) The pooled model:
log( ) T
isa xisa aagea
(1)where is the intercept, xisa is the individual-level material deprivation index, agea
is an indicator variable for age class, a is the age effect (a1 for identifiabil-0 ity) and T is the pooled individual effect of material deprivation.
2) The contextual model (Firebaugh, 1978):
log( ) I C
isa xisa xs aagea
(2)where xisa is the individual-level material deprivation index, x is the average ma-s
terial deprivation of the s-th census block ( A Ia A
s a i isa a a
x
x
I ), I eC
3) The Cronbach model (Cronbach e Webb, 1975):
log( ) I( ) A( )
isa xisa xs xs x aagea
(3)where xisa and x are, as before, the individual-level and the average census block s
material deprivation index, xis the grand mean of material deprivation for the population under study, Iis the individual effect and A is the aggregate (eco-logical) effect. In a linear effect model the aggregate effect is algebraically equiva-lent to the sum of the individual and the contextual effetcs: (A I C).
The Cronbach model is computationally more efficient because the individual-level material deprivation and the census block average material deprivation are centered.
3.2 Ecological Models
Let assume now that data are aggregated at census block level and that Y is s
the count of observed deaths and x is the mean deprivation level in the s-th s
census block. As before, we assume the death counts are distributed as Poisson with mean Ts s where s is the relative risk of the s-th sensus block and Ts the
expected number of cases or person years of observation.
We specified a series of ecological models on the logarithm of the Relative Risk in which the response variable and the material deprivation index are alter-natively age-adjusted or not (x and s x respectively). sage
4) The first model is fitted on crude data, both mortality and deprivation are not age-adjusted. However, age is included in the model as the mean age by census block
s
age . In this case Ts is equal to the person years at risk in the s-th census block:
s s
T PY
log( g) A
s xs ages
(4)
where is the intercpet, A is the aggregate effect of material deprivation and represents the linear effect of age.
5) In the second model both mortality and deprivation are adjusted for age. In this case Ts is equal to the expected number of cases given by the product of
sa
PY , the person years of observation in s-census block and a-th age classes, and R
a
, the age-specific reference rates:
R
s s a sa
T E
PYlog( age) A age
s xs
where A is the aggregate effect and age s
x is the age-adjusted deprivation.
6) In the third model mortality is age-adjusted while the material deprivation index is not adjusted for age:
log( age) A
s xs
(6)
where x is the crude census block average deprivation, not age-adjusted. s
7) In the last model mortality is age-adjusted, the material deprivation index is not adjusted but, differently from the above model, age is now included into the regression model as a confounder:
log( age) A
s xs ages
(7)
where age is the age average in the s-th census block. s
For all models, the material deprivation effects are reported both per unit change in deprivation and for one standard deviation change. In this way the magnitude of the regression coefficients of individual and ecological models are directly comparable.
4. RESULTS
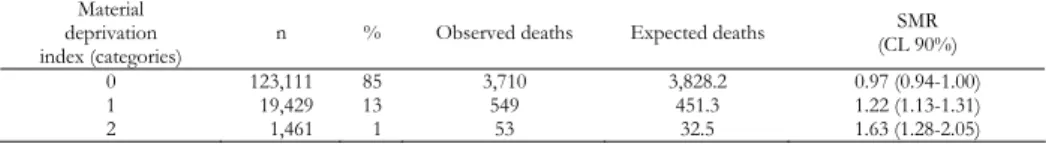
Table 1 reports the distribution of numbers of enrolled people, counts of ob-served and expected deaths and Standardized Mortality Ratios (SMRs) by level of material deprivation. The expected number of cases was calculated by internal in-direct standardization classifying the population in 16 age classes (0-4, 5-9, ..., 75 or more) (Breslow e Day, 1975). There is a positive trend in SMR by level of ma-terial deprivation; the relative risk for a linear trend is 1.27 (0.237 on the log scale, 90% CL 0.17; 0.30) (Armitage, 1955; Cochran, 1954).
TABLE 1
Tuscan Longitudinal Study. Number of enrolled subjects (percentage), observed and expected death counts, SMR (90% confidence limit) by category of material deprivation index. All cause mortality. Males.
Florence census cohort 1991-1995
Material deprivation
index (categories) n % Observed deaths Expected deaths SMR (CL 90%)
0 123,111 85 3,710 3,828.2 0.97 (0.94-1.00) 1 19,429 13 549 451.3 1.22 (1.13-1.31)
2 1,461 1 53 32.5 1.63 (1.28-2.05) The logarithm of relative risks estimated by the individual models are reported in Table 2. The estimated individual effect from the pooled model (1) is 0.238 (90% CL 0.17; 0.30); it decreases to 0.166 (90% CL 0.10; 0.23) when we con-
TABLE 2
Tuscan Longitudinal Study. Regression coefficients (standard error) of census block average material deprivation index. Results of the individual-level models (1) (2) (3) (see text). All cause mortality. Males.
Florence census cohort 1991-1995
Model Covariate /sd (1) pooled xisa 0.238 (0.039) 0.093 (0.015) (2) Contextual xisa 0.166 (0.041) 0.065 (0.016) sa x 0.672 (0.120) 0.082 (0.015) (3) Cronbach xisaxsa 0.166 (0.041) 0.062 (0.015) sa x x 0.838 (0.113) 0.102 (0.014) * regression coefficients are log relative risk
sidered in the model the contextual effect of census block average material depri-vation (model 2). The pooled effect T=0,238 (model 1) is a biased estimate of the individual effect since it does not account for the presence of a concurrent con-textual effect. In a linear effect model is easy to show that:
( ) ( ) T I CVar x Var x . In our case ( )sd x =0.3897 ; ( )sd x =0.1219 ; ( ) ( ) Var x
Var x =0.10; and thus:
0.166+0.672×0.10=0.233.
The contextual effect of material deprivation is larger than the individual effect (I =0.166, 90% CL 0.10; 0.23, and C=0.672, 90% CL 0.48; 0.87, respectively),
even when we considered the standardized effect (I /sd(x) = 0.065, 90% CL
0.038; 0.091, and C/ ( )sd x = 0.082, 90% CL 0.057; 0.107). The aggregate effect A
estimated by the Cronbach model is 0.838 (90% CL 0.65; 1.02), and it is al-gebraically the sum of I and C. The aggregate effect A standardized by unit
of standard deviations is 0.102 (90% CL 0.079; 0.125).
The results obtained fitting the ecological models are reported in Table 3. Let consider standardized coefficients by unit of standard deviations to compare the results with those obtained fitting the pooled and Cronbach models, respectively. Model 4 (bA/sd=0,097, 90% CL 0.074; 0.120) and model 5 (bA/sd=0.119, 90%
CL 0.091; 0.147) reproduced the analysis conducted on individual-level data (A/sd=0.102, 90% CL 0.079; 0.125). Model 4 used crude mortality and depriva-tion variable and age as covariate, while model 5 used both age-adjusted mortality and deprivation. Models 6 and 7 overestimated the effect (A/sd = 0.143, 90%
CL 0.110; 0.176, and A/sd = 0.140, 90% CL 0.107; 0.173, respectively). We
de-scriptively may compare these five estimates by a random effect meta-analysis: the heterogeneity I2 (Higgins et al., 2003) between the effect estimates was 34.4% (the variance between was var( ) 0.000441ˆ while the average within variance was 0.000289 - es( ) 0.017ˆ ; then I2=(0.000441-0.000289)/0.000289=34.4%). These heterogeneity was completely accounted by model 6 and 7, which overes-timated the effect by 0.037, p=0.025 (Thompson and Sharp, 1999).
Standard errors of the estimates are rather stable through all models, but mod-els 5, 6 and 7 show slightly more uncertainty in the estimates (table 3).
TABLE 3
Tuscan Longitudinal Study. Regression coefficients (standard error) of census block average material deprivation index. Results of the aggregate-level models (4) (5) (6) (7) (see text). All cause mortality. Males.
Florence census cohort 1991-1995
Model Covariate A A
/ sd (4) crude + age as covariate xs 0.792 (0.112) 0.097 (0.014)
(5) age-adjusted age s x 0.830 (0.116) 0.119 (0.017) (6) age-adjusted mortality crude deprivation xs 0.799 (0.113) 0.143 (0.020) (7) age-adjusted mortality
crude deprivation + age as covariate xs 0.787 (0.114) 0.140 (0.020)
5.DISCUSSION AND CONCLUSION
We addressed the problem of mutual standardization when analyzing ecologi-cal data adjusting or not the outcome and the predictor for the same confounding variable. In particular we focused on material deprivation as predictor of all cause mortality because it is debated how to improve resource allocation formulas in-cluding the deprivation effect. Rosenbaum and Rubin (1984) discussed the prob-lem. However they treated the linear case and a predictor defined at the subject-specific level. But, in the present context, Poisson regression models fitted to in-dividual-level data highlighted the presence of a relevant contextual effect of ma-terial deprivation and we are interested in estimating the aggregate effect by Pois-son ecological regression model.
We showed that standardized aggregate effect is unbiasedly estimated by eco-logical models in which either mortality and deprivation are age-adjusted or when the model on crude mortality include crude deprivation and age as predictors. These results are perfectly consistent with the findings on linear models by Rosenbaum and Rubin (1984).
Coming back to the real issue of allocation formulas, our results implies that if we want to use information on socio-economic factors and age we need either to age-standardized mortality and deprivation or regress crude mortality rates by crude deprivation and age.
plausibility of a contextual effect. Infact, the study of contextual effect is compli-cated by the identification of the appropriate level of aggregation. Census block seems to be a good compromise and the choice of a bigger geographical level (e.g. municipality) would lead to an effect diluition or an ecological bias. This suggests also to not overinterpret the association as a direct causal relation. The scope of the analysis, in the case of resources allocation, is to identify markers of health needs. A marker is associated to the outcome but not necessarily it is a de-terminant of it. A further complication is that deprivation indexes may assume different meanings in different geographical contexts or points in time (Dreassi et.
al., 2005, Catelan et. al., 2006). Eventually, the association of material deprivation
and mortality may be reversed and using it in a fixed allocation formula would lead to a distribution of resources not consistent with objectivity, equity and effi-ciency principles.
Practical limitations in the estimation of the aggregate effect associated with deprivation can be met in the availability of the data. Indeed, we do not have the joint distribution of age and deprivation at a small geographical level and there-fore it is currently impossible to age-standardized the material deprivation index.
In conclusion, after adjusting for age, deprivation appeared to be a good pre-dictor of health needs both at individual and at aggregate level (census block). The presence of a contextual effect increases the interest in using deprivation in the allocation formula, since it would permit a better distribution of resources to disadvantaged micro-areas. In the present paper, we stress the need to estimate the association between deprivation and health appropriately adjusting for age. The current common practice, in absence of individual data, to regress standard-ized mortality on material deprivation may be inappropriate. The bias introduced depends on the difference between adjusted and not-adjusted predictors. The al-ternative model that include age as predictor together with crude material depri-vation may result in unbiased estimates under the restrictive assumption of ab-sence of interaction in the scale of the linear predictor (Rosenbaum and Rubin, 1984 p. 441-442).
ACKNOWLEDGMENTS
The present research was funded by Ministry of Education and Scientific Research PRIN 2006131039 “Statistical Methods for Environmental Health Impact Assessment” PRIN 2008TXL73Z “Economic and statistical methods in Environmental Epidemiol-ogy”. Census data were made available by the Tuscan Region to the Tuscan Longitudinal Study (SLTo).
Department of Statistics “G. Parenti” LAURA GRISOTTO
University of Florence DOLORES CATELAN
Biostatistics Unit GABRIELE ACCETTA
REFERENCES
ARMITAGE P. (1955), Test for linear trend in proportions and frequencies. Biometrics; 11: 375-86.
BIGGERI A, GORINI G, DREASSI E, KALALA N, LISI C (2001), Condizione socio-economica e mor-talità in Toscana, Studi e Ricerche, n. 7, Edizioni Regione Toscana, Centro Stampa Giun-ta Regionale, Firenze.
BRESLOW NE, DAY NE (1975), Indirect standardization and multiplicative models for rates, with reference to the age adjustment of cancer incidence and relative frequency data. Journal of Chronic Diseases 28(5,6), 289-303.
CARR-HILL RA, SHELDON TA, SMITH PC, MARTIN S, PEACOCK S, HARDMAN G (1994), Allocating re-sources to health authorities: development of method for small area analysis of use of inpatient services, BMJ, 309: 1046-1049.
CATELAN D, BIGGERI A, DREASSI E, LAGAZIO C (2006), Space-cohort Bayesian models in eco-logical studies. Statistical Modelling; 6: 1-15.
COCHRAN WG (1954), Some methods for strengthening the common chi-squared tests. Bio-metrics; 10: 417-54.
COSTA G, SPADEA T, CARDANO M (2004), (a cura di) Diseguaglianze di salute in Italia. Epid Prev, 28 (3).
CRONBACH LJ, WEBB J (1975), Between-class and within-class effects in a reported aptitude X treatment interaction. J. Educ. Psycology; 67, 6:717.
DREASSI E, BIGGERI A, CATELAN D (2005), Space-time models with time dependent covariates for the analysis of the temporal lag between socio-economic factors and lung cancer mortality. Statist. Med.; 24: 1-19.
FIREBAUGH G (1978), A rule for inferring individual-level relationships from aggregate data. American Sociological Review. 43, 557-572.
HIGGINS JPT, THOMPSON SG, DEEKS JJ, ALTMAN DG (2003), Measuring inconsistency in meta-analyses. British Medical Journal, 327: 557-560.
JARMAN B (1983), Identification of underprivileged areas. Britisch Medical Journal, 1705-1709.
MINISTERO DELLA SALUTE (1998), Piano Sanitario Nazionale 1998-2000. Un patto di
soli-darietà per la salute. Roma.
MORGENSTERN H (2008), Ecologic Studies. In Rothman KJ, Greenland S, Lash TL Modern Epidemiology – third edition. Lippincott Williams & Wilkins, Philadelphia.
ROSENBAUM P R, RUBIN D B (1984), Difficulties with regression analyses of age-adjusted rates. Biometrics, 40, 2: 437-443.
STONE M, GALBRAITH J (2006), How not fund hospital and community health services in England. J. R. Statist. Soc. A, 169 Part 1, 143-164.
THOMPSON SG, SHARP SJ (1999), Explaining heterogeneity in meta-analysis: a comparison of methods. Statistics in Medicine, 18: 2693-2708.
WAKEFIELD J (2007), Disease mapping and spatial regression with count data. Biostatistics, 8, 2, 158-183.
SUMMARY
Material deprivation as marker of health need
A relationship between socio-economic status and health has been widely documented both by individual-level and ecological regression studies. We addressed the problem
known in the literature as using a material deprivation index as predictor of health needs and comparing results when adjusting or not the health outcome and the deprivation in-dex for the same confounding variables. We focus on non-linear hierarchical models. We take as example the the issue of introducing socio-economic indicators in national or re-gional resources allocation formulas. We fitted a series of models with different data hier-archies to evaluate both the individual effect and the aggregate (census block) effect of material deprivation on heath status, disentagling the individual from the contextual ef-fects. Individual mortality records came from the Florence census cohort 1991-1995 which is part of the Tuscan Longitudinal Study. Data on socio-economic factors derived from individual records of the 1991 census. Our results suggested that after adjusting for age, material deprivation is a good predictor of health needs both at individual and at ag-gregate level (census block). The presence of a contextual effect increases the interest in using deprivatin in the allocation formula, since it would permit a better distribution of resources to disadvantaged micro-areas. In the present paper, we stress the need to esti-mate the association between deprivation and health appropriately adjusting for age. The ideal goal would be having information at small geographical level on the joint distribu-tion of age and deprivadistribu-tion to age-standardize both the response and the predictor. A temporary solution should be to regress crude mortality rates on deprivation and age. The current common practice, in absence of individual data, to regress standardized mortality on material deprivation may be inappropriate.