Contents lists available atScienceDirect
NeuroImage
journal homepage:www.elsevier.com/locate/neuroimage
Mapping the pharmacological modulation of brain oxygen metabolism: The
e
ffects of caffeine on absolute CMRO
2
measured using dual calibrated fMRI
Alberto Merola
a, Michael A. Germuska
a, Esther AH Warnert
a, Lewys Richmond
b, Daniel Helme
b,
Sharmila Khot
a,b, Kevin Murphy
a, Peter J. Rogers
c, Judith E. Hall
b, Richard G. Wise
a,⁎aCardiff University Brain Research Imaging Centre (CUBRIC), School of Psychology, Cardiff University, Cardiff, UK bDepartment of Anaesthetics and Intensive Care Medicine, Cardiff University School of Medicine, Cardiff, UK cSchool of Experimental Psychology, University of Bristol, Bristol, UK
A R T I C L E I N F O
Keywords: Calibrated fMRI Gas manipulations
Cerebral metabolic rate of oxygen consumption Caffeine
Randomised placebo-controlled drug study
A B S T R A C T
This study aims to map the acute effects of caffeine ingestion on grey matter oxygen metabolism and haemodynamics with a novel MRI method. Sixteen healthy caffeine consumers (8 males, age=24.7 ± 5.1) were recruited to this randomised, double-blind, placebo-controlled study. Each participant was scanned on two days before and after the delivery of an oral caffeine (250 mg) or placebo capsule.
Our measurements were obtained with a newly proposed estimation approach applied to data from a dual calibration fMRI experiment that uses hypercapnia and hyperoxia to modulate brain blood flow and oxygenation. Estimates were based on a forward model that describes analytically the contributions of cerebral bloodflow (CBF) and of the measured end-tidal partial pressures of CO2and O2to the acquired dual-echo GRE
signal. The method allows the estimation of grey matter maps of: oxygen extraction fraction (OEF), CBF, CBF-related cerebrovascular reactivity (CVR) and cerebral metabolic rate of oxygen consumption (CMRO2). Other
estimates from a multi inversion time ASL acquisition (mTI-ASL), salivary samples of the caffeine concentration and behavioural measurements are also reported.
We observed significant differences between caffeine and placebo on average across grey matter, with OEF showing an increase of 15.6% (SEM ± 4.9%, p < 0.05) with caffeine, while CBF and CMRO2showed differences
of−30.4% (SEM ± 1.6%, p < 0.01) and −18.6% (SEM ± 2.9%, p < 0.01) respectively with caffeine administration. The reduction in oxygen metabolism found is somehow unexpected, but consistent with a hypothesis of decreased energetic demand, supported by previous electrophysiological studies reporting reductions in spectral power with EEG.
Moreover the maps of the physiological parameters estimated illustrate the spatial distribution of changes across grey matter enabling us to localise the effects of caffeine with voxel-wise resolution. CBF changes were widespread as reported by previousfindings, while changes in OEF were found to be more restricted, leading to unprecedented mapping of significant CMRO2reductions mainly in frontal gyrus, parietal and occipital lobes.
In conclusion, we propose the estimation framework based on our novel forward model with a dual calibrated fMRI experiment as a viable MRI method to map the effects of drugs on brain oxygen metabolism and haemodynamics with voxel-wise resolution.
Introduction
Functional MRI (fMRI) has been widely applied in research and clinical settings to infer brain activity. However, changes in blood oxygenation level dependent (BOLD) signal do not quantify local brain activity (Ekstrom, 2010) in energetic terms. The interpretation of BOLD signal is complicated by the dependence on underlying physio-logical parameters including cerebral bloodflow (CBF), cerebral blood
volume (CBV) and vascular architecture, oxygen extraction fraction (OEF) and cerebral metabolic rate of oxygen consumption (CMRO2).
The need to quantify brain activity better has driven recent methodo-logical developments to measure oxygen metabolism in the brain as the rate of oxygen consumption is closely linked to oxidative energy release. CMRO2therefore has the potential to be a useful biomarker
of the (patho)physiological state of brain tissue (Lin et al., 2010). A number of different MR-based methods for absolute CMRO2
http://dx.doi.org/10.1016/j.neuroimage.2017.03.028 Received 5 August 2016; Accepted 15 March 2017
⁎Corresponding author.
E-mail address:wiserg@cardiff.ac.uk(R.G. Wise).
Available online 18 March 2017
1053-8119/ © 2017 The Authors. Published by Elsevier Inc. This is an open access article under the CC BY license (http://creativecommons.org/licenses/BY/4.0/).
measurement have been proposed in recent years. A group of techni-ques, known as calibrated BOLD methods, aims to estimate CMRO2
from BOLD and arterial spin labelling (ASL) signals, exploiting contrast induced by respiratory tasks and mathematical models describing the complex relationship between oxygen metabolism, BOLD signal and CBF in the brain. Recently, extensions of the original approaches of Davis and Hoge (Davis et al., 1998; Hoge et al., 1999) have been developed allowing the use of both hypercapnia and hyperoxia induced CBF and BOLD signal changes within the same experiment, to estimate venous deoxyhaemoglobin concentration and thus OEF and absolute CMRO2(Bulte et al., 2012; Gauthier and Hoge,
2012; Wise et al., 2013), an approach also known as dual calibrated fMRI (or dual calibrated BOLD).
In this paper we aim to show how this dual calibrated experimental methodology, combined with a forward modelling estimation approach can be used to assess the effects of a drug (caffeine) on the brain with good spatial resolution. We utilise a randomised, double-blind, place-bo-controlled study design to demonstrate the acute effects of caffeine ingestion in low to average caffeine consumers. In particular, our aim is to characterize the effects of caffeine on brain metabolism and haemodynamics, quantifying the main underlying physiological para-meters of interest.
Caffeine is a methylxanthine and is one of the most frequently and widely consumed psycho-active substances. It is a non-selective antagonist of the adenosine receptors, especially types A1 and A2 (both A2A and A2B) (Fredholm et al., 1999; Pelligrino et al., 2012), inhibiting the release of excitatory neurotransmitters. This has two independent consequences on neural activity and bloodflow. On the one hand, by inhibiting the A1 receptors, it increases the neuronal firing rate (Fredholm et al., 1999). On the other hand, acting on the A2A and A2B receptors located on blood vessels, it promotes vasocon-striction and therefore leads to reduction in CBF (Kusano et al., 2010; Pelligrino et al., 2010). Due to the non-specific binding of caffeine to both types of receptors (A1 and A2), these effects may vary depending on the proportional expression of the two receptors in specific areas of the brain (Laurienti et al., 2003). In particular, studies with autoradio-graphy (Svenningsson et al., 1997) and PET (Bauer et al., 2003; Fukumitsu et al., 2003; Ishiwata et al., 2005) found both receptors to be heterogeneously distributed across tissue, with the A1 type more abundant in caudate nucleus, striatum, thalamus and superficial cortical areas, and A2 in putamen, caudate nucleus and thalamus.
Caffeine has also been reported to elicit other effects of psycho-physical nature, such as increased anxiety, alertness and raised blood pressure (Einöther and Giesbrecht, 2013; Smith, 2002). Caffeine plasma concentration peaks between 30 and 45 min after ingestion followed by a plateau of approximately 60 to 80 min (Fredholm et al., 1999;Nehlig and Boyet, 2000) and is then characterized by a wide half-life range typically between 2.5 and 10 hours depending mainly on age, gender and weight (Fredholm et al., 1999; Magkos and Kavouras, 2005).
Due to the parallel effect on both the neuronal and vascular systems, caffeine can alter the coupling between CBF and CMRO2.
Converging evidence has been found with PET and MR techniques, indicating a reduction in baseline CBF (Cameron et al., 1990; Field et al., 2003) and an increase in task-induced fractional increase in CBF for regular caffeine consumers (Chen and Parrish, 2009a; Griffeth et al., 2011). Both CBF and BOLD induced cerebrovascular CO2
reactivity (CVR) changes are reported not to be significant (Chen and Parrish, 2009b; Vidyasagar et al., 2013). Contrasting results have been found for the effects on oxygen consumption. In fact, the most relevant MR studies find decreases in relative stimulus-induced changes in CMRO2(Chen and Parrish, 2009a; Griffeth et al., 2011), which then
translates into increased (Chen and Parrish, 2009) or unchanged (Griffeth et al., 2011) measured BOLD contrast. Regarding absolute oxygen metabolism, there is an insufficient body of research to support any specific direction of the effect of caffeine, with increase
(Griffeth et al., 2011), non-significant decrease (Yang et al., 2015) and no change (Xu et al., 2015) in CMRO2 being reported. To our
knowledge no MR study has mapped grey matter OEF and absolute CMRO2after caffeine consumption.
Within the framework of a dual calibrated fMRI experiment, we estimate the effects of caffeine using a forward model recently devel-oped in our lab (Germuska et al., 2016), that describes analytically the contributions of CBF and of the measured end tidal partial pressures of CO2and O2(PetCO2, PetO2respectively) to the measured dual echo
GRE signal. With this method we are able to estimate quantitative maps of four parameters across grey matter: OEF, CBF, CBF-related CVR (defined as the percent change in CBF due to CO2) and CMRO2. In
parallel to these, measures of CBF and tissue arrival time (TAT) are provided, by multi-inversion time ASL (mTI-ASL) acquisitions.
Materials and methods
Participants and caffeine administration
Sixteen healthy caffeine consumers (8 males, age=24.7 ± 5.1) were recruited to the study. Exclusion criteria paid particular attention to respiratory tasks (asthma, smoking, cold/flu) and to potential interac-tions with caffeine effects (drug dependency, regular medications altering systemic haemodynamics, prior negative reaction to caffeine). Volunteers’ tolerance of hypercapnic periods and breathing through a face-mask was tested with a non-MRI session held in the days before thefirst MRI scanning session. Caffeine intake was assessed with a self-reported retrospective log of weekly caffeine consumption that quanti-fied the use of coffee, tea, cola, chocolate and other caffeine-containing drinks, dietary supplements and over the counter medications (Addicott et al., 2009). Volunteers that were low to moderate caffeine consumers (between 51 and 298 mg/day, mean 154.1 ± 76.2 mg/day), did not match exclusion criteria and successfully undertook the non-MRI session were included in the study. The study was approved by the local ethics committee. Written informed consent was obtained from each participant.
Participants were asked to abstain from caffeine containing drinks, food, pharmaceuticals and alcohol from the evening before the scan-ning day (9 pm) and to have a light meal not later than one hour before the visits to our lab. The caffeine dose administered was 250 mg (roughly equivalent to the caffeine present in 2 cups of ground coffee), chosen not to exceed the recommended daily limit to avoid adverse effects in low to moderate users (300 mg,Fredholm et al., 1999). This is consistent with quantities used in previous studies, typically ranging between 200 and 300 mg (Perthen et al., 2008; Vidyasagar et al., 2013; Yang et al., 2015). The choice of excluding high consumers and caffeine-naïve volunteers was made to maximize the chance of avoiding strong withdrawal effects and unexpected reactions to caffeine respec-tively.
Experimental design
Fig. 1 illustrates the experimental design. Each participant was scanned on two different days (30.1 ± 18.8 days apart, same time of the day), each day including the same protocol with a pre-dose scan session followed by the delivery of the capsule of drug or placebo (randomized order for males and females) andfinally a post-dose scan session.
The pre-dose sessions included an anatomical T1-weighted scan (when not already available for the participant) then a multi inversion time ASL (CBF) scan (mTI scans) and a dual calibrated fMRI scan (dcFMRI scan), giving a duration of about 40 min. The post-dose sessions instead included a mTI CBF scan followed by a dcFMRI scan andfinally another mTI CBF scan, giving a total duration of about 50 min.
Each dcFMRI scan contained an 18 min respiratory task, with interleaved periods of hypercapnia, hyperoxia and medical air being
delivered to the subjects according to the optimized protocol previously proposed by our lab (Germuska et al., 2016).
At the end of thefirst scan session the subjects were removed from the MRI scanner and given a capsule containing either 250 mg of powdered caffeine or placebo (cornflour). Caffeine was administered in a double-blind, crossover, placebo-controlled, randomised manner. This was followed by a 30 min pause for the caffeine absorption, during which the subjects were allowed to relax and consumed nothing other than water. After this time, they were led back to the MR suite for the post-dose scanning session. Based on the reported drug kinetics (Fredholm et al., 1999), we expected the plasma levels of caffeine to stay approximately stable for the duration of the second dcFMRI acquisition, that started about 45 minutes after the capsule adminis-tration.
At the beginning and end of each scanning day, volunteers were asked to fill in a Mood and Physical Sensations Scale questionnaire (MAPSS), in order to evaluate their mental and physical state (Rogers et al., 2010).
Salivary samples
A total of 6 salivary samples (3 for each day) was taken from each volunteer in order to assess the caffeine content of saliva over time, an index of plasma caffeine level (Fredholm et al., 1999). The sample consisted of a swab (Salivette®) that the participants chewed for one minute. Before the first sample, subjects were asked to rinse their mouth with water in order to reduce contamination. On each scanning day samples were taken pre-dose and approximately 30 and 60 min-utes post-dose (“pre”, “post1” and “post2” respectively, seeFig. 1).
Respiratory task
The respiratory task followed the optimized design proposed by our lab (Germuska et al., 2016), with three periods of hypercapnia interleaved with two periods of hyperoxia similarly to interleaved paradigms adopted in other studies (Bulte et al., 2012; Wise et al., 2013), for a total duration of 18 minutes (seeFig. S-1,C). In order to achieve hypercapnia,fixed inspired values of CO2(5%) were
adminis-tered. To achieve hyperoxia 50% O2 was administered. In addition
short periods of respectively 100% O2(14 s) and 10% O2(40 s) were
used in order to accelerate the transition to hyperoxia and the subsequent return to normoxia. The short duration of hypoxic mixture inhaled did not induce arterial hypoxia. Supplies of 5% CO2(balance
air), 10% O2(balance N2), 100% O2and medical air were delivered at a
totalflow rate of 25 l/min to the gas mixing chamber which was placed
in the MR control room and connected to the breathing circuit through a humidifier. An independent O2backup cylinder was also connected
directly to the breathing circuit for safety reasons.
The gas delivery system consisted of a laptop personal computer using in-house Matlab software (Mathworks, Natick, MA, USA) to control the voltage output from a NI-DAQ AD converter (National Instruments, Austin, TX). The output voltages were then fed into four massflow controllers (MKS Instruments, Wilmington, MA, USA) that administered the gas at the requiredflow rate. The respiratory circuit adopted was based on that of Tancredi and colleagues (Tancredi et al., 2014). Gas levels were sampled from the volunteer's facemask and tidal partial pressures of O2 and CO2 were measured and recorded using
rapidly responding gas analysers (AEI Technologies, Pittsburgh, PA, USA).
fMRI data acquisitions
Scanning was performed on a 3 T GE HDx MRI system (GE Healthcare, Milwaukee WI) with a body transmit coil and 8-channel head receive coil. All participants underwent (or had available) whole brain T1-weighted structural scans (3D FSPGR, 1×1×1 mm voxels, TI/ TR/TE=450/7.8/3 ms).
For the mTI pulsed ASL acquisition, dual-gradient echo (GRE) readout and spiral k-space acquisition imaging was used with the following acquisition parameters: TE1=2.7 ms, TE2=29 ms, ma-trix=64×64, voxel size=3x3×7 mm3, slice gap=1 mm, 12 slices.
Automated linear shimming with the built-in software (GE HDx) was performed. Perfusion weighting on the two scans included four equally spaced inversion times each: 150, 300, 450, 600 ms (sh. mTI inFig. 1) and 1000, 1400, 1800, 2200 ms (lo. mTI in Fig. 1). The proximal inversion and control for off-resonance effects (PICORE) tagging scheme was used with a quantitative imaging of perfusion using a single subtraction (QUIPSS II) cutoff at 700 ms for TI > 700 ms. Label thickness was 200 mm with a 10-mm gap between the distal end of the labelling slab and the most proximal imaging slice. Variable repetition time was used in both cases, such that imaging time was minimized. Twenty control–tag pairs were acquired for each inversion time, resulting in a total acquisition time of about 3.5 and 6 minutes respectively.
For the dcFMRI acquisition, simultaneous perfusion and BOLD imaging data was collected using a PASL PICORE, QUIPSS II imaging sequence with a dual-gradient echo (GRE) readout and spiral k-space acquisition with the same acquisition parameters as the mTI scans, except for the use of a single inversion time (TI2=1500 ms), a set repetition time (TR=2.2 s) and acquiring 490-volumes (245 tag-control pairs).
All mTI and dcFMRI scans were preceded by two calibration scans. Thefirst consisted of a single shot spiral k-space scan to estimate the equilibrium magnetization of brain tissue (M0), used for perfusion
quantification (Çavuşoǧlu et al., 2009), with the same acquisition parameters as for the perfusion-weighted scans, except for being acquired with fully relaxed magnetization and no labelling. The second was a low resolution, minimal contrast image used for coil sensitivity correction (Wu et al., 2011), with the same acquisition parameters as for the equilibrium magnetization scan, except for TE=11 ms and TR=2 s.
Behavioural data
Mood, Alertness and Physical Sensations Scales (MAPSS) was used to measure anxiety, alertness, and headache (Rogers et al., 2010). The scale comprised 15 questions to which participants were instructed to rate mood and physical sensation states according to how they were feeling“at the moment” using an eight-point unipolar scale, where 1 represented‘not at all’ and 8 represented ‘extremely’. Participants were instructed:‘There are no right or wrong answers. Do not spend too much time on any one statement but give the rating which seems to best describe your present feeling’.
Three aspects of mood were rated on unipolar scales: energetic mood (sleepy–energetic), tense mood (tense–relaxed) and hedonic tone (sad/gloomy–happy/cheerful). One item assessed mental alert-ness. The physical sensation descriptors were clear-headed–muzzy/ dazed, light-headed/ feeling faint, jittery/shaky, and headache.
The code used in this manuscript is openly available from the Cardiff University data archive http://dx.doi.org/10.17035/d.2016. 0008251305. However, due to ethical considerations open access cannot be given to the in vivo subject data or data derived from this.
Data analysis
dcFMRI data and end-tidal traces
dcFMRI data were pre-processed with motion correction (MCFLIRT (Jenkinson et al., 2002)) and brain extraction (Smith, 2002) and spatially smoothed with a Gaussian kernel of 6 mm with SUSAN (Smith and Brady, 1997), separately for echo 1 and echo 2. Calculation of physiological parameters of interest was performed with a Bayesian framework of analysis applied to the forward model previously developed in our lab (Germuska et al., 2016), whose defining equations are reported in the Appendix for reference. For the purpose of this study, the estimated scaling parameter K is considered as a lumped parameter, with no explicit physiological connotation (see Eq. A-2 in the Appendix). This is justified by the parametrisation of the model according to that previously proposed by our centre (Merola et al., 2016), that only allows us to model K in a numerical fashion. The Gaussian priors on estimates were defined specifying means and standard deviations (mean,std.) as OEF=(0.35,0.1), CBF=(60,Inf) ml/100 g/min, CVR=(3,0.774) %/mmHg, K=(0.07,0.087), where by“Inf” we mean a non-informative prior. Non-informative priors are used to initialize the estimate without carrying information, therefore they can be thought of as uniform distributions of probability. No prior is defined on the estimates of CMRO2as this is calculated as CMRO2=CBF·OEF·CaO2, where CaO2is
the arterial concentration of oxygen. Other parameters were kept the same as those reported in the original work (Germuska et al., 2016). The inputs to the framework are dual echo GRE images and, PetO2and
PetCO2 traces, then analytic models describing the magnetization
decay occurring at thefirst and second TE were used to estimate grey matter maps of OEF, CBF, CVR and CMRO2. Prior to analysis, the
end-tidal responses were visually aligned with the MR data to remove the influence of any bulk delay between the recorded end-tidal traces and the fMRI data. The resulting maps were registered into anatomical space andfinally to MNI space (using FSL FLIRT, (Jenkinson et al., 2002)) for second level analysis.
Mean grey matter values of each estimated parameter were calculated for the four scans and masked for I) partial volume grey matter values (based on MNI space priors) greater than 30% and then II) estimated values of CBF within the range [0 200] ml/100 g/min. The first criterion was imposed as an empirical threshold to avoid values affected by poor SNR of the signal in white matter, while the second was used to exclude non-physiological values. Moreover results from one subject (s16) were excluded for their poor quality in a single acquisition, with abnormally unsteady end-tidal values due to the very irregular breathing pattern that made estimation unfeasible. Therefore the subsequent statistical analyses were carried out on N=15 subjects. T-tests were used to examine the significance of differences between caffeine and placebo in the percentage change of estimated parameters from pre to post condition.
Group-level voxel-wise analyses were performed. For each para-meter the differences from pre to post condition with placebo were tested against those obtained with caffeine with a paired t-test. In order to do this, anatomical T1-weighted images werefirst registered to the
MNI152 standard space with the FSL program FNIRT (Andersson et al., 2007) and the obtained transformations were then applied to the estimated maps. T statistics were then calculated on the map in MNI 152 standard space with the AFNI program 3dttest++ (Cox, 1996) and thresholded with a voxel-wise significance level of αv=0.01 and a
cluster-wise level ofαc= 0.05 with minimum size of 246 mm3, as
estimated with the AFNI program cdf (Cox, 1996).
In addition, a ROI analysis was carried out to further investigate the spatial distribution of the estimated parameters at a group level. Mean changes in estimated parameters from pre to post condition in caffeine and placebo are reported for seven different ROIs: caudate nucleus, frontal lobe, insula, occipital lobe, parietal lobe, putamen and thala-mus. For this analysis the issue of multiple comparisons between ROIs was dealt with a false discovery rate (FDR) correction (Benjamini and Hochberg, 1995), which allowed us to control the expected proportion of falsely rejected hypotheses.
Multiple inversion time ASL data
Data were analysed using a two-compartment model developed by Chappell and colleagues (Chappell et al., 2010) which attenuates the error in CBF estimates due to signal arising from intravascular blood by modelling its effect on the ASL signal. In particular, the oxford_asl program– included in the FSL BASIL toolkit – was used, allowing us to obtain unscaled CBF maps, along with estimated arterial blood volume (aCBV, if found to significantly contribute to the signal) and tissue arrival time (TAT). CBF quantification and coil sensitivity correction were then performed as for the dcFMRI data.
Mean grey matter values of CBF and TAT were calculated for the six scans and masked following the same criteria adopted for the dcFMRI data. Note that in this case the factor measurements were taken in three time points (“pre”,”post1” and “post2”).
Finally t-tests were performed voxel-wise for CBF and TAT to localise possible spatial distributions of the caffeine effects as per the dcFMRI data. The registration of the maps from subject space to MNI152 standard space was carried out with FNIRT (Andersson et al., 2007), while t statistics were calculated with the AFNI program 3dttest ++ (Cox, 1996) and thresholded with a voxel-wise significance level of αv=0.01 and a cluster-wise level ofαc=0.05 with minimum volume size
of 246 mm3. For ease of comparison with the results obtained from
dcFMRI data, t-tests were only performed with differences between the pre and post2condition.
In addition to calculating CMRO2from the single inversion time
ASL acquisition CBF estimates during dcFMRI, CMRO2 was also
calculated using Eq. A-10 from the multiple inversion time CBF estimates, yielding CMRO2,mTI.
Behavioural data
the MAPPS, to test for differences in the effect of the two factors considered, that is 1)“drug” (i.e. caffeine or placebo) and 2) “dosing” (i.e. pre or post dose).
Results
Salivary sample data
Concentrations of caffeine from the salivary samples are reported for all subjects inFig. 2. These show that the levels of caffeine in saliva are significantly different from baseline (“pre” condition) at thirty minutes post caffeine ingestion and continue to rise from a mean of 2.08 mg/l to a significantly higher mean value of 4.1 mg/l between post-caffeine 1 and post-caffeine 2 samples. Concentrations remain constantly low for placebo.
dcFMRI data and respiratory traces
The end-tidal traces for a single representative subject (s12), the end-tidal traces averaged across all subjects and the respiratory task can be found in the supplementary material (Fig. S-1). The average baseline PetO2 value was 113 mmHg, while it was 39 mmHg for
PetCO2. The average change in PetCO2 from baseline was 12 mmHg
during hypercapnia, while plateau levels of hyperoxia caused an average increase of approximately 211 mmHg in PetO2. Subject (s16)
was excluded due to and irregular breathing pattern and subsequent poor end-tidal traces (data not shown).
Grey matter mean values of all the estimated parameters for the four conditions considered are reported inFig. 3. Changes from“pre” to “post” conditions are not found to vary significantly for any parameters for placebo administration. By contrast, with caffeine a significant increase is found for OEF and CVR, with values changing form 0.42 ± 0.067 to 0.48 ± 0.066 (Fig. 3, A) and from 2.2 ± 0.50 to 2.5 ± 0.36 (Fig. 3, C) %/mmHg respectively. Also, with caffeine significant decreases are found for CBF and CMRO2, with values changing from
65 ± 12.3 to 45 ± 6 (Fig. 3, B) ml/100 g/min and from 233 ± 48.3 to 188 ± 35.9 (Fig. 3, D)μmol/100 g/min respectively. Finally inFig. 3, E, results for CMRO2calculated using the CBF estimates obtained from
the mTI (CMRO2,mTI) analysis is shown to significantly decrease from
173 ± 29.2 to 134 ± 31μmol/100 g/min. For completeness, calculated grey matter values (mean and standard deviation) for all the physio-logical parameters can be found in the supplementary material (Table S-2 and S-3).
Fig. 4shows the mean grey matter percent change from the pre to post condition for all parameters in the caffeine and placebo sessions. Differences between the percent changes between the two sessions are found significant in a paired t-test for OEF, showing an increase of 15.6% (sd ± 18.9%, p < 0.05), and CBF, CMRO2 and CMRO2,mTI
showing a decrease of−30.4% (sd ± 6.1%, p < 0.01), −18.6% (sd ± 11.1%, p < 0.01) and −22.3% (sd ± 14.7%, p < 0.05) respectively following caffeine consumption.
Figs. 5 and 6show results from voxel-wise analysis of the estimated cerebral physiological parameters. InFig. 5are examples of grey matter values of estimated maps registered to MNI152 standard space for a single representative subject (s12) before and after caffeine consump-tion (“pre” and “post” condition respectively). These maps are con-sistent with the mean trend, with values of CBF and CMRO2generally
decreasing while values of OEF and CVR are increasing. Besides they are representative of the variability of the result, with generally spatially smooth results for OEF as opposed less smooth estimates for CVR. In these maps it is also possible to see areas where the algorithm fails in its estimates (indicated by arrows inFig. 5).
Fig. 6displays thresholded t values from the group t-test performed between the differences from pre to post condition with caffeine and placebo. Areas of significant change are found for all parameters. More information on the size and coordinates of these for OEF and CMRO2
can be found in the supplementary material (Table S-4 and S-5). CBF shows widespread and highly significant decrease due to caffeine. CMRO2also shows areas of significant decrease, but they are more
localized. Conversely, results from OEF and CVR indicate areas of increase due to caffeine, with the latter being confined to only few significant areas. None of the parameters showed mixed directions of significant effects.
Finally, Fig. 7 shows the results of a ROI analysis to further investigate the spatial distribution of the estimated parameters at a group level. Mean changes from pre to post condition in caffeine and placebo are reported for seven different ROIs. These show the effect of caffeine being consistently significant for CBF (Fig. 7, B), while being more varied for the others. OEF (Fig. 7, A) changes are significant in the caudate nucleus, putamen and thalamus (ROIs 1, 6 and 7). CVR does not show significant effects, with measurements characterized by high variance across regions. Finally, decreases in CMRO2(Fig. 7, D)
are only significant in occipital lobe and parietal lobe (ROIs 4 and 5). Values of CMRO2,mTI (Fig. 7, E) confirm these findings and also
highlight a significant decrease in the frontal lobe (ROI 2). Multiple inversion time haemodynamic estimates
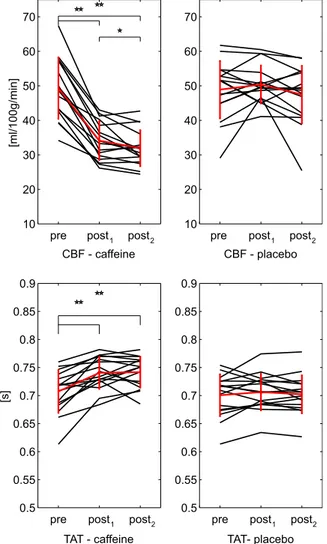
Mean grey matter values of all the estimated CBF and TAT for the six conditions considered are reported inFig. 8. Changes from baseline are not found significant for placebo. Instead, in caffeine a significant decrease (p < .01) is found for CBF from 49 ± 8.9 ml/100 g/min before caffeine delivery to 34 ± 5.6 ml/100 g/min after thirty minutes and then to 32 ± 5.2 ml/100 g/min after sixty minutes. Also the last two show a significant difference, even though less strong (0.01 < p < 0.05). TAT values for caffeine show a significant increase from 0.71 ± 0.038 s in the pre to 0.74 ± 0.029 s at post1and then to 0.74 ± 0.028 s at post2.
Finally in Fig. 9 t statistics resulting from a group-level test performed between differences from pre to post2condition in caffeine
and placebo are reported. CBF shows a general significant decrease across grey matter. TAT shows more restricted areas of significance, with both a positive and negative direction of change.
Behavioural data
The analysis of behavioural data showed no significant effects of caffeine, with the highest F value (F=6.22, p=0.015) indicating a decrease in feeling relaxed after having ingested the capsule (p value not significant when corrected for multiple comparisons). Mean caffeine
[mg/l]
pre post1 post2 0 1 2 3 4 5 6 7 8 9 placebo pre post1 post2 0 1 2 3 4 5 6 7 8 9
Fig. 2. Values of caffeine salivary concentration for the three samples in each day (“caffeine” or “placebo”). Significance of t-tests reported (**p < .01).
changes from pre to post condition show a non-significant trend of caffeine reducing sleepiness, fatigue and headache while increasing energetic mood and jitteriness compared to placebo. These results are shown in the supplementary material section (Table S-6).
Discussion
We have shown a generalised effect of a 250 mg dose of caffeine across
cerebral grey matter to decrease CMRO2(−19 ± 3 mean ± SEM%) using
dual calibrated fMRI and a forward modelling approach to parameter estimation. The measured CMRO2 decrease is the net result of two
competing observations: substantial decreases in CBF (30% reduction) and fractionally smaller increases in OEF (16%) that partially counteract the reduced oxygen delivery to the capillary bed. The haemodynamic findings, a reduction in CBF, confirm earlier reports (Cameron et al., 1990; Field et al., 2003). The reduction in the rate of cerebral oxygen
OEF - caffeine
CBF - caffeine
CBF - placebo
0 0.2 0.4 0.6 0.8 1 0 0.2 0.4 0.6 0.8 1 [ml/100g/min] 30 40 50 60 70 80 90 100 30 40 50 60 70 80 90 100
CVR - caffeine
[%/mmHg]CVR - placebo
1 1.5 2 2.5 3 3.5 4 1 1.5 2 2.5 3 3.5 4A
B
C
D
E
CMRO2,mTI- caffeine
pre post
CMRO2,mTI- placebo
pre post 100 150 200 250 300 350 100 150 200 250 300 350 CMRO2- caffeine pre post 100 150 200 250 300 350 CMRO2- placebo pre post 100 150 200 250 300 350 [μ ]ni m/ g0 01/ lo m [μ ]ni m/ g0 01/ lo m
OEF - placebo
pre post pre post
pre post pre post
pre post pre post
Fig. 3. Values of caffeine salivary concentration for the three samples in each day (“caffeine” or “placebo”). In black individual subjects, in red the calculated means with bars representing the standard deviations. Significance of t-tests reported (**p < .01).
metabolism contrasts with reports from some other MRI studies that show both increases (Griffeth et al., 2011) and no change (Xu et al., 2015) in CMRO2, while it is consistent with other recentfindings reporting a
decrease, using simultaneous near-infrared spectroscopy and transcranial Doppler ultrasound (Yang et al., 2015), and FDG-PET (Park et al., 2014). However, the latter study only reports localised reductions in relative cerebral glucose metabolism (CMRGlu). Furthermore, reductions in CMRGlu are not certain to lead to reductions in CMRO2as alterations
in aerobic glycolysis (Vaishnavi et al., 2010) could lead to differences in the degree to which CMRO2and CMRGlu change with caffeine
admin-istration.
The reduction in CMRO2found lies at the upper end of what one
might expect to see with a commonly consumed substance that does not have a profound effect on consciousness. However, the reduction in CMRO2 is considerably smaller than for interventions causing
sub-stantial suppression of electrophysiological activity, such as, anaes-thetics and hypothermia (−52% for etomidate in dogs (Milde et al., 1985);−44% for propofol in humans (Newman et al., 1995);−58% for −8 °C hypothermia in humans, (Newman et al., 1995); −64% for −10 °C hypothermia in humans (Croughwell et al., 1992)).
The observations of reduced CMRO2are somehow counterintuitive
when considering the known effects of caffeine on neuronal activity. In fact, the increase in neuronal firing produced by caffeine might be expected to yield an overall increase in the energetic metabolism. A possible explanation for our results can be offered by a hypothesis of decrease in energetic demand due to a net inhibitory effect of caffeine. In fact, as caffeine disinhibits both excitatory and inhibitory neurons, alterations of the total energy demand can result from changes in the local balance between the activity of the two populations (Buzsáki et al., 2007; Logothetis, 2008). This means that while, in areas dominated by excitatory activity, the energy demand might be unaltered (or even increased), the energy demand overall might decrease where the inhibitory activity substantially down-regulates excitatory activity. A key role in this mechanism is likely to be played by the different affinities of adenosine receptors and their spatial distribution (Fredholm et al., 1999; Laurienti et al., 2003; Pelligrino et al., 2012). As the caffeine dose used in this study is relatively high, a dose dependent mechanism might also modulate these processes, although further investigation would be needed to explore such effects. The hypothesis of a decrease in energetic demand is also partially supported by previous electrophysiology studies finding reductions in spectral power with EEG (Dimpfel et al., 1993; Siepmann and Kirch, 2002) in the resting state following caffeine ingestion.
In particular, the overall inhibitory effect found could be mediated by two distinct mechanisms reportedly induced by caffeine as an antagonist of adenosine receptors: pre-synaptic inhibition of neuro-transmitter release and prevention of post-synaptic depression (Pelligrino et al., 2012). The result of the two would be a decrease in synaptic activity accompanied by increase in spiking activity, the latter being a known result of the caffeine interaction with A1 receptors (Fredholm et al., 1999). As the metabolic demand of the first is predominant in the total energetic balance of neural activity (Raichle and Gusnard, 2002), a decrease in oxygen metabolism might be expected to result from caffeine.
As grey matter maps were estimated for all parameters, we were able to carry out voxel- and ROI-wise analyses at a group level in order to investigate the spatial distribution of the caffeine effects. The significant caffeine effects were widespread for CBF (single and multi-TI ASL data), as expected due to adenosine receptors being widespread over all grey matter. Areas of significant caffeine effect were instead more restricted for OEF, CMRO2and CVR. Notably, in the ROI
analysis, significant changes in OEF were localized to the putamen, caudate nucleus and thalamus, where the highest concentrations of A1 and especially A2 receptors have been reported (Svenningsson et al., 1997; Fukumitsu et al., 2003; Ishiwata et al., 2005). These regions show the least difference in CMRO2between pre and post dose, with
values not significantly different between the two conditions. This behaviour, confined to a few subcortical structures, is in contrast with the general grey matter tendency and may reflect the spatially varying effects of the A1 and A2 receptors and their relative expression in these specific areas (Laurienti et al., 2003) and possibly representing the above mentioned areas of local inhibitory activity triggered by caffeine. While the neuro-pharmacological origins of such an effect deserve further investigation, the findings suggest a complex and spatially distributed effect across grey matter that can be characterised with our novel approach, while it cannot be properly captured with bulk measurements or imaging methods that look only at whole brain oxygenation (Xu et al., 2015).
OEF CBF CVR 2CMRO2,mTI
[%]
-60 -40 -20 0 20 40 60Change from baseline
placebo caffeine
CMRO
Fig. 4. Mean grey matter values of percent change between“pre” and “post” condition for all the estimated parameters (N=15, bars representing the standard deviations). Significance of paired t-tests between percent changes are denoted (* < .05, ** < .01).
Fig. 5. Estimated GM maps in MNI space for a single representative subject (s12). Results displayed before and after caffeine consumption (pre and post condition respectively).
Results for group mean grey matter seem to be overestimating CMRO2 when compared to literature, with a resting state value of
242.4 ± 38.4μmol/100 g/min (averaging the results from pre condition in each day) opposed to reported values of 145 ± 30 (Gauthier and Hoge, 2011) and 155 ± 39 μmol/100 g/min (Bulte et al., 2012) obtained with calibrated BOLD methods and values of 182 ± 12 (Liu et al., 2013), 158 ± 18 (Fan et al., 2012) and 125 ± 15μmol/100 g/min (Bolar and Rosen, 2011) obtained with other MR methods and of 157.4 ± 19.7 (Roland et al., 1987) and 120 ± 17.7μmol/100 g/min (Ibaraki et al., 2010) with PET. This overestimate can in part be explained by the young cohort analysed, but can be mostly attributed to the propagation of systematic bias in estimates of CBF from the single inversion time data. In fact our baseline grey matter CBF estimates are 65.8 ± 11.7 ml/100 g/min (averaging the results from pre condition in each day), similar to values of 63 ml/100 g/min reported in other studies with a similar type of single TI acquisition (Ances et al., 2009), whereas typical literature values range between 41 ml/100 g/min (Bulte et al., 2012) and 52 ml/100 g/min (Gauthier and Hoge, 2011). Our estimates of caffeine-induced CBF changes obtained with dcFMRI acquisitions (single TI) are supported by the data from mTI-ASL acquisitions. A similar decrease of 30 and 35% is found when comparing the value in pre to post1and post2conditions respectively
(Fig. 8) and a good correlation is found between the two sets of measurements obtained with the different acquisition approaches (data not shown). However, there is an approximately constant offset between the two estimates, with those obtained from our forward model being about 15 ml/100 g/min higher than those obtained with the mTI model. Estimates from single TI measures, as in the case of the forward model, tend to overestimate CBF compared to those from multi TI measures, due to both assumed constant timings of the labelled bolus (Van Osch et al., 2007) and spurious arterial signal contribution to the ASL signal (Chappell et al., 2010). The overestimate of CBF is likely to explain the high values of CMRO2that we estimate
(as by definition CMRO2=CBF·OEF·CaO2). In fact, CMRO2,mTI
esti-mates based on the mTI CBF data show mean values of about 182μmol/100 g/min in the pre-dose condition, which is more similar to values reported in the literature. Nevertheless, as changes in CBF are consistent between the single and multi TI techniques, our method still enables us to detect drug related changes in CMRO2.
Caffeine salivary concentrations suggest that subjects generally complied with the request of abstaining from caffeine consumption before the experiments. Caffeine saliva concentration increased sig-nificantly from post1 to post2. However, there is variability in the
temporal profile of caffeine salivary concentrations that may reflect different absorption and elimination kinetics. Time to peak values are reported to be between 30 and 45 minutes (Fredholm et al., 1999). Post1mTI-ASL acquisitions might be measuring a changing
haemody-namic state of brain tissue, leading to noisier estimates of CBF and also values of CBF significantly different between post1and post2conditions
(as seen in Fig. 8). On the other hand we do not expect the haemodynamic state to change greatly for the subsequent post dcFMRI acquisitions thanks to the experimental timing.
Data from MAPPS reports did not show significant effects of drug or dosing on the psycho-physical state of the participants. Nevertheless there were non-significant trends indicating that caffeine reduces sleepiness, fatigue and headache and increased energetic mood and jitteriness compared to placebo, which is consistent with effects reported in literature for larger groups of participants (Rogers et al., 2010; Smith et al., 2012). Importantly, values measured with MAPSS and feedback from subjects did not indicate significant adverse reactions to caffeine consumption that could have caused discomfort to the subjects and therefore behaviour capable of degrading the quality of the data (e.g. movements into the scanner).
The analysis and results presented in this work have some limitations worth noting. Thefirst relates to the assumptions that we make when modelling the physiological processes of interest. Of primary importance
Fig. 6. Results of a group t-test performed between differences from “pre” to “post” condition in caffeine and placebo for the dcFMRI data. Each map shows values of the t statistic for which p < 0.01 either in positive or negative direction (t > 3.33 and t <−3.33 respectively, 14 dof), with thresholding for cluster size significance level αc=0.05).
is the hypothesis of isometabolism during hypercapnia and hyperoxia when performing respiratory tasks. The effects of its violation have been investigated and characterised in a previous study from our centre (Merola et al., 2016). Similarly, we also assume that metabolism does not change during the dcFMRI acquisitions. This may not be the case in the post condition of the caffeine day due to possible changes of caffeine plasma concentration, although literature knowledge suggests that the concentration plateaus by the time the acquisition starts (Fredholm et al., 1999). In addition, the value ofθ in our signal model is fixed as per the optimisation previously carried out in our centre (Merola et al.,
2016) and assumed not to change across subjects, tissue or conditions. In realityθ could vary and may be estimable with additional experi-mentation, similarly to what has been proposed for estimating values of α and β (as show in (Chen and Pike, 2009) and (Shu et al., 2016) respectively). However, we took a pragmatic approach offixing θ as a trade-off between the complexity of our acquisition and the sensitivity to the underlying physiological variability. In fact, analogous assumptions ofα and β have been made for a successful body of calibrated BOLD studies. Part of this success is related to the fact that despite the parametersα and β of the Davis model (Davis et al., 1998) being not
1 2 3 4 5 6 7 -0.2 -0.1 0 0.1 0.2
0.3
POST-PRE condition - OEF
placebo caffeine 1 2 3 4 5 6 7
[ml/100g/
min]
-40 -30 -20 -10 0 10POST-PRE condition - CBF
placebo caffeine 1 2 3 4 5 6 7[%/mmHg]
-1 -0.5 0 0.5 1POST-PRE condition - CVR
placebo caffeine 1 2 3 4 5 6 7 -150 -100 -50 0 50100 POST-PRE condition - CMRO2
placebo caffeine 1 2 3 4 5 6 7 -150 -100 -50 0 50
100 POST-PRE condition - CMRO2,mTI
placebo caffeine
[μ
]ni
m/
g0
01/
lo
m
B
A
D
C
[μ
]ni
m/
g0
01/
lo
m
E
Fig. 7. Mean differences from “pre” to “post” condition in caffeine and placebo for each parameter in different ROIs. Bars represent standard deviations. Significance of t-tests is denoted (* < .05, ** < .01, fdr corrected). ROIs considered: 1– caudate nucleus; 2 – frontal lobe; 3 – insula; 4 – occipital lobe; 5 – parietal lobe; 6 – putamen; 7 – thalamus.
necessarily homogeneous across the brain or different conditions, the physiological model is still able to effectively explain the relationship between BOLD, CBF and CMRO2, as found by different groups and well
summarised by Griffeth and Buxton (Griffeth and Buxton, 2011). The choice of the parameterθ also results into the definition of K as
a lumped parameter, which is dependent, among other things, on the baseline cerebral blood volume. Nevertheless, it is worth noting that this formulation results in unbiased estimates of OEF, as found in a previous study from or centre (Merola et al., 2016).
Another limitation is represented by the reliability of individual results. In fact, while values of the parameters averaged across grey matter lie within physiological ranges and show generally plausible trends (as seen in Fig. 3), individual maps include several outliers (Fig. 5). This is mainly due to low SNR of the MR signal and variability of the respiratory traces, which tend to bias or even prevent the estimates in some voxels. If this represents a shortcoming on one hand, on the other hand it demonstrates that the estimates are not driven by Bayesian priors as also suggested by the existence of limited areas where the method fails to output valid values (highlighted inFig. 5). At current SNR levels in the acquisition, this limits the use of the technique to group analysis, for which it is still possible to detect areas of significant drug effect both in a voxel-wise and ROI-wise manner. A trade-off between repeatability and spatial resolution has to be considered when comparing our estimates to bulk measurements of fewer parameters. In fact, this represents the first MR approach supplying a detailed description of the acute effects of caffeine on brain metabolism and haemodynamics with grey matter maps of OEF and absolute CMRO2values.
A SNR limitation also prevents measurements across white matter, where the signal is lower mainly due to the reduced cerebral bloodflow and longer arrival time of the arterial spin label. In principle, with a better SNR, the estimation framework could also be applied to white matter following few modifications; for example the physiological model relating BOLD and ASL signals to oxygen metabolism would need to be optimised for the new context. Potential improvements could be introduced with higher magneticfields, head receive coils with higher number of channels or background suppression techniques.
Finally some caution in the interpretation of the results is more specifically related to the caffeine effects we are characterizing with the Bayesian estimation framework. Because CMRO2=CBF·OEF·CaO2,
detection of changes in CMRO2might simply be triggered by decreases
in CBF with little or no change in OEF. This could be the case, for example, if the model was highly sensitive to changes in CBF but less so to changes in OEF. However, the fact that areas where significant changes in CBF and OEF occur at the same time are showing no significant change in CMRO2 argues against this suggestion (see
caudate nucleus, putamen and thalamus inFig. 7).
In conclusion, we have characterised acute effects of caffeine on brain haemodynamics and oxygen metabolism with the forward signal model in a drug study with a dual calibrated fMRI experiment. The caffeine effects CBF - caffeine
[ml/100g/min]
pre post post 10 20 30 40 50 60 70 1 2 1 2 CBF - placebo pre post post 10 20 30 40 50 60 70 TAT - caffeine [s]
pre post post 0.5 0.55 0.6 0.65 0.7 0.75 0.8 0.85 0.9 TAT- placebo pre post post 0.5 0.55 0.6 0.65 0.7 0.75 0.8 0.85 0.9 1 2 1 2
Fig. 8. Mean grey matter values of the two parameters estimated from mTI data (N=16). In red the calculated means with bars representing the standard deviations. Significance of t-tests between pre, post1and post2condition are denoted (*p < .05, **p < .01).
Fig. 9. Results of group-level t-test performed between differences from “pre” to “post2” condition in caffeine and placebo for the mTI data. Each map shows values of the t statistic for
measured of reduced oxygen consumption and cerebral bloodflow are consistent with those from neurophysiological studies and previous studies of caffeine haemodynamics. New information is provided in terms of spatial distribution of the drug effects on OEF and CMRO2allowing us
to identify particular areas where the drug effects are localized. This represents a major step forward in the understanding of the acute effects of caffeine and it also demonstrates that such a method could be applied to assess grey matter haemodynamics, OEF and CMRO2at a voxel-wise
resolution for other pharmacological agents.
Acknowledgements
AM acknowledges the generous support of the Cardiff University President's Scholarships. RW and MG acknowledge the support of the UK Engineering and Physical Sciences Research Council (EP/ K020404/1) and the Wellcome Trust Institutional Support Fund for this work. KM thanks the Wellcome Trust for its generous support via a Career Development Fellowship (WT090199). RW thanks the Higher Education Funding Council for Wales for support.
Appendix
The Bayesian estimation framework used in this work (Germuska et al., 2016) is based on a forward signal model constructed by combining a detailed description of the arterial spin labelling (ASL) signal developed by Woolrich and colleagues (Woolrich et al., 2006) and a model of the BOLD model developed in our centre (Wise et al., 2013). Computationally, the model exploits a Matlab toolbox for variational Bayesian approaches (VBA) developed and made available by Daunizeau and colleagues (Daunizeau et al., 2014). Here we summarize the equations relating the estimated parameters OEF, CBF, CVR and CMRO2. For a detailed description of the model please refer to the original paper (Germuska et al.,
2016), while the code used for the estimates is available in the Cardiff University data Catalogue athttp://dx.doi.org/10.17035/d.2015.100126. The total MR signal STOTresulting from a dual-gradient echo (GRE) imaging sequence with a PASL PICORE, QUIPSS II scheme for ASL signal
can be expressed as:
STOT=SASLe−TER2,0* (1+∆ */R2 R2,0* ) (A-1)
Where SASLis the ASL signal and the BOLD contribution is accounted for by changes in transverse relaxation rate R2*. As regards the latter, it can be
expressed following the modelfirst proposed by Wise and colleagues (Wise et al., 2013) and then optimised (Merola et al., 2016) as: ⎡ ⎣ ⎢ ⎛ ⎝ ⎜ ⎞⎠⎟ ⎤ ⎦ ⎥ R K dHb f dHb dHb ∆ * = [ ] [ ] [ ] − 1 θ 2 0 0 (A-2) and ⎛ ⎝ ⎜ ⎞ ⎠ ⎟ f = 1 +CVR ∆PaCO 100 2 (A-3) Where [dHb] is the deoxy-haemoglobin concentration (0 for baseline), PaCO2is the arterial partial pressure of O2, CVR is the cerebrovascular
reactivity (in %ΔCBF/mmHgCO2),θ is an optimised fitting parameter and K is a lumped parameter depending on cerebral blood volume, field
magnitude, echo time and geometry. Then OEF can be calculated from the expression for [dHb]/[dHb]0proposed by Wise and colleagues (Wise
et al., 2013): ⎡ ⎣ ⎢ ⎛ ⎝ ⎜ ⎞ ⎠ ⎟ ⎛ ⎝ ⎜ ⎞ ⎠ ⎟⎤ ⎦ ⎥ dHb dHb f dHb φ CaO fCaO Hb f [ ] [ ] = 1 − 1 [ ] 1 −1 + [ ] 1− 1 0 0 2 2,0 (A-4) Where [dHb] is the haemoglobin concentration,φ is the O2carrying capacity of haemoglobin (1.34 ml O2/gHb) and CaCO2is the arterial O2content.
The ASL contribution SASLcan also be expressed, following Woolrich model (Woolrich et al., 2006), as a sum of a static component (Ss) and a
component due to perfusion (Sb):
SASL= Ss+Sb (A-5)
Where the static component is expressed in terms of changes in voxel magnetization M:
Ss= M0(1 + ∆M M/ 0) (A-6)
So that changes in M0are assumed to derive from a change in blood volume and water exchange. The perfusion component is then expressed in
terms of changes of CBF and the kinetic PASL model:
Sb=M0,blood·CBFo· (1 +CVR· ∆PaCO2/100) · {[TI1· (P en −TI T2 1/ b+ (1 −e−TI T2 1/ b))] + [(TI2−TI1−δt) · (1 −e−(TI2−TI1)/T1b+δt)]} (A-7) Where M0,bloodand T1bare respectively the baseline magnetization and the longitudinal relaxation time of blood, Pnis−1 for tag and 1 for control
andfinally TI1, TI2andδt are respectively time to saturation, time to imaging and transit time as defined by the QUIPSS II tagging scheme. The
relationship between PaO2and arterial T1bis taken to be linear (as per Ma and colleagues, (Ma et al., 2014)) and described by:
T1,b=bPaO2+c (A-8)
The unknown parameters werefixed to literature values, with b = − 5×10⁻⁴(extrapolated from Ma and colleagues, (Ma et al., 2014)) and c = 1.78
(from Lu and colleagues, (Lu et al., 2004)). As regards the contribution of PetO2and to PetCO2to calculated CaO2andΔPaCO2respectively, local
variation of the haemodynamic response (hr(t)) was allowed modelling each of them separately as gamma-variate functions:
with tmax(fixed to 0.2 s) denoting the time of peak and ηifree parameter determining the rise and fall times of the response (with i = CO2, O2).
Finally CMRO2is calculated as:
CMRO2=OEF CBF Ca O· · 2 (A-10) Supplementary material
Supplementary data associated with this article can be found in the online version atdoi:10.1016/j.neuroimage.2017.03.028.
References
Addicott, M. a, Yang, L.L., Peiffer, A.M., Laurienti, P.J., 2009. Methodological considerations for the quantification of self-reported caffeine use.
Psychopharmacology 203, 571–578.http://dx.doi.org/10.1007/s00213-008-1403-5. Ances, B., Liang, C., Leontiev, O., 2009. Effects of aging on cerebral blood flow, oxygen metabolism, and blood oxygenation level dependent responses to visual stimulation. Hum. Brain Mapp. 30, 1120–1132.http://dx.doi.org/10.1002/hbm.20574.Effects. Andersson, J.L.R., Jenkinson, M., Smith, S.M., 2007. Non-Linear Registration aka
Spatial Normalisation FMRIB Technial Report TR07JA2. In Pract. 22. Bauer, A., Holschbach, M.H., Meyer, P.T., Boy, C., Herzog, H., Olsson, R.A., Coenen,
H.H., Zilles, K., 2003. In vivo imaging of adenosine A1 receptors in the human brain with [18F]CPFPX and positron emission tomography. Neuroimage 19, 1760–1769. http://dx.doi.org/10.1016/S1053-8119(03)00241-6.
Benjamini, Y., Hochberg, Y., 1995. Controlling the false discovery rate: a practical and powerful approach to multiple testing. J. R. Stat. Soc. 57, 289–300.
Bolar, D.S., Rosen, B.R., 2011. QUantitative Imaging of eXtraction of oxygen and TIssue consumption (QUIXOTIC) using venular‐targeted velocity‐selective spin labeling. Magn. Reson. Med. 66, 1550–1562.http://dx.doi.org/10.1002/mrm.22946. Bulte, D.P., Kelly, M.E., Germuska, M. a, Xie, J., Chappell, M. a, Okell, T.W., Bright,
M.G., Jezzard, P., 2012. Quantitative measurement of cerebral physiology using respiratory-calibrated MRI. Neuroimage 60, 582–591.http://dx.doi.org/10.1016/ j.neuroimage.2011.12.017.
Buzsáki, G., Kaila, K., Raichle, M.E., 2007. Inhibition and brain work. Neuron 56, 771–783.http://dx.doi.org/10.1016/j.neuron.2007.11.008.
Cameron, O.G., Modell, J.G., Hariharan, 1990. Caffeine and human cerebral blood flow : a positron emission tomography study. vol. 47, pp. 1141–1146.
Çavuşoǧlu, M., Pfeuffer, J., Uǧurbil, K., Uludaǧ, K., 2009. Comparison of pulsed arterial spin labeling encoding schemes and absolute perfusion quantification. Magn. Reson. Imaging 27, 1039–1045.http://dx.doi.org/10.1016/j.mri.2009.04.002.
Chappell, M. a, Macintosh, B.J., Donahue, M.J., Günther, M., Jezzard, P., Woolrich, M.W., 2010. Separation of macrovascular signal in multi-inversion time arterial spin labelling MRI. Magn. Reson. Med. 63, 1357–1365.http://dx.doi.org/10.1002/ mrm.22320.
Chen, J.J., Pike, G.B., 2009. BOLD-specific cerebral blood volume and blood flow changes during neuronal activation in humans. NMR Biomed., 1054–1062.http:// dx.doi.org/10.1002/nbm.1411.
Chen, Y., Parrish, T.B., 2009a. Caffeine dose effect on activation-induced BOLD and CBF responses. Neuroimage 46, 577–583.http://dx.doi.org/10.1016/
j.neuroimage.2009.03.012.
Chen, Y., Parrish, T.B., 2009b. Caffeine's effects on cerebrovascular reactivity and coupling between cerebral bloodflow and oxygen metabolism. Neuroimage 44, 647–652.http://dx.doi.org/10.1016/j.neuroimage.2008.09.057.
Cox, R.W., 1996. AFNI: software for analysis and visualization of functional magnetic resonance neuroimages. Comput. Biomed. Res. 29, 162–173.
Croughwell, N., Smith, L.R., Quill, T., Newman, M., Greeley, W., Kern, F., Lu, J., Reves, J.G., 1992. The effect of temperature on cerebral metabolism and blood flow in adults during cardiopulmonary bypass. J. Thorac. Cardiovasc. Surg. 103, 549–554. Daunizeau, J., Adam, V., Rigoux, L., 2014. VBA: a probabilistic treatment of nonlinear
models for neurobiological and behavioural data. PLoS Comput. Biol. 10, e1003441. http://dx.doi.org/10.1371/journal.pcbi.1003441.
Davis, T.L., Kwong, K.K., Weisskoff, R.M., Rosen, B.R., 1998. Calibrated functional MRI: mapping the dynamics of oxidative metabolism. Proc. Natl. Acad. Sci. U.S.A. 95, 1834–1839.
Dimpfel, W., Schober, F., Spiller, M., 1993. The influence of caffeine on human EEG under resting conditions and during mental loads. Clin. Investig. 71, 197–207. Einöther, S.J.L., Giesbrecht, T., 2013. Caffeine as an attention enhancer: reviewing existing assumptions. Psychopharmacology 225, 251–274.http://dx.doi.org/ 10.1007/s00213-012-2917-4.
Ekstrom, A., 2010. How and when the fMRI BOLD signal relates to underlying neural activity: the danger in dissociation. Brain Res. Rev. 62, 233–244.http://dx.doi.org/ 10.1016/j.brainresrev.2009.12.004.
Fan, A.P., Benner, T., Bolar, D.S., Rosen, B.R., Adalsteinsson, E., 2012. Phase-based regional oxygen metabolism (PROM) using MRI. Magn. Reson. Med. 67, 669–678. http://dx.doi.org/10.1002/mrm.23050.
Field, A.S., Laurienti, P.J., Yen, Y., Burdette, J.H., Moody, D.M., 2003. Radiology and Withdrawal : Confounding Variables in Quantitative Cerebral Perfusion Studies? vol. 1, pp. 129–135.
Fredholm, B.B., Bättig, K., Holmén, J., Nehlig, A., Zvartau, E.E., 1999. Actions of caffeine in the brain with special reference to factors that contribute to its widespread use. Pharmacol. Rev. 51, 83–133, (doi:0031-6997/99/5101-0083$03.00/0). Fukumitsu, N., Ishii, K., Kimura, Y., Oda, K., Sasaki, T., Mori, Y., Ishiwata, K., 2003.
Imaging of adenosine A1 receptors in the human brain by positron emission tomography with [11C]MPDX. Ann. Nucl. Med. 17, 511–515.http://dx.doi.org/ 10.1007/BF03006445.
Gauthier, C.J., Hoge, R.D., 2011. Magnetic resonance imaging of resting OEF and CMRO₂ using a generalized calibration model for hypercapnia and hyperoxia. Neuroimage 60, 1212–1225.http://dx.doi.org/10.1016/j.neuroimage.2011.12.056. Gauthier, C.J., Hoge, R.D., 2012. A generalized procedure for calibrated MRI
incorporating hyperoxia and hypercapnia. Hum. Brain Mapp. 34, 1053–1069. http://dx.doi.org/10.1002/hbm.21495.
Germuska, M. a, Merola, A., Murphy, K., Babic, A., Richmond, L., 2016. A forward modelling approach for the estimation of oxygen extraction fraction by calibrated fMRI. Neuroimage 139, 313–323.http://dx.doi.org/10.1016/
j.neuroimage.2016.06.004.
Griffeth, V.E.M., Buxton, R.B., 2011. A theoretical framework for estimating cerebral oxygen metabolism changes using the calibrated-BOLD method: modeling the effects of blood volume distribution, hematocrit, oxygen extraction fraction, and tissue signal properties on the BOLD signal. Neuroimage 58, 198–212.http://dx.doi.org/ 10.1016/j.neuroimage.2011.05.077.
Griffeth, V.E.M., Perthen, J.E., Buxton, R.B., 2011. Prospects for quantitative fMRI: investigating the effects of caffeine on baseline oxygen metabolism and the response to a visual stimulus in humans. Neuroimage 57, 809–816.http://dx.doi.org/ 10.1016/j.neuroimage.2011.04.064.
Hoge, R.D., Atkinson, J., Gill, B., Crelier, G.R., Marrett, S., Pike, G.B., 1999. Investigation of BOLD signal dependence on cerebral bloodflow and oxygen consumption: the deoxyhemoglobin dilution model. Magn. Reson. Med. 42, 849–863.
Ibaraki, M., Shinohara, Y., Nakamura, K., Miura, S., Kinoshita, F., Kinoshita, T., 2010. Interindividual variations of cerebral bloodflow, oxygen delivery, and metabolism in relation to hemoglobin concentration measured by positron emission tomography in humans. J. Cereb. Blood Flow Metab. 30, 1296–1305.http://dx.doi.org/10.1038/ jcbfm.2010.13.
Ishiwata, K., Mishina, M., Kimura, Y., Oda, K., Sasaki, T., Ishii, K., 2005. First visualization of adenosine A(2A) receptors in the human brain by positron emission tomography with [11C]TMSX. Synapse 55, 133–136.http://dx.doi.org/10.1002/ syn.20099.
Jenkinson, M., Bannister, P., Brady, M., Smith, S.M., 2002. Improved optimization for the robust and accurate linear registration and motion correction of brain images. Neuroimage 17, 825–841.http://dx.doi.org/10.1016/S1053-8119(02)91132-8. Kusano, Y., Echeverry, G., Miekisiak, G., Kulik, T.B., Aronhime, S.N., Chen, J.F., Winn,
H.R., 2010. Role of adenosine A2 receptors in regulation of cerebral bloodflow during induced hypotension. J. Cereb. Blood Flow Metab. 30, 808–815.http:// dx.doi.org/10.1038/jcbfm.2009.244.
Laurienti, P.J., Field, A.S., Burdette, J.H., Maldjian, J. a, 2003. Relationship between caffeine-induced changes in resting cerebral perfusion and blood oxygenation level – dependent signal. Am. J Neuroradiol. 24, 1607–1611.
Lin, A.-L., Fox, P.T., Hardies, J., Duong, T.Q., Gao, J.-H., 2010. Nonlinear coupling between cerebral bloodflow, oxygen consumption, and ATP production in human visual cortex. In: Proceedings of the Natl. Acad. Sci. U. S. A., vol. 107, pp. 8446–51. 〈https://doi.org/10.1073/pnas.0909711107〉.
Liu, P., Xu, F., Lu, H., 2013. Test-retest reproducibility of a rapid method to measure brain oxygen metabolism. Magn. Reson. Med. 69, 675–681.http://dx.doi.org/ 10.1002/mrm.24295.
Logothetis, N.K., 2008. What we can do and what we cannot do with fMRI. Nature 453, 869–878.http://dx.doi.org/10.1038/nature06976.
Lu, H., Clingman, C.S., Golay, X., van Zijl, P.C.M., 2004. Determining the longitudinal relaxation time (T1) of blood at 3.0 T. Magn. Reson. Med. 52, 679–682.http:// dx.doi.org/10.1002/mrm.20178.
Ma, Y., Berman, A.J.L., Pike, G.B., 2014. The effect of dissolved oxygen on relaxation rates of blood plasma. Proc. Int. Soc. Mag. Reson. Med..
Magkos, F., Kavouras, S.A., 2005. Caffeine use in sports, pharmacokinetics in man, and cellular mechanisms of action. Crit. Rev. Food Sci. Nutr. 45, 535–562.http:// dx.doi.org/10.1080/1040-830491379245.
Merola, A., Murphy, K., Stone, A.J., Germuska, M.A., Griffeth, V.E.M., Blockley, N.P., Buxton, R.B., Wise, R.G., 2016. Measurement of oxygen extraction fraction ( OEF): an optimised BOLD signal model for use with hypercapnic and hyperoxic calibration. Neuroimage 129, 159–174.http://dx.doi.org/10.1016/j.neuroimage.2016.01.021. Milde, L.N., Milde, J.H., Michenfelder, J.D., 1985. Cerbral functional, metabolic and
hemodynamic effects of etomidate on dogs. Anesthesiology, 371–377.
Nehlig, A., Boyet, S., 2000. Dose-response study of caffeine effects on cerebral functional activity with a specific focus on dependence. Brain Res. 858, 71–77.http:// dx.doi.org/10.1016/S0006-8993(99)02480-4.
Newman, M.F., Mm-kin, J.M., Roach, G., Croughwell, N.D., White, D., Clements, F.M., Reves, J.G., 1995. Cerebral physiologic effects of burst suppression doses of propofol during nonpulsatile cardiopulmonary bypass mark. Anesth. Analg., 452–457.
Park, C.-A., Kang, C.-K., Son, Y.-D., Choi, E.-J., Kim, S.-H., Oh, S.-T., Kim, Y.-B., Park, C.-W., Cho, Z.-H., 2014. The effects of caffeine ingestion on cortical areas: functional imaging study. Magn. Reson. Imaging 32, 366–371.http://dx.doi.org/10.1016/ j.mri.2013.12.018.
Pelligrino, D.A., Xu, H.-L., Vetri, F., 2012. Caffeine and the control of cerebral hemodynamics. J Alzheimers Dis. 29, 997–1003.http://dx.doi.org/10.1016/ j.biotechadv.2011.08.021.Secreted.
Perthen, J.E., Lansing, A.E., Liau, J., Liu, T.T., Buxton, R.B., 2008. Caffeine-induced uncoupling of cerebral bloodflow and oxygen metabolism: a calibrated BOLD fMRI study. Neuroimage 40, 237–247.http://dx.doi.org/10.1016/
j.neuroimage.2007.10.049.
Raichle, M.E., Gusnard, D. a, 2002. Appraising the brain's energy budget. Proc. Natl. Acad. Sci. U.S.A. 99, 10237–10239.http://dx.doi.org/10.1073/pnas.172399499. Rogers, P.J., Hohoff, C., Heatherley, S.V., Mullings, E.L., Maxfield, P.J., Evershed, R.P.,
Deckert, J., Nutt, D.J., 2010. Association of the anxiogenic and alerting effects of caffeine with ADORA2A and ADORA1 polymorphisms and habitual level of caffeine consumption. Neuropsychopharmacology 35, 1973–1983.http://dx.doi.org/ 10.1038/npp.2010.71.
Roland, P.E., Eriksson, L., Stone-Elander, S., Widen, L., 1987. Does mental activity change the oxidative metabolism of the brain? J. Neurosci. 7, 2373–2389. Shu, C.Y., Sanganahalli, B.G., Coman, D., Herman, P., Rothman, D.L., Hyder, F., 2016.
Quantitativeβ mapping for calibrated fMRI. Neuroimage 126, 219–228.http:// dx.doi.org/10.1016/j.neuroimage.2015.11.042.
Siepmann, M., Kirch, W., 2002. Effects of caffeine on topographic quantitative EEG. Neuropsychobiology, 161–166.
Smith, a, 2002. Effects of caffeine on human behavior. Food Chem. Toxicol. 40, 1243–1255.http://dx.doi.org/10.1016/S0278-6915(02)00096-0.
Smith, J.E., Lawrence, A.D., Diukova, A., Wise, R.G., Rogers, P.J., 2012. Storm in a coffee cup: caffeine modifies brain activation to social signals of threat. Soc. Cogn. Affect. Neurosci. 7, 831–840.http://dx.doi.org/10.1093/scan/nsr058.
Smith, S.M., Brady, J., 1997. SUSAN– A New Approach to Low Level Image Processing. Svenningsson, P., Hall, H., Sedvall, G., Fredholm, B.B., 1997. Distribution of adenosine
receptors in the postmortem human brain: an extended autoradiographic study.
Synapse 27, 322–335.http://dx.doi.org/10.1002/(SICI)1098-2396(199712)27:4 < 322::AID-SYN6 > 3.0.CO;2-E.
Tancredi, F.B., Lajoie, I., Hoge, R.D., 2014. A simple breathing circuit allowing precise control of inspiratory gases for experimental respiratory manipulations. BMC Res. Notes 7, 235.http://dx.doi.org/10.1186/1756-0500-7-235.
Vaishnavi, S.N., Vlassenko, A.G., Rundle, M.M., Snyder, A.Z., Mintun, M.A., 2010. Regional aerobic glycolysis in the human brain. Proc. Natl. Acad. Sci. U.S.A. 107, 17757–17762.http://dx.doi.org/10.1073/pnas.1010459107.
Van Osch, M.J.P., Hendrikse, J., Van Der Grond, J., 2007. Sensitivity comparison of multiple vs. single inversion time pulsed arterial spin labeling fMRI. J. Magn. Reson. Imaging 25, 215–221.http://dx.doi.org/10.1002/jmri.20823.
Vidyasagar, R., Greyling, A., Draijer, R., Corfield, D.R., Parkes, L.M., 2013. The effect of black tea and caffeine on regional cerebral blood flow measured with arterial spin labeling. J. Cereb. Blood Flow Metab. 33, 963–968.http://dx.doi.org/10.1038/ jcbfm.2013.40.
Wise, R.G., Harris, A.D., Stone, A.J., Murphy, K., 2013. Measurement of OEF and absolute CMRO 2: mri-based methods using interleaved and combined hypercapnia and hyperoxia. Neuroimage 83, 135–147.http://dx.doi.org/10.1016/
j.neuroimage.2013.06.008.
Woolrich, M.W., Chiarelli, P. a, Gallichan, D., Perthen, J.E., Liu, T.T., 2006. Bayesian inference of hemodynamic changes in functional arterial spin labeling data. Magn. Reson. Med. 56, 891–906.http://dx.doi.org/10.1002/mrm.21039.
Wu, W.-C., Jiang, S.F., Yang, S.C., Lien, S.H., 2011. Pseudocontinuous arterial spin labeling perfusion magnetic resonance imaging-a normative study of reproducibility in the human brain. Neuroimage 56, 1244–1250.http://dx.doi.org/10.1016/ j.neuroimage.2011.02.080.
Xu, F., Liu, P., Pekar, J.J., Lu, H., 2015. Does acute caffeine ingestion alter brain metabolism in young adults? Neuroimage 110C, 39–47.http://dx.doi.org/10.1016/ j.neuroimage.2015.01.046.
Yang, L.L., Brugniaux, J., Dhaliwal, H., Beaudin, a E., Eliasziw, M., Poulin, M.J., Dunn, J.F., 2015. Studying cerebral hemodynamics and metabolism using simultaneous near-infrared spectroscopy and transcranial Doppler ultrasound: a hyperventilation and caffeine study. Physiol. Rep. 3, 1–11.http://dx.doi.org/10.14814/phy2.12378.