part of
Evaluation of antibacterial and antibiofilm
mechanisms by usnic acid against
methicillin-resistant Staphylococcus aureus
Arianna Pompilio‡,1,2, Antonella Riviello‡,1,2,3, Valentina Crocetta1,2, Fabrizio
Di Giuseppe1,2,3, Stefano Pomponio1,2, Marilisa Sulpizio1,2,3, Carmine Di Ilio1,2,3,
Stefania Angelucci1,2,3, Luana Barone4, Andrea Di Giulio4 & Giovanni
Di Bonaventura*,1,2
1Department of Medical, Oral & Biotechnological Sciences, ‘G d’Annunzio’ University of Chieti-Pescara, Via Vestini 31, Chieti, Italy 2Aging Research Center and Translational Medicine, ‘G d’Annunzio’ University of Chieti-Pescara, Via L Polacchi 13, Chieti, Italy 3Stem TeCh Group, Via L Polacchi 13, Chieti, Italy
4Department of Science, LIME, University Roma Tre, Viale G Marconi 446, Rome, Italy
*Author for correspondence: Tel.: +39 087 1355 4812; Fax: +39 087 1355 4822; [email protected]
‡Authors contributed equally
Aim: To evaluate the antibacterial and antibiofilm mechanisms of usnic acid (USN) against methicillin-resistant Staphylococcus aureus from cystic fibrosis patients. Materials & methods: The effects exerted by USN at subinhibitory concentrations on S. aureus Sa3 strain was evaluated by proteomic, real-time PCR and electron microscopy analyses. Results & conclusion: Proteomic analysis showed that USN caused damage in peptidoglycan synthesis, as confirmed by microscopy. Real-time PCR analysis showed that antibiofilm activity of USN is mainly due to impaired adhesion to the host matrix binding proteins, and decreasing lipase and thermonuclease expression. Our data show that USN exerts anti-staphylococcal effects through multitarget inhibitory effects, thus confirming the rationale for considering it ‘lead compound’ for the treatment of cystic fibrosis infections.
First draft submitted: 9 March 2016; Accepted for publication: 7 July 2016; Published online: 16 September 2016
KeywoRds • biofilm
• Staphylococcus aureus • usnic acid
The most common cause of death in cystic fibrosis (CF) patients is respiratory failure secondary to pulmonary infection. Pseudomonas aeruginosa and Burkholderia cepacia complex are the pathogens most commonly associated with a shortened life span, although there has recently been an increase in the prevalence of several potentially pathogenic microorganisms in CF.
Methicillin-resistant Staphylococcus aureus (MRSA) is one such important emerging pathogen. Patients with CF are at particular risk for pulmonary colonization of MRSA because of two main factors: their difficulty in clearing mucus and their frequent hospital visits, which can increase exposure to MRSA [1–3]. S. aureus multiplies and persists in the airways of CF patients for months or even years despite appropriate anti-staphylococcal therapy [4,5]. Particularly, hospital-acquired MRSA isolates that are usually associated with SCCmec types I, II and III, tend to be resistant to all antimicrobials with the exception of glycopeptides.
Despite the increasing prevalence of MRSA in CF patients, its clinical significance remains unclear. Chronic pulmonary infection with MRSA is thought to confer CF patients a worse overall clinical out-come and, in particular, result in an increased rate of lung function decline, as measured by FEV1[3]. In contrast with this finding, another study using data from the Epidemiologic Study of Cystic Fibrosis showed that patients with MRSA had increased decline in lung function prior to MRSA
acquisition therefore concluding that MRSA did not influence lung function decline [6].
In addition to methicillin resistance, other adaptive strategies are adopted by S. aureus to survive in CF lung, such as the formation of biofilms and the switch to small-colony variants, therefore making the action of antimicrobial agents and pathogen eradication difficult [7–9].
The relevant morbidity and mortality associ-ated with S. aureus infection and the increased antibiotic resistance demand the development of new antimicrobial strategies.
Natural products with diverse bio activities and structures are an important source of novel chemicals with pharmaceutical poten-tials. Lichens, symbiotic organisms between a fungal (mycobiont) and algal and/or ciano-bacterial (phytobiont) partner, are commonly found worldwide. This symbiotic relationship is un deniably successful for lichens that can survive a variety of harsh environmental conditions and are inherently resistant to microbial infections. Their intrinsic resistance is mainly due to the production of a large number of compounds that typically arise from the secondary meta bolism of the fungal component. Chemotaxonomic studies have shown that most lichen second-ary metabolites belong to the chemical classes of depsides, depsidones and dibenzofurans [10].
Of the hundreds of known secondary lichen metabolites, the benzofuran derivative usnic acid (USN), commonly found in the genus Usnea, is the most studied. Lichens belonging to USN pro-ducers have been extensively used for centuries in folklorist medicine in the treatment of pul-monary tuberculosis, pain relief, fever control, wounds, mycoses, sore throat, toothache and several skin infections [11,12]. In fact, USN has shown a variety of biological activities, includ-ing antimicrobial activity against a number of bacterial and fungal pathogens, both tested as planktonic and sessile (biofilm) lifestyle [13–16]. Toxicity in USN must be addressed due to some adverse reports relating its use as a slimming agent and dietary supplement [17]. Hepatotoxicity has been deeply investigated, although USN has been reported to induce toxicity in other normal and malignant cell types [18]. However, adsorb-ing USN onto different carriers (i.e., polymers, magnetic nanoparticles) reduces toxicity [19,20] as well as affects biofilm development and facilitates eradication of preformed biofilms [19,21–23].
Recently, our group found that USN shows relevant activity against both planktonic and
biofilm lifestyles of S. aureus strains isolated from CF patients [24], therefore warranting fur-ther in vitro and in vivo studies to evaluate the ‘real’ potential of this lichen metabolite in the management of lung infections in CF patients. Although the antibiotic activity of USN is nowa-days universally recognized, little or nothing is known about its mechanism of action.
In the present work, for the first time, pro-teomic analysis was performed to investigate the effects caused by the exposure to USN at sub-inhibitory concentration on protein expression of an MRSA strain isolated from a CF patient. The morphological and ultrastructural changes induced by USN in staphylococcal cells were further elucidated using both transmission and scanning electron microscopy. Finally, the effects of USN at subinhibitory concentrations on virulence gene expression by S. aureus were also investigated.
Materials & methods
●
● Bacterial strain & growth conditions
Staphylococcus aureus Sa3 strain was isolated from the airways of a chronically infected patient diagnosed with CF (genotype ΔF508/ΔF508) attending ‘Bambino Gesù’ Children Hospital of Rome, Italy. Identification at species level was carried out by conventional biochemical tests (API® Staph System; BioMérieux, Marcy-L’Etoile, France). Resistance to methicillin was evaluated with 30-μg cefoxitin disks and confirmed by a duplex PCR assay with primers targeting nuc and mecA genes, respectively [25]. Strain was stored at -80°C (Microbank®; Biolife Italiana S.r.l., Milan, Italy) until use when it was grown overnight at 37°C in Trypticase Soy broth (TSB; Oxoid S.p.A.; Garbagnate M.se, Italy), then plated twice on Mueller-Hinton Agar (MHA; Oxoid S.p.A.) to check for purity and to restore the original phenotype.
All assays were carried out by using a stand-ardized bacterial inoculum. Briefly, some colo-nies grown overnight on MHA were resuspended in sterile NaCl to an OD550 of 1.2 (correspond-ing to 1–3 × 10⁸ CFU/ml), then diluted 1:1000 in cation-adjusted Mueller–Hinton broth (CAMHB; Becton, Dickinson and Company; Milan, Italy; pH 7.2–7.4).
●
● Usnic acid
Usnic acid powder (Sigma-Aldrich; Milan, Italy) was used to prepare a 2 mg/ml stock solution in dimethyl sulfoxide (DMSO; Sigma-Aldrich)
and then diluted with sterile CAMHB to obtain desired concentrations. The final DMSO con-centration (≤ 3%) did not affect the viability of the strain tested (data not shown).
●
● Minimum inhibitory concentration determination
Minimum inhibitory concentration (MIC) of USN for S. aureus Sa3 strain was 64 μg/ml, as assessed in triplicate using the micro dilution method, according to the Clinical and Laboratory Standards Institute [26].
●
● exposure to UsN
The standardized inoculum was exposed to USN (for 24 h at 37°C) under static conditions, at desired concentrations: 1/64 × MIC, for prot-eomic studies because it was the highest subin-hibitory concentration showing no effects on S. aureus Sa3 growth; 1/256×, 1/128× and 1/64 × MIC for gene expression analysis so as to evaluate if the effects were dose-dependent; and 1×, 1/8× and 1/64 × MIC for microscopic analysis so as to assess the continuum of ultrastructural effects from the inhibitory concentration (hypothetical max effect) toward the ‘target’ concentration of 1/64 × MIC. A bacterial suspension not exposed to USN was prepared as control (CTRL) for comparative purposes. The rationale for select-ing USN concentrations was based on the evi-dence that USN did not affect bacterial growth at 1/64 × MIC (data not shown).
●
● Protein preparation & 2De analysis
At the end of exposure to USN, bacterial cells were prepared according to previous studies, with minor modification, to obtain membrane fraction [27,28]. Each sample was electrophoreti-cally run three times as three technical and two biological replicates. Protein concentration was measured using Better Bradford® (Pierce, IL, USA) and a total amount of 150 μg (for the ana-lytical gels) and 500 μg (for preparative gels) were mixed with rehydration solution (DeStreak™ Rehydration Solution, GE Healthcare, Uppsala, Sweden), and both were applied to isoelectric focusing using IPG strip nonlinear pH 4–7, 24 cm (GE Healthcare) on Ettan™ IPGphor™ III System (GE Healthcare). The second dimen-sion PAGE was performed on 9–16% SDS-polyacrylamide gels according to procedures previously described by Sulpizio et al. [29].
After staining, gels were scanned at 600 dpi with LabScan 5.0 (GE Healthcare) and, in
order to create a reference gel representative of all analyzed conditions, three different gel runs for each group type (time zero, sedentary and trained) samples were performed and then sub-jected to image analysis with ImageMaster 2D Platinum 6.0 software (GE Healthcare). A ref-erence gel was created from a representative gel combining all spots common to the various ana-lyzed gels. The reference gel was then used to determine the presence and difference in protein expression among gels. Background subtraction was performed and the intensity volume of each spot was normalized with total intensity volume (summing the intensity volumes obtained from all spots within the same 2D gel). All the quan-titative data are reported as mean ± standard error of the mean (SEM). The Intensity volumes of individual spots were matched across the dif-ferent gels and then compared among groups by multiple comparisons using one-way analysis of variance. Differently expressed (p < 0.001) pro-tein spots underwent in-gel tryptic digestion and identification by mass spectrometry (MS).
●
● Protein digestion & MalDi-tOF/tOF-Ms analysis
Protein spots were excised from 2D gels and analyzed using peptide mass finger printing (PMF) approach with a MALDI-TOF/TOF spectro meter. Following protein spot digestion in 50 mM NH4HCO3 containing trypsin and incubated overnight at 37°C [25], the peptide extract was applied to aC18ZipTip (Millipore, CA, USA), rinsed with a 0.1% TFA and eluted directly on the MALDI target with 0.5 μl of a saturated α-cyano-4-hydroxycinnamic acid (1:1 = ACN: 0.1% TFA) solution.
Tryptic digests were analyzed by Autoflex™ Speed mass spectrometer (Bruker Daltonics, Bremen, Germany) equipped with a Nd:YAG laser (355 nm; 1000 Hz) operated by FlexControl v3.3 and equipped with a 355-nm nitrogen laser. All spectra were obtained with the delayed extraction technology in positive reflectron mode and averaged from 100 laser shots to improve the S/N ratio. External high precision calibration was performed using a pep-tide mixture containing bradykinin (fragment 1–7) 757.39 m/z, angiotensin II 1046.54 m/z, ACTH (fragment 18–39) 2465.19 m/z, Glu fibrino peptide B 1571.57 m/z and renin substrate tetradecapeptide porcine 1760.02 m/z. Samples analyzed by PMF were additionally analyzed using LIFT MS/MS from the same target. The
most abundant ions per sample were chosen for MS/MS analysis. Analyses were performed in positive LIFT reflectron mode. Precursor ion selector range was 0.65% of parent ion mass. The voltage parameters were set at IS1 6 kV, IS2 5.3 kV, lens 3.00 kV, reflector 1 27.0 kV, reflector 2 11.45 kV, LIFT1 19 kV and LIFT 2 4.40 kV.
●
● Database Ms/Ms searching
Following MS acquisition, each spectrum was submitted to PMF to search the mouse NCBIn protein database using a Mascot search engine, which compares the experimentally determined tryptic peptide masses with theoretical peptide masses calculated for protein from these data-bases. Search parameters are as follows: search type, peptide mass fingerprint enzyme, trypsin; fixed modification, carbamido methylation (Cys); variable modifications, oxidation of methionine; mass values, monoisotopic; ion charge state was set to +1; maximum miscleav-ages was set to 1; mass tolerance of 100 ppm for PMF and 0.6–0.8 Da for MS/MS. After automated assessment of the search results, the samples were automatically submitted to LIFT TOF/TOF acquisition for validation of data analysis from PMF. A maximum of four precur-sor ions per sample were chosen for MS/MS anal-ysis. Protein database searches, through Mascot, using combined PMF and MS/MS datasets were performed via BioTools 3.2 (Bruker Daltonics) connected to the Mascot search engine used for SwissProt database (SwissProt_2012_03.fasta) search of datasets. The match with the lowest probability, that is, the highest score is reported as the best match. Identity threshold is typi-cally a score of about 70 for PMF and 30–40 for MS/MS search. Whether the best match will be significant depends on data quality and the size of the database. Ideally, the correct match is the best and significant match.
●
● Bioinformatic analysis of proteomic data Identified proteins were further analyzed using the STRING software [30], chosen as the source for protein–protein interactions, to statistically evaluate the functions and pathways most strongly associated with the protein list. Protein ontology classification was performed by importing pro-teins into the protein analysis through gene ontol-ogy (GO) classification system [31]. Proteins were grouped according to their associated biological processes and molecular functions.
●
● Gene expression assay
The effect of USN at sub-MICs on the transcrip-tion levels of 11 virulence factors of S. aureus Sa3 was assessed by RT-PCR (table 1). S. aureus Sa3 was cultured, both in the presence and absence of USN (at 0.25, 0.5 and 1 μg/ml, cor-responding at 1/256×, 1/128× and 1/64 × MIC, respectively) as described above. Following 24-h incubation at 37°C, samples were washed by centrifugation and then harvested in QIAzol (Qiagen©) with lysozyme 10 mg/ml. RNA was then extracted by phenol-chloroform tech-nique, treated with DNase I (TURBO DNA-free™; Applied Biosystems, Monza, Italy), and checked for purity by NanoDrop-200 spectro-photometer (Thermo Scientific). cDNA strand was synthesized using a High Capacity cDNA reverse transcription kit (Applied Biosystems) per manufacturer protocol. All experiments were performed by using 450 ng of RNA converted in cDNA. Gene expression was evaluated using a SYBRgreen (Applied Biosystems) RT-PCR assay. The primers’ specificity was assessed both in silico with BLAST and by PCR endpoint in the same RT-PCR conditions. The ΔΔCt method was used to determine relative gene expression of each gene [32], both in the pres-ence or abspres-ence of USN, normalized to expres-sion of the housekeeping gene gyrB. Differences in gene expression levels were evaluated by a paired Student’s t-test, considering a p < 0.05 as statistically significant.
●
● electron microscopic analyses
The effects of USN on staphylococcal mor-phology were assessed through scanning (SEM) and transmission (TEM) electron microscopy [36,37].
teM
Bacteria were cultured overnight in grown medium in the absence or presence of USN at different concentrations – corresponding to 1×, 1/8× and 1/64 × MIC – and were then harvested by centrifugation at 10,000 × g for 5 min. The cells were washed twice, resuspended in phosphate buffered saline (Sigma-Aldrich) and fixed with 2.5% glutaraldehyde in 0.1 M cacodylate buffer, pH 7.4, 1 h at 4°C. After incubation, the cells were recovered by centrif-ugation at 10,000 × g for 5 min. After being washed twice in cacodylate buffer, the pellets were postfixed with 1% osmium tetraoxide (OsO4) in 0.2 M cacodylate buffer for 1 h at
room temperature. The samples were dehy-drated with graded ethanol solutions (70% ethanol 10 min, 80% ethanol 10 min, 95% ethanol 10 min and twice in 100% ethanol 15 min), embedded in Epon 812 resin and left to polymerize for 3 days.
Each sample was sectioned by a Reichert Ultracut S ultramicrotome. Ultrathin sections were briefly contrasted with uranyl acetate and observed using a Philips CM120 TEM equipped with a Philips Megaview III camera at the Interdepartmental Laboratory of Electron Microscopy (L.I.M.E., Roma Tre University, Rome, Italy).
seM
For high resolution SEM images, the specimens were fixed as described for TEM, postfixed with osmium tetraoxide, dehydrated to 100% etha-nol through a graded ethaetha-nol series, dried by hexa methyldisilazane (allowed to dry for 1 h), mounted on aluminum stubs with adhesive car-bon disks, gold coated in an Emitech K550 unit and finally examined by using the field emis-sion SEM column of the DualBeam FIB/SEM Helios Nanolab (FEI Company, Eindhoven,
The Netherlands) at the L.I.M.E., with second-ary electrons and an operating voltage of 5 kV. Electronic images were taken by AnalySys 2.0 software and composed in Adobe Photoshop CC format.
●
● Propidium iodide uptake assay
The effect of USN on S. aureus Sa3 membrane permeability was studied by measuring pro-pidium iodide (PI) uptake by bacterial cells. Cell suspensions, prepared as described above, were aliquoted in each well of a microtiter plate (100 μl/well) in the presence of USN at 1/64×, 1/128× and 1/256 × MIC. Control samples con-sisted of bacterial suspension only. After 24- h treatment, PI (100 μl at 60 μM) was added to each sample and incubated at room tempera-ture for 15 min in the dark. Fluorescence was measured at excitation and emission wave-lengths of 485 and 630 nm, respectively, using a SINERGY™ H1 microplate reader (BioTek; Winooski, VT, USA). Differences in PI uptake levels were evaluated by analysis of variance followed by Tukey’s multiple comparison post-test, considering a p < 0.05 as statistically significant.
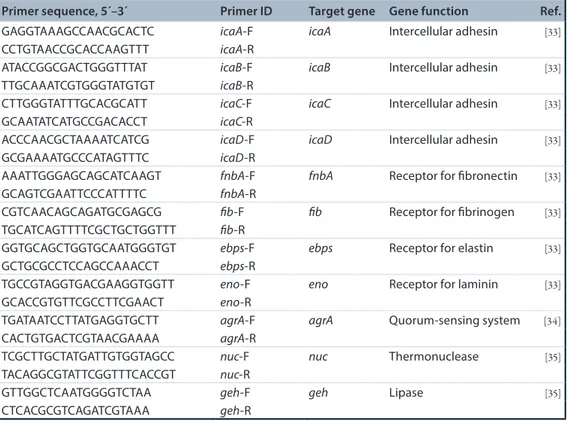
table 1. Quantitative PcR primers used in this study to assess the effects of usnic acid at sub-minimum inhibitory concentrations on the expression levels of selected virulence factors by S. aureus sa3 strain.
Primer sequence, 5´–3´ Primer iD target gene Gene function Ref.
GAGGTAAAGCCAACGCACTC icaA-F icaA Intercellular adhesin [33]
CCTGTAACCGCACCAAGTTT icaA-R
ATACCGGCGACTGGGTTTAT icaB-F icaB Intercellular adhesin [33]
TTGCAAATCGTGGGTATGTGT icaB-R
CTTGGGTATTTGCACGCATT icaC-F icaC Intercellular adhesin [33]
GCAATATCATGCCGACACCT icaC-R
ACCCAACGCTAAAATCATCG icaD-F icaD Intercellular adhesin [33]
GCGAAAATGCCCATAGTTTC icaD-R
AAATTGGGAGCAGCATCAAGT fnbA-F fnbA Receptor for fibronectin [33]
GCAGTCGAATTCCCATTTTC fnbA-R
CGTCAACAGCAGATGCGAGCG fib-F fib Receptor for fibrinogen [33]
TGCATCAGTTTTCGCTGCTGGTTT fib-R
GGTGCAGCTGGTGCAATGGGTGT ebps-F ebps Receptor for elastin [33]
GCTGCGCCTCCAGCCAAACCT ebps-R
TGCCGTAGGTGACGAAGGTGGTT eno-F eno Receptor for laminin [33]
GCACCGTGTTCGCCTTCGAACT eno-R
TGATAATCCTTATGAGGTGCTT agrA-F agrA Quorum-sensing system [34]
CACTGTGACTCGTAACGAAAA agrA-R
TCGCTTGCTATGATTGTGGTAGCC nuc-F nuc Thermonuclease [35]
TACAGGCGTATTCGGTTTCACCGT nuc-R
GTTGGCTCAATGGGGTCTAA geh-F geh Lipase [35]
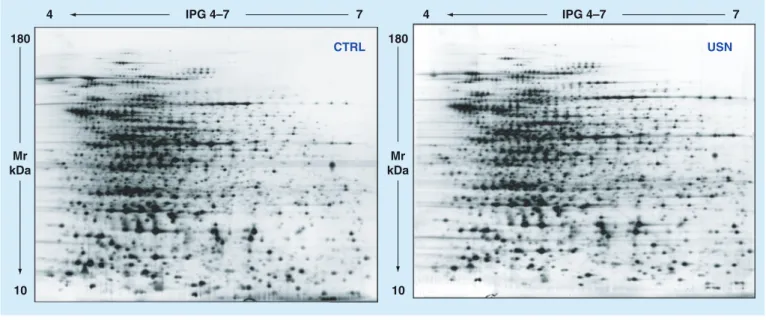
Figure 1. Representative 2De maps of Staphylococcus aureus sa3 cultured without control or with usnic acid at 1 μg/ml (corresponding at 1/64 × minimum inhibitory concentration) for 24 h. Comparative analysis revealed at least 1.230 ± 99 and 1.108 ± 60 protein spots for
CTRL and USN samples, respectively. One-hundred micrograms were loaded on IPG strip 4–7, 24 cm on 9–16% gradient gel. CTRL: Control; USN: Usnic acid.
4 IPG 4–7 7 180 Mr kDa 10 4 IPG 4–7 7 180 Mr kDa 10 CTRL USN Results ●
● Detection & analysis of S. aureus proteins differentially expressed following treatment with UsN
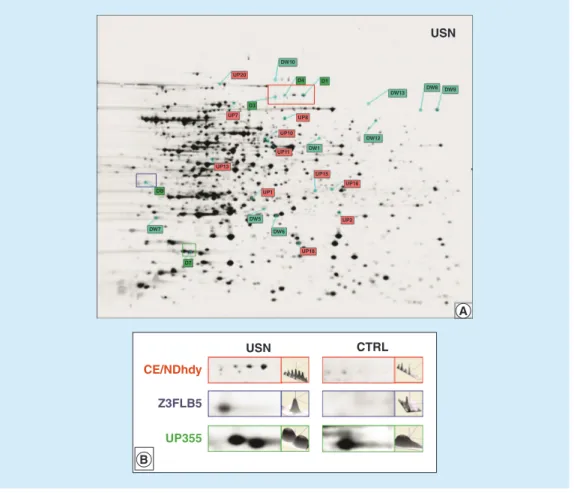
To investigate the changes in S. aureus protein expression induced by USN, S. aureus Sa3 cul-tures were grown both in the absence and in the presence of USN at 1/64 × MIC and underwent 2DE analysis. Figure 1 shows representative gels obtained for USN and CTRL samples. In both samples most of the protein spots were observed in the acidic range. Approximately 1.230 ± 99 and 1.108 ± 60 protein spots were observed on the 2DE-gel from surfacomes of CTRL and USN samples, respectively. A total of 1.003 ± 68 pro-teins were shared by both CTRL and USN sam-ples, accounting for 81% of similarity. Twenty-six protein spots were identified to be differentially expressed (p < 0.001) on the 2DE maps of the two groups: 13 proteins were measured at increased levels compared with untreated cells, while 13 proteins were decreased (Figure 2a). It is worth noting that five additional protein spots appeared only following exposure to USN (Figure 2B).
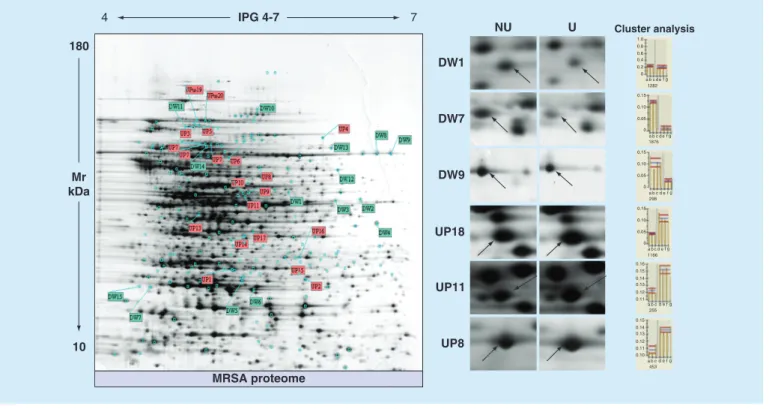
Heuristic clustering analysis performed on all samples (three gels for four batches examined in both USN and CTRL samples) correctly identi-fied two different phenotypes, USN and CTRL samples. On the right side of each panel the results from the evaluation of interclass variability are
shown. The evaluation focused on those pro-teins that differed significantly (p < 0.001). For both phenotypes we used a magnification of 2D image showing the spot location and histogram to indicate the relative spot volume (Figure 3).
The protein spots showing statistically sig-nificant fold change in normalized spot volume between USN and CTRL samples were excised, and digested for MS analyses. Information reporting differentially expressed protein spots – such as protein spot number, protein annotation and functional category (NCBI database) – are listed in table 2.
The five proteins that were newly expressed fol-lowing exposure to USN were identified as: three isoforms of acyl esterase, an haloacid dehalogenase (HAD) family hydrolase and the uncharacterized UPF0355 protein (table 3&Figure 2).
●
● Functional analysis
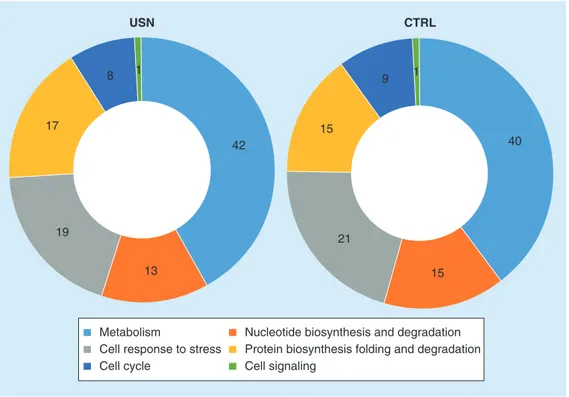
Gene ontology functional analysis was carried out and results are shown in Figure 4. USN proteome was characterized by an increase of metabolic proteins (42 vs 40%, for USN and CTRL samples, respectively), and of those involved in protein synthesis and degradation processes (17 vs 15%, for USN and CTRL sam-ples, respectively). A reduction was observed for proteins involved in cell cycle (8 vs 9%, for USN and CTRL samples, respectively), cell response
Figure 2. identification of proteins differently expressed by Staphylococcus aureus sa3 after exposure to usnic acid at 1 μg/ml (corresponding at 1/64 × minimum inhibitory concentration) for 24 h.(a) 2D map of usnic acid-exposed sample: 26 proteins, resulted over- (red label) or
under-regulated (green label), were unequivocally assigned. Representative different protein spots for expression level are shown. (B) Magnification of USN-related newly protein: CE/NDhdy (D1, D3, D7), Z3FLB5 (DB) and UP355 (D7) spots with its 3D view.
CTRL: Control; USN: Usnic acid.
USN Z3FLB5 UP355 CE/NDhdy USN CTRL UP20 D3 UP10 UP11 UP13 UP15 UP16 UP18 UP2 UP1 UP8 UP7 D4 D1 DB D7 DW7 DW5 DW6 DW1 DW8 DW9 DW12 DW13 DW10
to stress (19 vs 21%, for USN and CTRL sam-ples, respectively) and nucleotide metabolism (13 vs 15%, for USN and CTRL samples, respectively). However, all of these differences resulted not to be statistically significant. No changes were observed for proteins involved in cell signaling (1%).
●
● interactome
All changes in protein expression level, observed in USN samples compared with CTRL ones, were analyzed using STRING software (ver-sion 9.05), obtaining two protein interaction networks (PINs), one for each USN and CTRL samples, as shown in Figure 5. PINs allowed us to evidence possible functional associations among proteins differentially and specifically expressed in USN samples (Figure 5B). Seven
interesting functional pathways were identified in USN samples (Figure 5). In particular, pathway 1 is composed of protein regulators of fatty-acid biosynthesis, acyl carrier proteins as Acyl-CoA reductase (FABG), an USN-related downregu-lated enzyme showing a strong functional inter-action with fabF, fabH and fabI, hub proteins related to a large number of other forms favoring the fatty-acid chain elongation process. Pathway 2 related to hexosamine metabolism includes glucosamine-6-phosphate isomerase (NAGB) and glutamine-fructose-6-phosphate ami-notransferase (GLMS), two very active enzymes in the regulation of biosynthetic processes. This pathway is strongly connected to pathways 3 and 5, including proteins involved in the pho-late’s biosynthesis and metabolism, respectively (GLYA, FOLD). Finally, pathway 7 showed a
Figure 3. Usnic acid-related differentially expressed proteins. Master gel of S. aureus SA3 proteome quantitative changes,
obtained following exposure to usnic acid, is shown. Some MS-assigned proteins are labeled with the abbreviation on 2D map. On the right, the results from heuristic cluster analysis on those proteins that differ significantly (p < 0.001) are reported. Each phenotype (usnic acid and control samples) underwent 2D image magnification showing protein spot location and histogram to measure the expression level. On the x-axis, each letter indicates a single gel (from three biological replicates for each condition). The y-axis indicates the relative volume of the spot.
CTRL: Control; DW, Downregulated protein; UP, Upregulated protein; USN: Usnic acid. DW1 DW7 DW9 UP18 UP11 UP8 NU U Cluster analysis 1.0 0.8 0.6 0.4 0.2 0.15 0.10 0.05 0 0 a b c d e 1282 1876 f g a b c d e f g 0.15 0.10 0.05 0 298 a b c d e f g a b c d e f g 0.15 0.16 0.15 0.14 0.13 0.12 0.11 0.15 0.14 0.13 0.12 0.11 0.10 0.10 0.05 0 1166 255 453 a b c d e f g a b c d e f g IPG 4-7 7 4 180 Mr kDa 10 MRSA proteome
strong functional association between PCKA and MQO2, both important for oxidative stress.
●
● effect of UsN on S. aureus virulence expression
We employed RT-PCR to investigate the relative expression of 11 genes encoding virulence fac-tors in S. aureus Sa3 strain following exposure to USN at sub-MICs (Figure 6). USN significantly modulated the expression of most of the genes examined. Particularly, the expression of those codifying for lipase (geh), thermo nuclease (nuc) and the receptors for laminin (eno) and elastin (ebps) was markedly repressed by S. aureus Sa3 in the presence of USN, regardless of tested concentration and in a dose-independent manner.
Particularly, when cultured in the presence of USN at 1/64 × MIC, the transcriptional levels of geh, nuc, eno and ebps decreased by 9.5-, 11.5-, 3.9- and 15.8-fold, respectively.
On the contrary, the effect exerted on the receptor for fibronectin (fnbA), quorum-sensing
(agrA) and intercellular adhesin (icaB, icaC and icaD) genes was dependent on the tested con-centrations: USN at 1/256 × MIC caused hyper-expression, with the exception of icaD, while all genes were downexpressed in the presence of USN at a concentration of 1/128 × MIC; USN significantly reduced fnbA expression (decreased by 2.0-fold) only at 1/64 × MIC. A trend toward hyperexpression was also observed for icaA and fib, although differences did not reach statistical significance, probably due to the high variability as suggested by SD values.
●
● effects of UsN on S. aureus cell morphology & ultrastructure
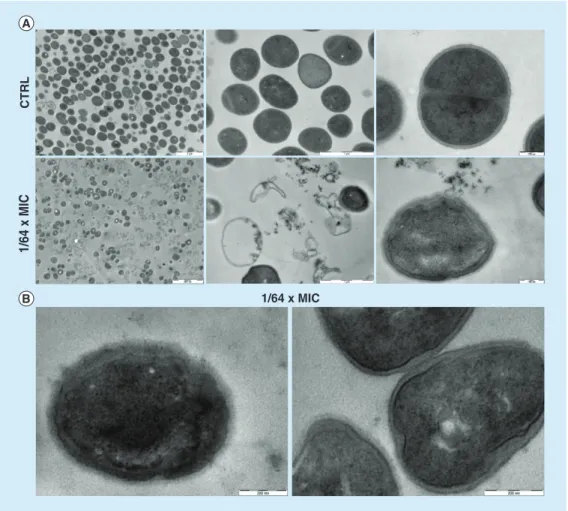
To elucidate the physiological effects of USN against S. aureus, SEM and TEM analyses were performed and representative micrographs are shown in Figure 7&Figure 8, respectively.
The electron microscopy analysis showed that USN strongly compromised cell structure, causing death in a dose-dependent manner.
ta bl e 2 . P ro te in s d iff er ent ia lly e xp re ss ed i n St ap hy loc oc cu s a ur eu s s a3 s tr ai n a ft er e xp os ur e to u sn ic a ci d. la be l a bbr evi at ed na m e D es crip tio n nam e pi theo M w th eo sc ore † sw is s Pr ot /N cB i ac ‡ G en e na m e M ol ec ul ar fun ct io n Bi ol og ic al p ro ce ss Fo ld -cha ng e va ria tio n § M s/ M s ¶ U P1 SC DA Iro n-su lfu r c lu st er re pa ir p ro te in S cd A 5. 01 25, 64 0 11 7 Q 2F K11 scd A M et al ion bi nd in g Pr ot ei n re pai r_ re sp on se to o xi dat iv e s tr es s +1 .4 2 U P2 D EF Pep tid e de for m yl as e 5. 68 20 ,60 4 11 8 Q 5H G Z3 de f Iron io n bi nd in g_ pe pt ide de fo rm yl as e ac tiv it y Tr ans lat io n +1 .6 2 U P7 G U A A G M P s yn th as e (g lu ta m in e-hy dro ly zin g) 5. 03 58 ,4 65 62 Q 6G C81 gu aA AT P b in di ng _G M P s yn th as e (g lu ta m in e-hy dro ly zin g) ac tiv it y_ py ro ph os ph at as e ac tiv it y_t ra ns fer as e a ct iv it y G M P b ios yn th eti c pro ce ss _g lu ta m in e m et ab ol ic p ro ce ss _t rn a pro ce ss in g +1 .1 – U P8 CD R Co en zy m e A di su lfid e r ed uc ta se 5. 28 49 ,3 74 10 3 A 7 × 0 I7 CD R Co A-di su lfide re duc ta se ac tiv it y_ N A D P b in din g_ fla vi n ade ni ne d in uc le ot ide bi nd in g_ pr ot ei n d is ulfide isom era se a ct iv it y Ce ll r ed ox h om eo st as is _ pro te in fo ld in g +1 .3 – U P10 T1Y 5V 9 Pu ta tive N A D H -dep en den t fl av in ox idor ed uc ta se yq ig 5. 24 42 ,0 54 81 T1Y 5V 9 SA KO R_ 00 31 6 FM N b in din g_ ox idor ed uc ta se a ct iv it y O xid at io n– re du ct io n pr oce ss +1 .3 – U P1 3 LA CC Ta ga to se -6 -ph os ph at e k in as e 4. 92 34 ,0 45 51 A 7 × 5 75 lacC AT P b in din g_ ta ga tos e- 6-ph os ph at e k in as e a ct iv it y d -t ag at os e 6 -p ho sp hat e cat ab ol ic p ro ce ss _ la ct os e c at ab ol ic pr oc es s v ia t ag at os e- 6-ph os ph at e +1 .6 1 U P1 6 SY D A sp ar tat e– tr na lig as e 4.9 6 66 ,72 8 72 A 7 × 3 44 as pS AT P b in di ng _s pa rt at e-tr na lig as e a ct iv it y_ nu cl ei c a ci d bin din g A sp ar ty l-t rna am in oa cy la tio n Pro te in b ios yn th es is + 0.9 – U P17 G CH 4 G TP c yc lo hy dr ol as e fo le2 5.1 6 33 ,6 31 45 A 7W Z02 folE 2 G tp c yc lo hy dr ol as e I ac tiv it y 7, 8-dih yd ro ne op te rin 3’ -t rip ho sp ha te bi os yn th eti c p ro ce ss +1 .1 – U P18 LAC B G al ac to se -6 -ph os ph at e isom era se s ubu ni t la cb 5. 51 19 ,1 41 15 7 A 7 × 5 78 la cB G al ac to se -6 -p ho sp hat e isom era se a ct iv it y G al ac to se c at ab ol ic pro ce ss _l ac tos e cat ab ol ic p ro ce ss +2 .8 3 U P1 9 TK T Tr an sk et ola se 4. 97 72 ,20 6 67 Q 5H G7 7 tk t M et al ion bi nd in g_ tr ank et ola se a ct iv it y D N A ri co m bi na tion _ pe nt os e p ho sp ha te shu nt _r edu ct iv e pe nto se -p ho sp ha te c yc le +1 .4 1 †Va lu es a re L og10 (p ), w he re p is t he p ro b ab ili ty t ha t t he o bs er ve d m at ch is a r an do m e ve nt ; b as ed o n S w is s-Pro t a nd N C BI d at ab as es u si ng t he M A SC O T s ea rc hi ng p ro gr am . ‡Ba se d o n S w is s-Pro t a nd N C BI d at ab as es . §N eg at iv e v al ue : Pro te in d ow nr eg ul at io n; P os iti ve v al ue : Pro te in u pr eg ul at io n. ¶M S/ M S is t he n um b er o f m at ch ed p ep tid es f ro m i on p ar en t f ra gm en ts . p I E xp : Is oe le ct ric p oi nt a s d et er m in ed f ro m t he 2 -D g el e xp er im en t.
la be l a bbr evi at ed na m e D es crip tio n na m e pi theo M w th eo sc ore † sw is s Pr ot /N cB i ac ‡ G en e na m e M ol ec ul ar fun ct io n Bi ol og ic al p ro ce ss Fo ld -cha ng e va ria tio n § M s/ M s ¶ U P2 0 TK T Tr an sk et ola se 4. 97 72 ,20 6 17 9 Q 5H G7 7 tk t M et al ion bi nd in g_ tr ank et ola se a ct iv it y D N A ri com bi na tion _ pe nt os e p hos ph at e shu nt _r edu ct iv e pe nt os e-ph os ph at e cy cl e +1 .6 1 U P6 6 N A D H :fl av in ox idor ed uc ta se 5.1 9 41 ,9 71 72 gi |3 86 83 049 9 SA KO R_ 00 31 6 FM N b in din g_ ox idor ed uc ta se a ct iv it y O xid at io n– re du ct io n pr oce ss +1 .3 – U P6 8 O 87 36 4 Pa rM p ro te in 5. 25 38 ,20 6 69 gi |4 877 35 40 7 pa rM A ctin p ol im er iz ati on D N A s eg re gat io n, Pl as m id e r et en tio n + 0. 85 – D W1 SY FA Ph en yla lan yl -t rna sy nt ha se s ub un it al ph a 5. 56 40 ,3 63 93 C5 N4M 2 ph eS AT P b in di ng _ma gn es ium io n bi ndi ng _p he ny la lani ne -tr na l ig as e a ct iv it y_ tr na bin din g Ph en yla lan yl -t rna ammi no ac yla tio n -1 .1 – D W5 FA BG 3-ox oa cyl -(a cyl -ca rri er -p ro tei n) re du ct as e, p ar tia l 5.1 8 24 ,9 25 11 2 Q 6G 9Y 2 fa bG 3-ox oa cy l-( ac yl -c ar rier -pr ot ei n) re du ct as e ( N AD PH ) ac tiv it y_ N A D b in din g_ N A D P b in din g Fat ty -a ci d e lo ng at io n -1 .3 2 D W6 N AG B G lu cos am in e- 6-ph os ph at e isom era se 5. 33 22, 17 0 24 3 A 7W Z06 nagB G lu cos am in e-6. ph os ph at e de am in as e a cti vi ty _ hy dro la se a cti vi ty N -a ce ty lg lu cos am in e m et ab oli c p ro ce ss _N -ac et yl ne ur am in at e cat ab ol ic p ro ce ss _ ca rb oh yd rat e m et ab ol ic pr oce ss -1 .8 – D W 7 Y1 69 2 U nc ha ra ct eri ze d pro te in S A1 69 2 4. 59 18 ,6 77 29 P0 A0 K1 SA1 69 2 H yd ro la se a cti vi ty , a ctin g on g ly co sy l b ond s Re sp ons e t o s tr es s, c el ls su rv ive -1 .2 2 D W 8 M Q O2 M ala te :q ui no ne ox idor ed uc ta se 6. 23 56 ,4 91 22 5 Q 5H CU 5 m qo2 M al at e deh yd ro ge na se -(m en aq ui no ne) ac tiv it y_ nak at e d eh yd ro ge na se -(qu in on e) ac tiv it y Tr ic ar bo xy lic a ci d c ycl e -1 – D W 9 M Q O2 Pr ob ab le m ala te :q ui no ne ox idor ed uc ta se 2 6. 12 56 ,1 35 83 Q 5H CU 5 m qo2 M al at e d eh yd ro ge na se (m en aq ui no ne) a ct iv it y_ m al at e d eh yd ro ge na se (qu in on e) a cti vi ty Tr ic ar bo xy lic a ci d c ycl e -1 3 D W 10 SY T Th re oni ne –t rna lig as e 5. 26 74 ,4 55 33 A 7 × 3 A 6 th rS AT P b in di ng _m et al i on bin din g_ th er eo nin e-tr na lig as e a ct iv it y Th re on yl -t rna am in oa cy la tio n -1 .3 1 †Va lu es a re L og10 (p ), w he re p is t he p ro b ab ili ty t ha t t he o bs er ve d m at ch is a r an do m e ve nt ; b as ed o n S w is s-Pro t a nd N C BI d at ab as es u si ng t he M A SC O T s ea rc hi ng p ro gr am . ‡Ba se d o n S w is s-Pro t a nd N C BI d at ab as es . §N eg at iv e v al ue : Pro te in d ow nr eg ul at io n; P os iti ve v al ue : Pro te in u pr eg ul at io n. ¶M S/ M S is t he n um b er o f m at ch ed p ep tid es f ro m i on p ar en t f ra gm en ts . p I E xp : Is oe le ct ric p oi nt a s d et er m in ed f ro m t he 2 -D g el e xp er im en t. ta bl e 2 . P ro te in s d iff er ent ia lly e xp re ss ed i n St ap hy loc oc cu s a ur eu s s a3 s tr ai n a ft er e xp os ur e to u sn ic a ci d ( co nt .).
ta bl e 2 . P ro te in s d iff er ent ia lly e xp re ss ed i n S tap hy loc oc cu s a ur eu s s a3 s tr ai n a ft er e xp os ur e to u sn ic a ci d ( co nt .). la be l a bbr evi at ed na m e D es crip tio n na m e pi theo M w th eo sc ore † sw is s Pr ot /N cB i ac ‡ G en e na m e M ol ec ul ar fun ct io n Bi ol og ic al p ro ce ss Fo ld -cha ng e va ria tio n § M s/ M s ¶ D W 11 GLM S G lu ta m in e– fruc to se -6 -ph os ph at e ami not ran sf er as e (is om eri zi ng ) 4. 93 65 ,92 3 38 Q 5H E49 glm S Ca rb oh yd ra te bi nd in g_ gl ut am in e-fr uc tos e- 6-ph os ph at e t ra ns am in as e (is om eri zi ng ) a ct iv it y Ca rb oh yd ra te bi os yn th eti c p ro ce ss _ gl ut ami ne m et ab ol ic pr oce ss -1 .4 – D W 12 G LY A Se rin e h yd ro xy -m et hy l tr an sf er as e 5. 75 45 ,3 15 90 A 7 × 4 V7 gl yA G ly cin e hy dro xy m eth yl -tr ans fe ra se a ct iv it y_ py rid ox al p ho sp hat e bin din g G ly cin e b ios yn th eti c pro ce ss fro m s er in e_ te tr ah yd ro fo la te in ter co nv er si on -1 .2 1 D W 13 PCK A Pho s p ho eno l-py ruva te c ar bo xy -ki na se (AT P) 5. 74 59 ,5 11 82 A 7 × 3 N 3 pck A AT P b in di ng _m et al ion bi nd in g_ pho sp ho eno lp yr uv at e ca rb ox yk in as e ( AT P) a ct iv it y G luc on oge ne si s -8. 5 – D W 14 RO CA 1-py rro lin e- 5-ca rb ox yl at e deh yd ro ge na se 4.9 8 57, 00 3 13 3 A 7 × 6 R7 ro cA 1-py rr ol in e-5 -c ar box yl at e deh yd ro ge na se a ct iv it y_ ox idor ed uc ta se a ct iv it y, ac tin g o n t he a ld eh yd e o r ox o g ro up o f d on or s, N A D or N A D P a s a cc ep to r G lu ta m at e b ios yn th eti c pro ce ss _p ro lin e bi os yn th eti c p ro ce ss _ pr ol in e c at ab ol ic p ro ce ss to g lu ta m at e -3 .4 1 D W 12 9 FA BG 3-ox oa cyl -(a cyl -ca rri er -p ro tei n) re du ct as e f ab g 5. 58 26 ,1 86 74 Q 6G 9Y 2 fa bG 3-ox oa cy l-( ac yl -c ar rier -pr ot ei n) re du ct as e ( N AD PH ) ac tiv it y_ N A D b in din g_ N A D P b in din g Fa tt y-ac id e leng at io n -1 .3 2 D W 13 1 Y2 F × 2 7 (M 15 39 ) Pro te as e I , p ar tia l 4. 46 18 ,18 9 141 gi |5 786 86 62 4 Q5 86 _0 23 56 Pep tid as e a ct iv it y_ hyd ro la se _p ro te as e Pr ot eo ly sis -1 .9 – †Va lu es a re L og10 (p ), w he re p is t he p ro b ab ili ty t ha t t he o bs er ve d m at ch is a r an do m e ve nt ; b as ed o n S w is s-Pro t a nd N C BI d at ab as es u si ng t he M A SC O T s ea rc hi ng p ro gr am . ‡Ba se d o n S w is s-Pro t a nd N C BI d at ab as es . §N eg at iv e v al ue : Pro te in d ow nr eg ul at io n; P os iti ve v al ue : Pro te in u pr eg ul at io n. ¶M S/ M S is t he n um b er o f m at ch ed p ep tid es f ro m i on p ar en t f ra gm en ts . p I E xp : Is oe le ct ric p oi nt a s d et er m in ed f ro m t he 2 -D g el e xp er im en t.
ta bl e 3 . P ro te in s e xc lu si ve ly i nd uc ed i n St ap hy loc oc cu s a ur eu s s a3 s tr ai n a ft er e xp os ur e to u sn ic a ci d. la be l a bbr evi at ed na m e D es crip tio n na m e pi exp Mw sc ore † sw is s Pr ot /N cB i ac ‡ M ol ec ul ar fun ct io n ce llu lar com pon en t Bio lo gic al pr oc es s li Ft (M s2 ) ion p are nt m as se s (m /z ) sc ore se qu en ce D 1 CE /N D hd y A cy l es te ra se 5. 23 60 ,32 5 10 3 H 3Z V Y0 / gi |4 46 527 85 8 H yd ro la se a cti vi ty _ tr ans fe ra se a ct iv it y, tr an sfer ring a cy l gro ups o th er th an am in o-a cy l gr ou ps M em bra ne Me ta bo lic pr oce ss 15 95 .6 712 16 65 .7 29 6 93 0. 50 31 14 5 K. A M IP WE G LN D M YR .E R.EV A FH G G IP D TG FY R.F K. W LY VHGR .K D3 CE /N D hd y A cy l es te ra se 5. 46 64 ,3 87 71 gi |3 87 60 387 5 H yd ro la se a cti vi ty _ tr ans fe ra se a ct iv it y, tr an sfer ring a cy l gro ups o th er th an am in o-a cy l gr ou ps M em bra ne Me ta bo lic pr oce ss 16 65 .7 886 93 0. 4999 66 R.EV A FH G G IP D TG FY R.F K. W LY VHGR .K D 4 CE /N D hd y A cy l es te ra se 5. 23 60 ,32 5 14 4 H 3Z V Y0 / gi |4 46 527 85 8 H yd ro la se a cti vi ty _ tr ans fe ra se a ct iv it y, tr an sfer ring a cy l gro ups o th er th an am in o-a cy l gr ou ps M em bra ne Me ta bo lic pr oce ss 15 95 .7 27 7 166 5. 794 2 93 0. 49 92 12 3 K. A M IP WE G LN D M YR .E R.EV A FH G G IP D TG FY R.F K. W LY VHGR .K D7 U P3 55 U PF 03 55 pro te in 4. 86 15 ,11 3 41 – U nk now n – U nk now n 25 57. 20 98 14 96 .7 59 8 10 7 K. LH LN D LH D SE IS LIS T-SG TFS D R. M K. LL TG ED G EH AV LSR .Y DB Z3 FL B5 _ STA AU H A D f am ily hyd ro la se, pa rtia l 4. 44 28 ,2 37 30 gi |4 461 08 45 6 H yd ro la se a cti vi ty – Me ta bo lic pr oce ss 184 4. 84 02 14 59 .6 09 9 15 37. 75 06 19 0 K. SIG KQDF DE IV D YC R. D K. QDF DE IV D YC R. D K. VM G VD YV AN IT EAR .I †Va lu es a re L og10 (p ), w he re p is p ro b ab ili ty t ha t t he o bs er ve d m at ch is a r an do m e ve nt ; b as ed o n S w is s-Pro t d at ab as e u si ng t he M A SC O T s ea rc hi ng p ro gr am . ‡Ba se d o n S w is s-Pro t a nd N C BI d at ab as es . A C : A cc es si on n um b er ; H A D : H al oa ci d d eh al og en as e; p I E xp : is oe le ct ric p oi nt a s d et er m in ed f ro m t he 2 -D g el e xp er im en ts ;P M F: P ep tid e m as s fi ng er .
Figure 4. Functional categories of proteins differentially produced by Staphylococcus aureus sa3 strain in response to usnic acid at 1/64 × minimum inhibitory concentration. Gene ontology
functional analysis [38] defined six main functional groups, both in usnic acid and control samples: metabolism, nucleotide biosynthesis and degradation, cell response to stress, protein biosynthesis folding and degradation, cell cycle and cell signaling. No statistically significant differences were found in the percentage of each functional group, in USN and CTRL samples. CTRL: Control; USN: Usnic acid.
13 42 19 17 8 1 USN CTRL 9 1 40 15 21 15 Metabolism
Cell response to stress Cell cycle
Nucleotide biosynthesis and degradation Protein biosynthesis folding and degradation Cell signaling
Particularly, SEM analysis showed that USN exposure at 1/8 × MIC and 1 × MIC concentra-tions dramatically affects cell survival, as shown by the strong reduction of cells compared with CTRL (Figure 7a). The few aggregates of appar-ently living cells appear extensively damaged and surrounded by cell debris, likely resulting from cell degeneration (Figure 7a). Contrarily, expo-sure at 1/64 × MIC had a moderate effect on cell viability (Figure 7B), even though TEM analysis showed a higher number of cells with broken walls, protoplast and cell debris compared with CTRL (Figure 8a).
Morphological investigations highlighted cell shape alterations (i.e., irregular, swollen, oval), extensively damaged wall surface and membrane alterations (i.e., invaginations and disconti-nuities), all of which were not observed in the untreated control cells. In particular, SEM anal-ysis revealed that USN exposure at 1/64 × MIC caused rough, shrunken surface with irregular folds even in dividing cells (Figure 7B). In addi-tion, TEM evaluation outlined that exposure at
1/64 × MIC produced an increased thickness of the cell wall and marked disorganization, characterized by fibrillary rather than a com-pact structure as observed in CTRL, as well as induced extensive cell wall breaks presumably causing cell lysis and death (Figure 8B).
●
● Pi uptake assay
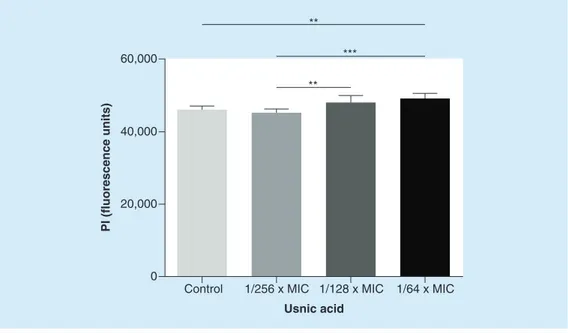
To test whether USN caused membrane insta-bility, we added PI to the treated cultures after 24- h exposure. PI, when associated with DNA, fluoresces intensely and its use in this context indicates whether or not S. aureus Sa3 mem-branes are more permeable to PI after treatment. Our data showed that there was a dose-depend-ent trend, observing a steady increase in fluore-scence level with increasing USN concentrations (Figure 9).
Discussion
●
● Proteomic analysis
The mechanisms underlying the anti-staphylo coccal effects of USN are still largely
Fig ur e 5 . P ro te in -in te rac tio n n et w ork s. P ro te in -in te ra ct io n n et w or k o f ( a ) c on tr ol -re la te d an d (B) u sn ic a ci d-re la te d n ew ly a nd d iff er en tia lly e xp re ss ed p ro te in s, e xt ra ct ed us in g t he S TR IN G s ea rch t oo l. Path
5 Protein biosynthesis-translation process
Path
6 Nucleotide biosynthesis
Path 1 Hyperosmotic and heat shock response-protein binding Path
2 Energetic metabolism Path 3 Nucleotide biosynthesis Path 4 Protein degradation Path
1 Biosynthesis fat acid
Path 4 Purine metabolism Path 2 Hexosamine metabolism Path 5 Folate metabolism Path 6 Glicine degradation Path 7 Oxidative metabolism Path 3 Tetrahydrofolate synthesis
Fi gu re 6 . e ff ec t o f u sn ic a ci d a t s ub -M ic s o n t he e xp re ss io n l ev el s o f 1 1 v ir ul en ce g en es b y St ap hy loc oc cu s a ur eu s s a3 . C ell s w er e e xp os ed ( 24 h , 3 7° C) a t s ev er al su bi nh ib ito ry u sn ic a ci d c on ce nt ra tio ns ( ba rs , f ro m l ef t t o r ig ht : 1 /2 56 ×, 1 /1 28 × a nd 1 /6 4 × m in im um i nh ib ito ry c on ce nt ra tio n) . C on tr ol s am pl es w er e n ot e xp os ed t o u sn ic aci d b ut v eh icl e o nl y. R es ul ts a re s ho w n as r el at iv e e xp re ss io n ( n = 6 ; m ea n + s ta nd ar d d ev ia tio n) . * p < 0 .0 5 v er su s c on tr ol ; p ai re d t-te st . ** p < 0 .0 1 v er su s c on tr ol ; p ai re d t-te st . ** * p < 0 .0 01 v er su s c on tr ol ; p ai re d t-te st . agrA -1.0×1 0 -2 0 1.0×10 -2 2.0×10 -2 *** ** ** Relative expression icaA 1.0×10 1 2.0×10 1 Relative expression icaB -2.5×10 -2 2.5×10 -2 5.0×10 -2 7.5×10 -2 1.0×10 -1 1.3×10 -1 ** *** Relative expression icaC -2.0×10 -2 -1.0×10 -2 1.0×10 -2 2.0×10 -2 3.0×10 -2 4.0×10 -2 *** *** *** Relative expression -3.0×10 -0 3 -2.0×10 -0 3 -1.0×1 0 -0 3 2.3×10 -1 0 1.0×10 -0 3 2.0×10 -0 3 3.0×10 -0 3 4.0×10 -0 3 5.0×10 -0 3 6.0×10 -0 3 icaD *** ** * Relative expression eno -1.5×1 0 -0 -1.0×1 0 -0 -5.0×10 -1 *** ** *** Relative expression fib 1.0×10 -2 2.0×10 -2 3.0×10 -2 4.0×10 -2 5.0×10 -2 6.0×10 -2 Relative expression -5.0×10 -2 5.0×10 -2 1.0×10 -1 1.5×10 -1 2.0×10 -1 2.5×10 -1 3.0×10 -1 3.5×10 -1 fnb A *** Relative expression ebps -1.0×1 0 -2 -7.5×10 -3 -5.0×10 -3 -2.5×10 -3 * ** Relative expression geh -4.0×10 -1 -3.0×10 -1 -2.0×10 -1 -1.0×1 0 -1 1.5×10 -8 *** ** ** Relative expression nuc -6.0×10 -2 -4.0×10 -2 -2.0×10 -2 * ** *** Relative expression 0 0 0 0 0 0 0 0
Figure 7. scanning electron microscopy analysis of S. aureus sa3 exposed to usnic acid at sub-minimum inhibitory concentrations. (a) Images show the extensive cell death following exposure to usnic acid at 1/8 × MIC and 1 × MIC. (B) Close-ups show the normal,
smooth surface of the unexposed cells (CTRL, left), compared with the shrunken surface with irregular folds of the cells exposed to usnic acid at 1/64 × MIC (right).
CTRL: Control (unexposed) sample; MIC: Minimum inhibitory concentration.
CTRL-1/64 x MIC 1/8 x MIC
1/64 x MIC
1 x MIC
unknown and conflicting. Recently, Maciąg-Dorszyńska et al. showed that the antibacterial activity of USN is mainly due to inhibition of DNA and RNA synthesis [39]. Different find-ings were obtained by Gupta et al. who observed the disruption of the cell membrane in MRSA strains exposed to USN [40]. No studies have been published with regard to MRSA from CF patients.
The effect of USN at sub-MIC on protein expression by an MRSA strain from CF patient was investigated for the first time in the pre-sent study, by identifying newly or differentially expressed proteins through proteomic analysis.
The exposure to USN remarkably decreased the expression of some general metabolic pathway- related proteins based on their func-tions, as also assessed by Gene Ontology
functional analysis. Particularly, we observed a decreased expression of two proteins involved in oxidative metabolism (MQO2 and PCKA), two proteins involved in hexosamine metabolism (glucosamine-6-phosphate isomerase NAGB and glutamine-fructose-6-phosphate amino-transferase GLMS), 3-oxoreductase acyl-carrier protein FABG (fatty acid bio synthesis), and glycine hydroxymethyltransferase GLYA (folate metabolism).
In addition, there was decreased expression of 1-pyrroline-5-carboxylate dehydrogenase, involved in protein degradation, and the amino-acyl-tRNA synthetase PheRS, an essential enzyme which catalyzes the transfer of phenyl alanine to the Phe-specific transfer RNA (tRNAPhe), a key step in protein biosynthesis and therefore essential for cell viability. Although structural
Figure 8. transmission electron microscopy analysis of Staphylococcus aureus sa3 exposed to usnic acid at 1/64 × Mic. (a) Comparison at different magnifications between unexposed (upper
images) and exposed samples to usnic acid at 1/64 × MIC (lower images): note the regularly rounded shape of the CTRL cells compared with the irregular morphology of the exposed cells. (B) Close-ups of damaged cells exposed to usnic acid at 1/64 × MIC; note the extensively damaged wall surface and the membrane.
CTRL: Control (unexposed) sample; MIC: Minimum inhibitory concentration. and phylogenetic analyses revealed three
differ-ent forms of PheRS (bacterial hetero tetrameric, eukaryotic/archaeal heterotetramic and mito-chondrial monomeric), the binding modes and the recognition modes of cognate tRNAPhe are different in prokaryotes and eukaryotes [41]. These findings show that the enzyme is of con-siderable interest for the development of new anti-bacterial agents [42]. In particular, the resulting downexpression induced by USN could be detri-mental to the cell and thus provide the basis for proposing this secondary metabolite from lichens as a novel antibacterial agent.
It is worthy of note that the affected metabolism of the amino acids (phenyl-alanine, glycine, glutamate, proline, serine
and N-acetylglucosamine) – we observed in USN-treated MRSA cells – may be associated with the decrease in protein and peptidoglycan synthesis since these amino acids are crucial in both biological processes [43,44]. In particular, the reduced glycine content, which is an amino-acid composition of peptidoglycan cross-bridges, might excite the aberrant cell septum formation and retard cell division [45]. Such a possibility is also supported by the data collected with SEM and TEM analyses, as discussed below.
Following treatment with USN at subinhibi-tory concentrations, S. aureus Sa3 strain signifi-cantly upregulated the expression of several pro-teins, such as those involved in oxidative stress and lactose metabolic pathway.
1/64 x MIC
1/64 x MIC
Figure 9. Propidium iodide uptake by Staphylococcus aureus sa3 treated with increasing
concentrations of usnic acid. Bacterial cultures were incubated without usnic acid (control) and with
three different subinhibitory concentrations of usnic acid. Results are shown as mean + SD (n = 6). **p < 0.01, ANOVA + Tukey’s multiple comparison post-test.
***p < 0.001, ANOVA + Tukey’s multiple comparison post-test. MIC: Minimum inhibitory concentration.
Usnic acid
PI (fluorescence units)
Control 1/256 x MIC 1/128 x MIC 1/64 x MIC 0 20,000 40,000 60,000 ** *** **
The adaptation of the bacteria to survival under stress conditions is suggested by the increased expression of ScdA and NADH:flavin oxido-reductase proteins. Nitrosative stress, resulting from the enzymatic or non-enzymatic synthesis of NO-, hypoxia and the perturbation of iron homeostasis cause in fact the induction of genes encoding putative iron-containing proteins, par-ticularly the iron-sulfur SCDA protein, fulfilling crucial redox, catalytic and regulatory functions in virtually all organisms [46–49]. In this picture, the upregulation we observed of GUAA and pep-tide deformylase could represent a partial com-pensation for the need to repair damage caused by oxidative stress. GUAA is a putative glutamine amidotransferase of Class I family enzyme with a potential role in purine ribo nucleotide biosyn-thesis [50], while peptide deformylase is needed to remove the formyl moiety from the growing pep-tide [51]. Both proteins are essential for S. aureus growth and virulence [50,51], therefore represent-ing attractive targets for the development of novel antibacterials.
Exposure to USN also upregulated both LACB and LACC proteins. S. aureus, Staphylococcus epidermidis and Staphylococcus hominis are the only organisms known to exclusively use enzymes of the d-tagatose-6-phosphate pathway
to metabolize lactose and d-galactose [52]. In S. aureus, d-galactose and lactose are imported and meta bolized by proteins encoded by the lactose operon, lacABCDFEG [53].
Partition or segregation is the essential pro-cess whereby the genetic material is actively distributed into daughter cells. In prokaryotes, type II plasmid partition systems utilize ParM NTPases in coordination with a centromere-binding protein called ParR to mediate accurate DNA segregation, a process critical for plasmid retention [54]. Our data indicated that USN, by increasing ParM expression, could therefore facilitate the acquisition of antibiotic resistance elements in S. aureus as well as the transfer of virulence factor genes [55,56].
With regard to the proteins specifically induced in the Sa3 strain following treatment with USN, it is worth noting the presence of two isoforms of the Acyl-CoA esterase family, involved in the synthesis of Phase II of long-chain fatty acids, especially in the biogenetic pro-cess of the bacterial cell wall [57]. This is highly suggestive of a cell-wall repair mechanism, thus confirming our previous proteomic and ultra-structural observations. FAS-II bacterial fatty-acid biosynthesis pathway is highly conserved across many bacterial systems since its high
affinity for longchain fatty acids enables bacteria to grow and survive in environments with high concentrations of acyl-esters as a C source [58–60].
In addition, Acyl-Coa esterase could also inter-act with other lipolytic enzymes to digest environ-mental lipids, therefore enhancing staphylococcal virulence [57]. Taking into account the essential-ity of FAS-II pathways for MRSA [61], this sys-tem could be considered a possible target for the development of new antibacterial drugs [60,62].
Furthermore, the comparative evaluation of Protein Interactive Networks obtained for CTRL and USN samples interestingly revealed that the exposure to USN causes the lack of some proteins, such as RpoZ and CspA. It has recently been shown that RNA polymerase enzyme (RpoZ) is crucial for biofilm synthesis in Mycobacterium smegmatis because of a deficiency in generating the extracellular matrix [63]. USN could, there-fore, affect the adhesive ability of planktonic cells by reducing extracellular matrix synthesis and, consequently, counteract biofilm formation.
CspA is a small cold shock protein involved in cell response to stress [64]; in particular, it belongs to a family acting as regulator of pro-tein biosynthesis or specifically in transcription and translation mechanisms involved in cell protection at low temperatures.
●
● electron microscopy analyses
The morphological evaluation performed by SEM and TEM analyses clearly revealed that USN dramatically affects S. aureus viability in a dose-dependent manner. Growth in the pres-ence of USN generated profound abnormali-ties in both S. aureus morphology and ultra-structure. In agreement with the proteomic findings, USN mainly caused cell-wall dam-age in S. aureus with thickenings, folding and breaks. The PI uptake assay further confirmed this mechanism of action showing that there was a dose-dependent membrane permeability to PI following exposure to USN.
A similar increase in cell-wall thickness was previously observed in staphylococci following exposure to some antibiotics, such as chloram-phenicol and penicillin [65]. Overall, these results suggest that cells with thickened wall may represent a defensive response to USN and its mechanism of action.
●
● Virulence (biofilm) gene expression As for other Gram-positive bacteria, the patho-genicity of S. aureus is mainly dependent upon
the secretion of numerous extracellular virulence factors. Consequently, the efficacy of antibiotic therapy for the treatment of S. aureus infections relies not only on their respective bactericidal or bacteriostatic activities but also on their ability to affect the release of virulence factors. An alter-native therapeutic strategy could therefore be based on the reduction of bacterial pathogenicity rather than on placing immediate life-or-death pressure on the target bacterium [66].
The virulence factors employed by S. aureus to cause diseases consist of cell wall surface-exposed and secreted proteins, such as lipase and thermonuclease [67–69]. Lipase functions in virulence by degrading lipids in order to help the bacterium acquire nutrients, and its expres-sion is higher in strains causing deep infections (i.e., septicemia, osteomyelitis) rather than in those associated with superficial ones (i.e., impe-tigo, or from nasal mucosa) [70]. Thermonuclease is involved in facilitating the escape of S. aureus from neutrophil extracellular traps, and contri-butes to disease pathogenesis in a murine res-piratory tract infection model [69]. The role of these enzymes in S. aureus CF pathogenesis has yet to be studied. Recently, it has been observed that lipase activity is highly maintained in the B. cepacia complex and that it could have a potential role in lung epithelial cell invasion [71].
Our data clearly showed that exposure to subinhibitory USN concentrations causes sig-nificant reduction of nuc and geh expression, therefore suggesting that the structure of this secondary metabolite from lichens could be used as a fundamental structure for the development of antimicrobial agents aimed at the reduction of bacterial virulence.
The adhesion of bacteria to host cells or indwelling medical devices is an important pre-requisite for both infection and the initiation of biofilm formation. The adherence stage of S. aureus to both the native tissues and abiotic surfaces is mediated by a protein family of staphylococcal microbial surface components recognizing adhesive matrix molecules, such as fibronectin binding proteins (FnbA and FnbB), laminin binding protein (Eno), elastin binding protein (EbpS) and fibrinogen binding protein (Fib) [72–74].
We recently observed that in vitro USN is able to prevent the formation of biofilms and to dis-rupt established biofilms by S. aureus strains iso-lated from CF patients [24]. To gain new insights in the mechanisms underlying this antibiofilm
activity, real-time RT-PCR was carried out to evaluate the effect of subinhibitory USN con-centrations on the expression of several genes encoding products involved in S. aureus biofilm formation. Our results indicated that exposure to USN significantly reduces the transcription of the gene encoding adhesins for the host matrix binding proteins elastin, laminin and fibronec-tin by MRSA Sa3 strain – a strong indication that USN impairs the efficacy of ligand bind-ing needed for the bacterial cells to adhere to host and further reduces infection initiation and biofilm formation.
The well-known relationship between the chronicization of infection and the presence of biofilm in CF patients [75], reinforces the clinical relevance of antibiofilm effects of USN.
This effect does not seem to involve the fibrin-ogen receptor, although the lack of statistical significance could be mainly due to the high variability of data obtained. The mechanism underlying antibiofilm activity of USN could also involve a decreased lipase and thermo-nuclease expression. It has been in fact observed that lipase encoding genes were induced and found to be among the upregulated genes involved in biofilm formation in S. aureus [76]. Lipase inhibitors such as farnesol and antilipase serum have been demonstrated to reduce biofilm formation in S. aureus [77,78]. Recently, studies have shown that S. aureus Nuc secretion controls biofilm, remodeling the eDNA matrix acting as a biofilm inhibitor [79].
The activation of the quorum-sensing sys-tem agr has a negative impact on biofilm for-mation in S. aureus. Agr activation results in fact in the expression of extracellular proteases and membrane-active molecules that both con-tribute to the dispersal of biofilms [80]. Our results showed that the effect of USN on agrA expression is concentration-dependent, result-ing decreased in the presence of concentrations at 1/64× and 1/128 × MIC, while increased at 1/256 × MIC. Further studies are needed for a better comprehension of these findings. conclusion & future perspective
The present work explored the anti-staphy-lococcal mode of action of USN by using, for the first time in literature, an integrated approach consisting of proteomic, genomic and ultrastructural analyses.
Overall, our results showed that USN: exerts its anti-staphylococcal effect mainly through
cell-wall damage and inhibition of bacterial growth, mainly due to reduced amino-acid bio-synthesis, and protein synthesis; affects S. aureus adhesion (the early stages of biofilm formation) by reducing both the synthesis of adhesins for the host matrix binding proteins, and the bac-terial extracellular matrix; reduces the patho-genic potential of S. aureus also by affecting the expression of relevant virulence factors, such as lipase and thermonuclease.
Taken together, our findings provide a theo-retical basis for the potential application of USN as a therapeutic agent against MRSA infections that increase morbidity, mortality healthcare costs, whose control continues to be an unre-solved issue in many hospitals worldwide. The use of USN in fact could offer new perspectives into both prevention and treatment of biofilm-related and difficult-to-treat staphylococcal chronic lung infections in CF patients. USN could be used as a ‘probe’ for the identification of new targets for antimicrobials. In this regard, the present study has provided new insights on the mechanism of action of USN, therefore, pav-ing the way for the identification of new molecu-lar targets. The identification and characteriza-tion of novel objectives and new lead compounds for chemotherapy could lead to the development of more effective anti biotics which could delay resistance. Although the use of USN in thera-peutic application is rather limited due to toxic-ity issues, its encapsulation could maintain and improve its biological activity while considerably reducing the toxicity of this drug [20]. Further investigations are, therefore, warranted to under-stand the real therapeutic potential of USN by means of in vivo models and well-designed, evidence-based, randomized clinical studies.
acknowledgements
The authors thank Prof S Moreno (Department of Science – LIME, University Roma Tre, Rome, Italy) for technical assistance and helpful suggestions on the electron microscopy analysis, Prof PG Righetti (Department of Chemistry Materials and Chemical Engineering ‘Giulio Natta’, Politecnico di Milano, Milan, Italy) for his valuable revi-sion of the manuscript, and Rachel Price and Sandra Cicchitti (English Reader, Linguistic Center, ‘G d’Annunzio’ University of Chieti) who assisted in the proof-reading of the manuscript with no charge.
author contributions
G Di Bonaventura, S Angelucci and C Di Ilio designed the research, analyzed and wrote the paper; A Pompilio,