The Effect of Morphometry, Land-Use and
Lithology on Landslides Susceptibility:
An Exploratory Analysis
Laura COCO and Marcello BUCCOLINI
Department of Engineering and Geology, University “G. d'Annunzio”, Italy
Abstract. GIS features provide simple and useful tools for landslides susceptibility and hazard studies, allowing the
identification and the quantification of predisposing factors, and their relative importance. In lithologically homogeneous areas, the most influent factor of landslides is slope morphometry, in particular inclination, height and form. Moreover, within a hydrographic basin, landslides are coupled with drainage network. In fact landslides density and drainage density are positively correlated. Furthermore, human activity strongly influences the development of landslides. In our previous works, we introduced MSI (Morphometric Slope Index) as general index for slope morphometry, combining the main linear and areal morphometric features (area, form, length, inclination, width). Its formula is: (where A3D is
the three-dimensional area of the slope, A2D is its plan area, L is the slope length and Rc is the circularity ratio). We tested MSI
as driver of different erosion landforms, demonstrating its influence in determining, on the one hand, the development and the final arrangement of calanchi drainage network (the typical Italian badlands), and, on the other hand, the erosion processes within them, mainly gullies and landslides.
The present study is an exploratory application of this index to landslides susceptibility, aimed to analyze the combined effect of slope morphometry (summarized in MSI), lithology and land-use on the distribution of landslides in small catchments. The study is located in the Italian periadriatic foredeep, in the Abruzzo Region. This study has reinforced our perspective about the validity of the application of the techniques of geomorphometric analysis to the landslides susceptibility. Especially we consider this approach an efficient tool to summarize different controlling factors.
Keywords. Slope morphometry, land-use, lithology, landslides susceptibility.
1. Introduction
Advances in Geographical Information System (GIS) technology and the increasing availability of digital elevation models (DEMs) had been leading to the growth of quantitative analysis of earth surface for the last decades. These analyses are aimed in particular at landslides hazard and risk assessment (Korup, 2005; Carrara and Pike, 2006). Because the shape of the land surface plays a fundamental role in landslide processes, linking landslide inventories and GIS enables to model (1) the predisposing factors, (2) the triggering mechanisms, and (3) the interference with the drainage network. Mathematical/statistical tools allow to point out functional relations between landslide magnitude (such as affected area or volume, frequency or density) and topographical driver factors (Hovius et al., 1998; Dai and Lee, 2001; Guzzetti et al., 2005).
In lithologically and climatically homogeneous areas, one of the main driver factors of landslides is slope morphometry. The slope angle is considered the principal parameter, but also the elevation range where landslides occur, the slope aspect and shape are important factors (Guzzetti et al., 1999; Dai and Lee, 2002; Komac, 2006; Domínguez-Cuesta et al., 2007; Chen and Wang, 2007; Conforti et al., 2012; Rotigliano et al., 2012). However, some studies verified that the last two parameters are more sensitive to lithology and geological structure, and slope angle depends on its derivatives (irradiance, transverse and longitudinal curvature). Therefore it is sufficient to consider only one of the associated parameters (Regmi et al., 2010).
Moreover, within the hydrographic basin, slope and landslide processes quickly respond to the incision and development of the river drainage network. It exerts a direct control over the fluvial geomorphological processes (Korup et
T. Schweckendiek et al. (Eds.) © 2015 The authors and IOS Press.
This article is published online with Open Access by IOS Press and distributed under the terms of the Creative Commons Attribution Non-Commercial License.
al., 2010). Drainage systems may adversely influence slope instability because surface water promotes landslides by undercutting and eroding slopes, and saturating their lower part (Dai et al., 2001; Yalcin et al., 2008; Regmi et al., 2010; Conforti et al., 2011).
At the same time, human activity influences slope stability through land use and land cover (LU/LC) changes. It is also one of the key factor responsible for landslides. Land cover acts as a shelter and reduces the susceptibility of soil erosion and landslides and reduces the effect of rainfall on the soils (Yalcin et al., 2008; Regmi et al, 2010). LU/LC is then often used as predisposing factor in landslide susceptibility assessment.
Some studies (Buccolini et al., 2012; Buccolini and Coco, 2013) introduced a unique reference index for basin morphometry, named MSI (Morphometric Slope Index). It includes both areal and linear features (such as size, shape, inclination, length and width) in the formula
(1) where, A3D and A2D are surface and plane area, L is slope length, Rc is circularity ratio. The testes on calanchi (Italian badlands, considered as miniature catchments models, lithologically and climatically homogeneous) demonstrated its effectiveness in determining the arrangement of drainage network, the type of erosion processes (gullies and/or landslides) and the amount of erosion.
The present study is an exploratory application of MSI to landslides susceptibility in small drainage basins, aimed at analyzing the combined effect of the slope morphometry (summarized in MSI), the arrangement of drainage network, the lithology and the land-use on the distribution of landslides. Considering the current topography of some selected basins affected by superficial landslides, the influence of slope topography on the development of current landslides will be analyzed hereafter in combination with other predisposing factors (drainage network, land cover). The selected study areas are located in the Italian Periadriatic foredeep, in the Abruzzi Region.
2. Methodology 2.1. Study area
The Periadriatic belt of Abruzzi Region lies in the Pliocene and Pleistocene foredeep succession of the Apennine chain, and is composed of clays in which are interposed clastic deposits with lenticular geometry. A powerful deposit of sands, gravels and conglomerates of fluvial-deltaic or coastal environment closes the sedimentary cycle (Bigi et al., 1995). These deposits are arranged in a northeastern vergence monocline as consequence of the compressive phase and the subsequent uplift, started since the Pleistocene and still active (Cantalamessa et al., 2004; Crescenti et al., 2004). A significant synsedimentary tectonic activity displaced the basin in sectors at different tectonic-sedimentary evolution, some lowered (piggy-back basins), others elevated (Centamore and Nisio, 2003). The sedimentary sequence is cut from West to East by the main watercourses whose corresponding valley floors are often filled by fluvial deposits (Buccolini et al., 2007). The secondary valleys of the hilly sector are set in the erodible clay levels and are characterized by a marked asymmetry due to the substrate geological structure. The extensive coastal morphostructures are, on the other hand, cut by almost symmetrical low-order valleys directly flowing into the Adriatic Sea.
Climatically, this area belongs to temperate sub-littoral regime with scarce annual rainfall, mainly autumnal, and medium temperatures (Fazzini and Giuffrida, 2005). Summer is rather dry, especially near the coast and on the low-hills. These climatic conditions favor intense erosion processes.
2.2. Materials and methods
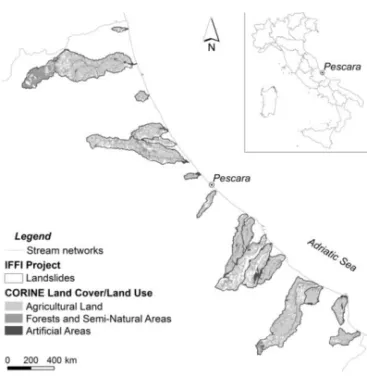
As sample basins, 17 small basins directly flowing in the Adriatic sea were selected in Abruzzi having quite homogeneous geological and climatic features: Giardino, Salinello, Borsacchio, Calvano, Cerrano, Piomba, Mazzocco, Vallelunga, Arielli, Riccio, Moro, Feltrino, Grande, Osento, Acquachiara, Lebba, Buonanotte (from N to S in Figure 1). They were handled within ArcGIS 9.3 using the regional
DEM with 10 m cell-size provided by the Cartographic Services Office of the Abruzzi Region.
Figure 1. The analyzed basins (listed from N to S in the text).
The drainage features of each basin were extracted using TauDEM (Terrain Analysis Using Digital Elevation Models) toolbox developed by Prof. Tarboton and freely downloadable from his website (Tarboton, 1997). The Single Watershed Model tool was used, which automatically delineates stream networks and watersheds following a sequence of tools starting from the DEM and the outlet point shapefile, and producing the hydrological correct stream network and watershed shapefiles. They were subsequently compared by visual inspection to the Regional Topographic Maps (CTR) at scale 1:5000. After measuring the total stream length (l) and the plane area (A2D) for each basin, the drainage density was computed by their ratio
(2).
Considering the actual surface on the DEM, the plan and tridimensional area (A2D and A3D, respectively), the basin length (L) and the circularity ratio (Rc) were measured to calculate MSI using Eq. (1).
As landslides inventory, the Inventory of Landslide Phenomena in Italy (IFFI Project 2003, Inventario dei Fenomeni Franosi in Italia) shapefiles were used. It was carried out by the Italian Institute for Environmental Protection and Research (ISPRA, Istituto Superiore per la Protezione e la Ricerca Ambientale) and supplies a detailed picture of the distribution of landslide phenomena within the Italian territory. In each selected basin, the total surface area occupied by landslides was estimated (AL) and the areal Landslides Density (DL) was calculated by
(3).
As land use inventory, the CORINE Land Cover 2006 (Co-ORdination of INformation on the Environment) database was used. It is a geographic LU/LC database encompassing most of the countries of the European Community, carried out by the European Environment Agency (EEA). The first level classification was considered which corresponds to the main categories of the LU/LC: Artificial Areas, Agricultural Land, Forests and Semi-Natural Areas. The areal surfaces covered by each category were measured in every basin and expressed in terms of basin area percentages, named respectively % Art, % Agr, % Nat.
Using statistics in Excel 2010 (Data Analysis tools), the relations among the areal frequency of landslides and the predisposing parameters were investigated, in order to define the functional relations between landslide magnitude and their main driver factors at basin scale.
2.3. Results
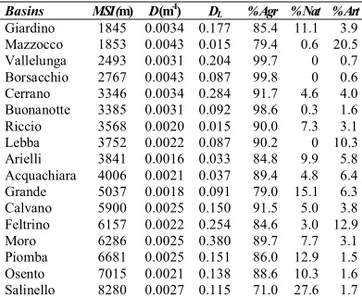
The complete database of the measured parameters is reported in Table 1.
The analysis of CORINE LU/LC at the basin scale showed an almost total homogeneity of the analyzed territory that fall almost entirely in the category ‘Agricultural Land’ except for small areas in ‘Artificial Areas’ and ‘Forests and Semi-Natural Areas’ (Tab. 1). Therefore, this parameter could not be considered in the statistics, because it was not possible to derive quantitative data in such uniform areas.
Table 1. Database of the measured parameters, sorted by
increasing MSI.
Basins MSI (m) D (m-1
) DL % Agr % Nat % Art
Giardino 1845 0.0034 0.177 85.4 11.1 3.9 Mazzocco 1853 0.0043 0.015 79.4 0.6 20.5 Vallelunga 2493 0.0031 0.204 99.7 0 0.7 Borsacchio 2767 0.0043 0.087 99.8 0 0.6 Cerrano 3346 0.0034 0.284 91.7 4.6 4.0 Buonanotte 3385 0.0031 0.092 98.6 0.3 1.6 Riccio 3568 0.0020 0.015 90.0 7.3 3.1 Lebba 3752 0.0022 0.087 90.2 0 10.3 Arielli 3841 0.0016 0.033 84.8 9.9 5.8 Acquachiara 4006 0.0021 0.037 89.4 4.8 6.4 Grande 5037 0.0018 0.091 79.0 15.1 6.3 Calvano 5900 0.0025 0.150 91.5 5.0 3.8 Feltrino 6157 0.0022 0.254 84.6 3.0 12.9 Moro 6286 0.0025 0.380 89.7 7.7 3.1 Piomba 6681 0.0025 0.151 86.0 12.9 1.5 Osento 7015 0.0021 0.138 88.6 10.3 1.6 Salinello 8280 0.0027 0.115 71.0 27.6 1.7
The first step of the data analysis was the linear Bivariate Regression in which the distribution of DL (dependent variable) with respect to MSI and D (independent variables) were separately examined for detecting their main trends. Both the bivariate distribution plot charts (Figures 2 and 3) showed the clustering of the data into three groups depending on the values of MSI and D:
− Group 1 (grey dots in the figures) included the basins with MSI < 3350 m and D
0.0031 m-1 (Giardino, Mazzocco,
Vallelunga, Borsacchio, Cerrano),
− Group 2 (black dots in the figures) included the basins with 3350 m < MSI < 6300 m and D 0.0031 m-1 (Buonanotte, Riccio, Lebba, Arielli, Acquachiara, Grande, Calvano, Feltrino, Moro),
− Group 3 (white dots in the figures) included the basins with MSI > 6300 m and D < 0.0031 m-1 (Piomba, Osento, Salinello). The partial relations for the three groups showed different type of interpolations. Although just few regressions showed significant R2 (> 0.6), all of them indicated the following specific trends:
− in the Group 1 DL increased with increasing MSI and decreasing D,
− in the Group 2 DL increased with increasing MSI and increasing D,
− in the Group 3 DL increased with decreasing MSI and decreasing D.
Figure 2. Regression between DL and MSI with distinction of
the three groups in different colors (grey for Group 1, black for Group 2, white for Group 3).
Figure 3. Regression between DL and D with distinction of
the three groups in different colors (grey for Group 1, black for Group 2, white for Group 3).
For detecting the combined effect of MSI and D on DL a Multiple Regression analysis was conducted. MSI and D was considered as independent variables, DL as dependent variable. This analysis was only conducted for the Group 1 and 2, because the 3rd was composed by 3 elements that are insufficient to enable significance results. The interpolation functions and relative statistical quality index (R2, Fisher-F and its significance p) were reported in Tab. 2. They revealed that the two groups’ data were interpolated by two different functions in which the partial relations are those previously described for the Bivariate Regression.
Table 2. Multiple Regression among DL, MSI and D for the
Groups 1 and 2.
Multiple Regression Equations R2 F p 1 DL = 0.49 + 0.00007 MSI - 140.07 D 0.93 13.6 0.068
The overall goodness-of-fit measures given by R2 indicated that 93% of Group 1 and 81% of Group 2 followed the Regression functions. The Fisher-F is significant only for Group 2 (F = 12.5, p < 0.05) while for Group 1 it is slightly lower than the significance level (F = 13.6, p = 0.068) probably due to the poor dataset.
3. Discussion and Conclusion
The aim of the present study was to detect the influence of slope, drainage, lithology and land use features on the distribution of landslides in some small Italian catchments. From the land-use point of view, the analyzed basins are very homogenous, therefore it was not possible to consider this parameter in the statistics as quantitative data. From the lithological point of view, the selected basins lies on the same lithology, and the Geological Maps currently available (at a scale of 1:50000) did not enable to do a detailed parametrization. The statistics was carried out on the morphometric parameters regarding the slope, the drainage and the distribution of landslides. The outcomes highlighted the importance of the interplay of slope morphometry (through MSI) and drainage network (through D) on landslides distribution (DL), allowing many considerations.
Firstly, the Bivariate Regression pointed out the individual role of each considered driver factors which is linked to the morphometric arrangement of the basin. In fact, MSI and D are linked each other and, depending on the combination of their values, the basin can be clustered in 3 groups with different behaviors: (1) within those having low MSI and high D (MSI < 3350 m and D 0.0031 m-1) DL increased with increasing MSI and decreasing D; (2) within those having high MSI and low D (3350 m < MSI < 6300 m and D 0.0031 m-1) DL increased with increasing MSI and increasing D; (3) within those having very high MSI and low D (MSI > 6300 m and D < 0.0031 m-1) DL increased with decreasing MSI and decreasing D. Secondly, the Multiple Regression confirmed this the interplay between D and MSI in determining DL, highlighting the different behaviors with different fitting equations for each group.
The link between D and MSI could be explained considering the local lithological features in the basins. Probably, in the basins with low MSI and high D, which had steep morphology (low L and high inclination), small surface (low A and Rc) and high drainage length, the outcropping lithology might be mainly conglomeratic and did not allow the enlargement of the catchment but allowed the incision of the streams; this could be the case of Group 1. In this case, the main geomorphological processes might be fluvial that tended to create well-defined drainage networks and stable interfluve slopes. Otherwise, in the basins with high MSI and low D, which had gentle morphology (high L and low inclination), wide surface (high A and Rc) and low drainage length, the outcropping lithology might be mainly clayey and allows the enlargement of the catchment in which the streams were ephemeral and little incised; this could be the case of Group 2. In this case, the main geomorphological processes might be the landslides that tended to occupy most of the basin area due to the lithology that tended to flow. The cases in which MSI was very high might correspond to wider basins that partially lied on marine substratum (mainly limestone or marl) in which generally D were lower, slopes were stable and less prone to landslides. This explanation was based on general consideration and on visual inspection of the Geological Maps at scale 1:50000, but needed further studies together with a detailed field survey.
The present study is exploratory and preliminary, but provides a good basis to work on for a complete characterization of the driver parameters of the landslides at catchment scale, aimed at assessing landslides hazard and risk. This study has reinforced our perspective about the validity of the application of the techniques of geomorphometric analysis to the landslides susceptibility, especially if we consider this approach as a means to summarize different controlling factors. Its strength lies in the fact that it is easy to model and simple to use by specialists and not and therefore could supply the institutions flexible logistic instruments for various terrain analyses and the prediction of natural disasters.
References
Bigi S., Cantalamessa G., Centamore E., Didaskalou P., Dramis F., Farabollini P., Gentili B., Invernizzi C., Micarelli A., Nisio S., Pambianchi G., Potetti M. (1995). La fascia periadriatica Marchigiano-Abruzzese dal Pliocene medio ai tempi attuali: evoluzione tettonico-sedimentaria e geomorfologia, Studi Geologici Camerti
Volume Speciale, 37–49.
Buccolini M., Coco L. (2013). MSI (morphometric slope index) for analyzing activation and evolution of calanchi in Italy, Geomorphology 191, 142–149. Buccolini M., Coco L., Cappadonia C., Rotigliano E. (2012).
Relationships between a new slope morphometric index and calanchi erosion in northern Sicily, Italy,
Geomorphology 149-150, 41–48.
Buccolini M., Gentili B., Materazzi M., Aringoli D., Pambianchi G., Piacentini T. (2007). Human impact and slope dynamics evolutionary trends in the monoclinal relief of Adriatic area of central Italy,
Catena 71, 96–109.
Cantalamessa G., Di Celma C. (2004). Sequence response to syndepositional regional uplift: insights from high-resolution sequence stratigraphy of the late Early Pleistocene strata, Periadriatic Basin, central Italy,
Sedimentary Geology 164, 283–309.
Carrara, A., Pike, R.J., 2008. GIS technology and models for assessing landslide hazard and risk. Geomorphology 94, 257–260.
Centamore E., Nisio S. (2003). The effects of uplift and tilting in the Central Apennines. Quaternary
International 101-102, 93-101.
Chen Z., Wang J. (2007). Landslide hazard mapping using logistic regression model in Mackenzie Valley, Canada.
Natural Hazards 42, 75–89.
Conforti M., Robustelli G., Muto F., Critelli S. (2011). Application and validation of bivariate GIS-based landslide susceptibility assessment for the Vitravo river catchment (Calabria, south Italy). Natural Hazards 61
(1), 127-141.
Crescenti U., Milia M.L., Rusciadelli G. (2004). Stratigraphic and tectonic evolution of the Pliocene Abruzzi basin (Central Apennines, Italy), Bollettino Società Geologica
Italiana 123, 163–174.
Dai F.C., Lee C.F. (2002). Landslide characteristics and slope instability modeling using GIS, Lantau Island, Hong Kong. Geomorphology 42, 213– 228.
Dai F.C., Lee C.F., Li J., Xu Z.W. (2001). Assessment of landslide susceptibility on the natural terrain of Lantau
Island, Hong Kong, Environmental Geology 40 (3), 381–391.
Domínguez-Cuesta M.J., Jiménez-Sánchez M., Berrezueta E. (2007). Landslides in the Central Coalfield (Cantabrian Mountains, NW Spain): Geomorphological features, conditioning factors and methodological implications in susceptibility assessment. Geomorphology 89, 358–369. Fazzini M., Giuffrida A. (2005). Une nouvelle proposition
quantitative des régimes pluviométriques dans le territoire de Italie: premiers résultats. Acts XVIII
Colloque Internationale de Climatologie, Climat Urbain, Ville et Architecture, pp. 361–365, Genova,
7-10 Settembre 2005.
Guzzetti F., Carrara A., Cardinali M., Reichenbach P. (1999). Landslide hazard evaluation: a review of current techniques and their application in a multi-scale study, Central Italy. Geomorphology 31, 181–216.
Guzzetti F., Reichenbach P., Cardinali M., Galli M., Ardizzone F. (2005). Probabilistic landslide hazard assessment at the basin scale. Geomorphology 72, 272– 299
Hovius N., Stark C.P., Tutton M.A., Abbott L.D. (1998). Landslide-driven drainage network evolution in a pre-steady-state mountain belt: Finisterre Mountains, Papua New Guinea. Geology 26 (12), 1071-1074.
Komac M. (2006). A landslide susceptibility model using the Analytical Hierarchy Process method and multivariate statistics in perialpine Slovenia. Geomorphology 74 (1–
4), 17–28.
Korup O. (2005). Distribution of landslides in southwest New Zealand, Landslides 2, 43–51.
Korup O., Densmore A.L., Schlunegger F. (2010). The role of landslides in mountain range evolution,
Geomorphology 120, 77–90.
Regmi N.R., Giardino J.R., Vitek J.D. (2010). Modeling susceptibility to landslides using the weight of evidence approach: Western Colorado, USA, Geomorphology
115, 172–187.
Rotigliano E., Cappadonia C., Conoscenti C., Costanzo D., Agnesi V., 2012. Slope units-based flow susceptibility model: using validation tests to select controlling factors. Natural Hazards 61 (1), 143-153.
Tarboton D.G. (1997). A new method for the determination of flow directions and upslope areas in grid digital elevation models, Water Resources Research 33 (2), 309–319.
Yalcin A. (2008). GIS-based landslide susceptibility mapping using analytical hierarchy process and bivariate statistics in Ardesen (Turkey): comparison of results and confirmations. Catena 2, 1–12.