https://doi.org/10.1177/1352458520943788 https://doi.org/10.1177/1352458520943788 MULTIPLE
SCLEROSIS MSJ JOURNAL
Multiple Sclerosis Journal
1 –14 DOI: 10.1177/ 1352458520943788 © The Author(s), 2020. Article reuse guidelines: sagepub.com/journals-permissions
Introduction
Prediction of an individual patient’s capacity for functional improvements is relevant for patient man-agement in multiple sclerosis (MS), as it allows per-sonalised recovery interventions, rationalisation of health resource allocation and improved stratifica-tion of patients in clinical trials.1 Currently, the
pre-diction of functional recovery in the individual case is based solely on clinical experience and thus remains largely variable and inaccurate.2
The individual’s potential for functional recovery results from the complex interaction of age, MS dam-age and disability, residual abilities and pre-morbid
reserve, all of which can be captured by clinical meas-ures and by magnetic resonance imaging (MRI) fea-tures.3 Indeed, characteristics such as age and disease
severity can play a role in disability development and worsening,4,5 as well as in determining individual
out-comes during recovery-oriented interventions.6–8
Brain damage and reserve, as assessed by MRI, can also influence the individual’s functional potential.3
In this study, we combined demographic with baseline clinical and MRI measures to identify predictors of functional recovery in patients with MS. We used upper limb performance improvements on a visuomotor task as a proxy for functional recovery.3,9 Firstly, in a cohort
Predictors of training-related improvement
in visuomotor performance in patients with
multiple sclerosis: A behavioural and MRI study
Ilona Lipp, Catherine Foster, Rachael Stickland, Eleonora Sgarlata,Emma C Tallantyre , Alison E Davidson, Neil P Robertson, Derek K Jones, Richard G Wise and Valentina Tomassini
Abstract
Background: The development of tailored recovery-oriented strategies in multiple sclerosis requires early identification of an individual’s potential for functional recovery.
Objective: To identify predictors of visuomotor performance improvements, a proxy of functional recov-ery, using a predictive statistical model that combines demographic, clinical and magnetic resonance imaging (MRI) data.
Methods: Right-handed multiple sclerosis patients underwent baseline disability assessment and MRI of the brain structure, function and vascular health. They subsequently undertook 4 weeks of right upper limb visuomotor practice. Changes in performance with practice were our outcome measure. We identi-fied predictors of improvement in a training set of patients using lasso regression; we calculated the best performing model in a validation set and applied this model to a test set.
Results: Patients improved their visuomotor performance with practice. Younger age, better visuomo-tor abilities, less severe disease burden and concurrent use of preventive treatments predicted improve-ments. Neuroimaging localised outcome-relevant sensory motor regions, the microstructure and activity of which correlated with performance improvements.
Conclusion: Initial characteristics, including age, disease duration, visuo-spatial abilities, hand dexterity, self-evaluated disease impact and the presence of disease-modifying treatments, can predict functional recovery in individual patients, potentially improving their clinical management and stratification in clini-cal trials. MRI is a correlate of outcome, potentially supporting individual prognosis.
Keywords: Multiple sclerosis, brain plasticity, predictors, functional recovery, MRI, cognition, disease-modifying treatment
Date received: 3 February 2020; revised: 29 June 2020; accepted: 30 June 2020.
Correspondence to:
V Tomassini
Institute for Advanced Biomedical Technologies (ITAB), Department of Neurosciences, Imaging and Clinical Sciences, University ‘G. d’Annunzio’ of Chieti-Pescara, Via Luigi Polacchi, 66100 Chieti, Italy.
valentina.tomassini@ unich.it
Ilona Lipp
Division of Psychological Medicine and Clinical Neurosciences, School of Medicine, Cardiff University, Cardiff, UK/ Cardiff University Brain Research Imaging Centre (CUBRIC), School of Psychology, Cardiff University, Cardiff, UK/ Department of Neurophysics, Max Planck Institute for Human Cognitive and Brain Sciences, Leipzig, Germany Catherine Foster Rachael Stickland Derek K Jones Cardiff University Brain Research Imaging Centre (CUBRIC), School of Psychology, Cardiff University, Cardiff, UK Eleonora Sgarlata Alison E Davidson Division of Psychological Medicine and Clinical Neurosciences, School of Medicine, Cardiff University, Cardiff, UK/Cardiff University Brain Research Imaging Centre (CUBRIC), School of Psychology, Cardiff University, Cardiff, UK Emma C Tallantyre Neil P Robertson Division of Psychological Medicine and Clinical Neurosciences, School of Medicine, Cardiff University, Cardiff, UK/ Helen Durham Centre for Neuroinflammation, University Hospital of Wales, Cardiff, UK
of MS patients, we employed exploratory statistical modelling by combining measures of initial disability with functional and structural neuroimaging metrics, acquired before 4 weeks of home practice of a stand-ardised upper limb visuomotor task.10 Secondly, using
this predictive model of functional recovery, we identi-fied predictors of individual performance improve-ments. Thirdly, we validated our predictive model and results in an independent patient cohort.
Methods
Patients and study design
We recruited right-handed MS patients11 aged 18–
60 years, with retained use of their right upper limb, no relapse or change in treatment for at least 3 months before study entry, and no other neurologi-cal or psychiatric conditions. Patients were recruited within the Helen Durham Centre for Neuroinflammation, University Hospital of Wales, Cardiff, UK. The study was approved by the NHS South-West Ethics Committee. All patients pro-vided written informed consent.
At baseline, we collected demographic and clinical measures (Table 1), as well as functional and struc-tural MRI (Table 2). Patients were instructed to prac-tise a visuomotor task at home and subsequently returned to be clinically assessed.
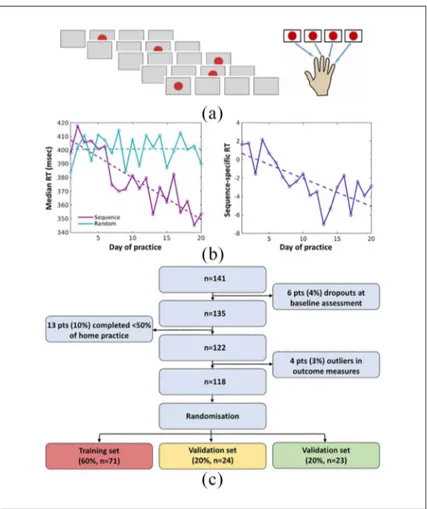
Visuomotor task and home practice
We used a serial reaction time (SRT) task to probe recovery experimentally at baseline, while undergo-ing a brain MRI scan, and subsequently at home, on a laptop, daily for 5 days/week, for 4 weeks, with each practice session lasting for about 15 minutes (see Figure 1(a) and Supplementary Material for details on the SRT task design and presentation). For the home practice, patients were asked to com-plete a practice log sheet on paper and weekly phone calls were made by the study team to ensure compli-ance. During the home practice, the SRT task was presented on a laptop, on which the patient’s responses were recorded to be used for the analysis of performance improvements.
During the SRT task, stimuli were presented in the ‘Sequence’, ‘Random’ or ‘Rest’ condition. For each block of the SRT task, the number (accuracy) and median latency (reaction time (RT)) of correct responses were calculated. For each day of practice, the accuracy and RT across blocks were calculated (Figure 1(b), left). As accuracy can rapidly reach a
plateau, we used RT to describe changing perfor-mance with home practice. Only patients who com-pleted at least 50% of the scheduled sessions (10 days) were included in the analysis.
For each participant and day of practice, we compared RT in Sequence versus Random blocks using an unpaired t test in order to generate a contrast measure that represented Sequence-specific performance changes. For each participant, a linear model was fit-ted using robustfit of MATLAB, with practice day as the independent variable and the Sequence-specific contrast measure as the dependent variable. We used the individual slope of practice-related Sequence-specific RT changes as our outcome measure of visu-omotor performance changes with home practice (Figure 1(b), right).
Demographic and clinical characteristics
Demographic and clinical characteristics are indi-cated in Table 1. Disease duration was defined as the time (in years) between the onset of the first symp-toms and the time of the study assessment. The date of disease onset was established from the patient’s clini-cal notes (whenever available) and confirmed during the study interview. Expanded Disability Status Scale (EDSS)12 and 29-item Multiple Sclerosis Impact
Scale (MSIS-29)13 assessed disability and disease
impact; Beck Depression Inventory (BDI),14 State
Trait Anxiety Inventory (STAI)15 scale and Modified
Fatigue Impact Scale (MFIS)16 quantified mood,
anx-iety and fatigue, respectively; nine-hole peg test (9-HPT)17 and timed 25-foot walk (T25-FW)17
char-acterised the limb function; Rao’s Brief Repeatable Battery18 probed cognition.
MRI acquisition and analysis
We acquired brain MRI scans on a 3-T MRI system (GE Medical Systems, Milwaukee, WI) using an eight-channel receive-only head radiofrequency (RF) coil. Detailed descriptions of the MRI protocols and analysis pipelines are shown in Figure 2 and Supplementary Material.
MRI measures that entered the predictive modelling were selected to capture as many aspects of MS dam-age as possible in a single scan session. We consid-ered lesional and non-lesional damage, functional responses and cerebral blood flow (CBF). For all MRI modalities, we extracted measures from predefined regions of interest (ROIs; ROI-based MRI measures); functional magnetic resonance imaging (fMRI) meas-ures were defined in task-relevant ROIs. For all MRI
Richard G Wise Cardiff University Brain Research Imaging Centre (CUBRIC), School of Psychology, Cardiff University, Cardiff, UK/ Institute for Advanced Biomedical Technologies (ITAB), Department of Neurosciences, Imaging and Clinical Sciences, University ‘G. d’Annunzio’ of Chieti-Pescara, Chieti, Italy Valentina Tomassini Division of Psychological Medicine and Clinical Neurosciences, School of Medicine, Cardiff University, Cardiff, UK/Cardiff University Brain Research Imaging Centre (CUBRIC), School of Psychology, Cardiff University, Cardiff, UK/Helen Durham Centre for Neuroinflammation, University Hospital of Wales, Cardiff, UK/ Institute for Advanced Biomedical Technologies (ITAB), Department of Neurosciences, Imaging and Clinical Sciences, University ‘G. d’Annunzio’ of Chieti-Pescara, Chieti, Italy
modalities, we also extracted measures from areas of significant correlations with home-practice outcome (outcome-relevant MRI measures; Table 2) for use in the models of prediction.
Predictive modelling
To predict performance improvements from base-line data, we employed a statistical learning approach that included a random assignment of the patients to three groups: a training set (60%) to establish statistical models, a validation set (20%)
to select the best performing model in independent data and a test set (20%) to evaluate the perfor-mance of the selected model. The three statistical sets underwent the same study procedures, includ-ing home practice.
Five groups of variables were established in the train-ing set: group A that included demographic and clini-cal variables; group B that included ROI-based MRI measures; group C that included demographic and clinical, as well as ROI-based MRI measures; group D that included outcome-relevant MRI measures; and
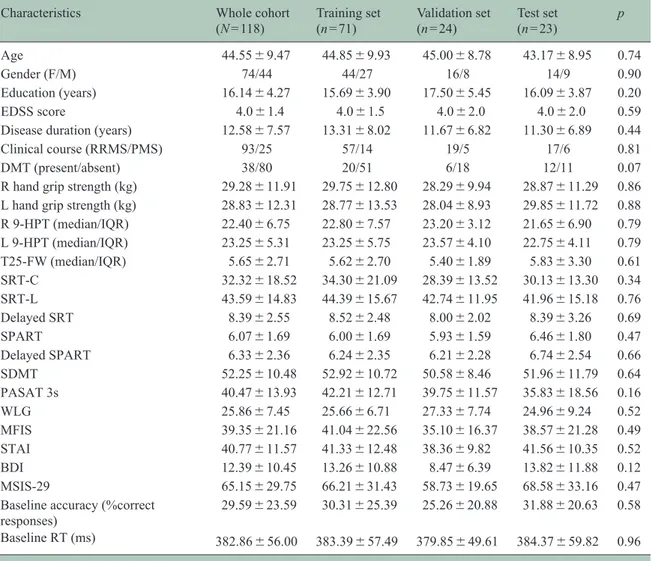
Table 1. Demographic and clinical characteristics for the whole cohort (N = 118), as well as for the three randomly assigned groups.
Characteristics Whole cohort
(N = 118) Training set (n = 71) Validation set (n = 24) Test set (n = 23) p Age 44.55 ± 9.47 44.85 ± 9.93 45.00 ± 8.78 43.17 ± 8.95 0.74 Gender (F/M) 74/44 44/27 16/8 14/9 0.90 Education (years) 16.14 ± 4.27 15.69 ± 3.90 17.50 ± 5.45 16.09 ± 3.87 0.20 EDSS score 4.0 ± 1.4 4.0 ± 1.5 4.0 ± 2.0 4.0 ± 2.0 0.59
Disease duration (years) 12.58 ± 7.57 13.31 ± 8.02 11.67 ± 6.82 11.30 ± 6.89 0.44
Clinical course (RRMS/PMS) 93/25 57/14 19/5 17/6 0.81
DMT (present/absent) 38/80 20/51 6/18 12/11 0.07
R hand grip strength (kg) 29.28 ± 11.91 29.75 ± 12.80 28.29 ± 9.94 28.87 ± 11.29 0.86
L hand grip strength (kg) 28.83 ± 12.31 28.77 ± 13.53 28.04 ± 8.93 29.85 ± 11.72 0.88
R 9-HPT (median/IQR) 22.40 ± 6.75 22.80 ± 7.57 23.20 ± 3.12 21.65 ± 6.90 0.79 L 9-HPT (median/IQR) 23.25 ± 5.31 23.25 ± 5.75 23.57 ± 4.10 22.75 ± 4.11 0.79 T25-FW (median/IQR) 5.65 ± 2.71 5.62 ± 2.70 5.40 ± 1.89 5.83 ± 3.30 0.61 SRT-C 32.32 ± 18.52 34.30 ± 21.09 28.39 ± 13.52 30.13 ± 13.30 0.34 SRT-L 43.59 ± 14.83 44.39 ± 15.67 42.74 ± 11.95 41.96 ± 15.18 0.76 Delayed SRT 8.39 ± 2.55 8.52 ± 2.48 8.00 ± 2.02 8.39 ± 3.26 0.69 SPART 6.07 ± 1.69 6.00 ± 1.69 5.93 ± 1.59 6.46 ± 1.80 0.47 Delayed SPART 6.33 ± 2.36 6.24 ± 2.35 6.21 ± 2.28 6.74 ± 2.54 0.66 SDMT 52.25 ± 10.48 52.92 ± 10.72 50.58 ± 8.46 51.96 ± 11.79 0.64 PASAT 3s 40.47 ± 13.93 42.21 ± 12.71 39.75 ± 11.57 35.83 ± 18.56 0.16 WLG 25.86 ± 7.45 25.66 ± 6.71 27.33 ± 7.74 24.96 ± 9.24 0.52 MFIS 39.35 ± 21.16 41.04 ± 22.56 35.10 ± 16.37 38.57 ± 21.28 0.49 STAI 40.77 ± 11.57 41.33 ± 12.48 38.36 ± 9.82 41.56 ± 10.35 0.52 BDI 12.39 ± 10.45 13.26 ± 10.88 8.47 ± 6.39 13.82 ± 11.88 0.12 MSIS-29 65.15 ± 29.75 66.21 ± 31.43 58.73 ± 19.65 68.58 ± 33.16 0.47
Baseline accuracy (%correct responses)
29.59 ± 23.59 30.31 ± 25.39 25.26 ± 20.88 31.88 ± 20.63 0.58
Baseline RT (ms) 382.86 ± 56.00 383.39 ± 57.49 379.85 ± 49.61 384.37 ± 59.82 0.96
EDSS: Extended Disability Status Scale; RRMS: relapsing-remitting multiple sclerosis; PMS: progressive multiple sclerosis; DMT: disease-modifying treatment; R: right; L: left; 9-HPT: nine-hole peg test; IQR: interquartile range; T25-FW: timed 25-foot walk; SRT-C: Selective Reminding Test Consistent Retrieval; SRT-L: Selective Reminding Test Long-Term Storage; SPART: Spatial Recall Test; SDMT: Symbol Digit Modalities Test; PASAT: Paced Auditory Serial Addition Test; WLG: Word List Generation; MFIS: Modified Fatigue Impact Scale; STAI: State Trait Anxiety Inventory; BDI: Beck Depression Inventory; MSIS-29: 29-item Multiple Sclerosis Impact Scale; RT: reaction time; ANOVA: analysis of variance.
Unless otherwise indicated, the provided descriptive statistics are means and standard deviations. For comparison between the three groups, chi-square tests were performed for categorical variables, Kruskal–Wallis tests for skewed variables (9-HPT, T25-FW) and one-way ANOVAs for the rest. p values for group differences are provided.
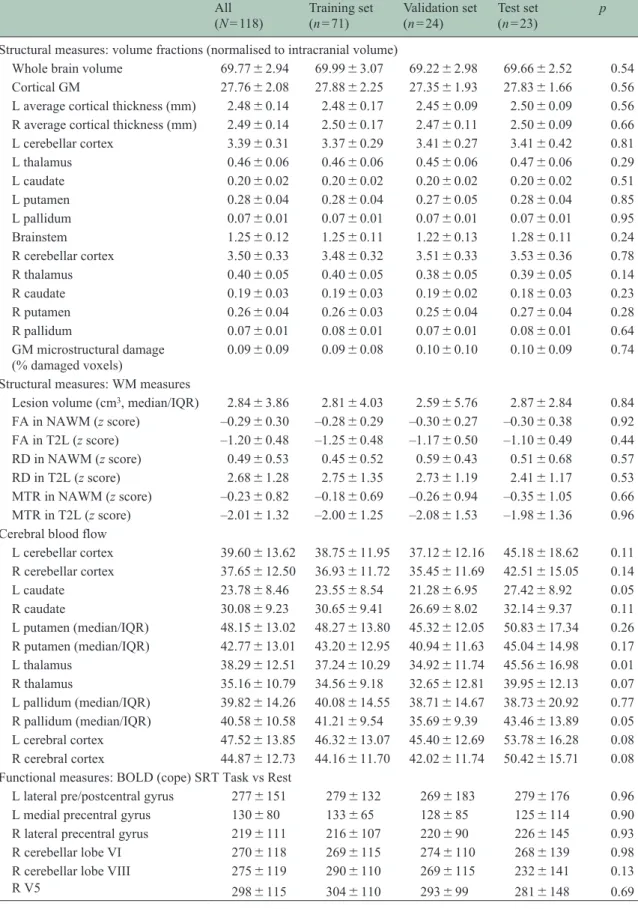
Table 2. MRI characteristics for the whole cohort (N = 118), as well as for the three randomly assigned groups. Measures of cortical thickness and percent (%) damaged voxels were not normalised to the intracranial volume.
All (N = 118) Training set (n = 71) Validation set (n = 24) Test set (n = 23) p
Structural measures: volume fractions (normalised to intracranial volume)
Whole brain volume 69.77 ± 2.94 69.99 ± 3.07 69.22 ± 2.98 69.66 ± 2.52 0.54
Cortical GM 27.76 ± 2.08 27.88 ± 2.25 27.35 ± 1.93 27.83 ± 1.66 0.56
L average cortical thickness (mm) 2.48 ± 0.14 2.48 ± 0.17 2.45 ± 0.09 2.50 ± 0.09 0.56
R average cortical thickness (mm) 2.49 ± 0.14 2.50 ± 0.17 2.47 ± 0.11 2.50 ± 0.09 0.66
L cerebellar cortex 3.39 ± 0.31 3.37 ± 0.29 3.41 ± 0.27 3.41 ± 0.42 0.81 L thalamus 0.46 ± 0.06 0.46 ± 0.06 0.45 ± 0.06 0.47 ± 0.06 0.29 L caudate 0.20 ± 0.02 0.20 ± 0.02 0.20 ± 0.02 0.20 ± 0.02 0.51 L putamen 0.28 ± 0.04 0.28 ± 0.04 0.27 ± 0.05 0.28 ± 0.04 0.85 L pallidum 0.07 ± 0.01 0.07 ± 0.01 0.07 ± 0.01 0.07 ± 0.01 0.95 Brainstem 1.25 ± 0.12 1.25 ± 0.11 1.22 ± 0.13 1.28 ± 0.11 0.24 R cerebellar cortex 3.50 ± 0.33 3.48 ± 0.32 3.51 ± 0.33 3.53 ± 0.36 0.78 R thalamus 0.40 ± 0.05 0.40 ± 0.05 0.38 ± 0.05 0.39 ± 0.05 0.14 R caudate 0.19 ± 0.03 0.19 ± 0.03 0.19 ± 0.02 0.18 ± 0.03 0.23 R putamen 0.26 ± 0.04 0.26 ± 0.03 0.25 ± 0.04 0.27 ± 0.04 0.28 R pallidum 0.07 ± 0.01 0.08 ± 0.01 0.07 ± 0.01 0.08 ± 0.01 0.64 GM microstructural damage (% damaged voxels) 0.09 ± 0.09 0.09 ± 0.08 0.10 ± 0.10 0.10 ± 0.09 0.74
Structural measures: WM measures
Lesion volume (cm3, median/IQR) 2.84 ± 3.86 2.81 ± 4.03 2.59 ± 5.76 2.87 ± 2.84 0.84
FA in NAWM (z score) –0.29 ± 0.30 –0.28 ± 0.29 –0.30 ± 0.27 –0.30 ± 0.38 0.92 FA in T2L (z score) –1.20 ± 0.48 –1.25 ± 0.48 –1.17 ± 0.50 –1.10 ± 0.49 0.44 RD in NAWM (z score) 0.49 ± 0.53 0.45 ± 0.52 0.59 ± 0.43 0.51 ± 0.68 0.57 RD in T2L (z score) 2.68 ± 1.28 2.75 ± 1.35 2.73 ± 1.19 2.41 ± 1.17 0.53 MTR in NAWM (z score) –0.23 ± 0.82 –0.18 ± 0.69 –0.26 ± 0.94 –0.35 ± 1.05 0.66 MTR in T2L (z score) –2.01 ± 1.32 –2.00 ± 1.25 –2.08 ± 1.53 –1.98 ± 1.36 0.96
Cerebral blood flow
L cerebellar cortex 39.60 ± 13.62 38.75 ± 11.95 37.12 ± 12.16 45.18 ± 18.62 0.11 R cerebellar cortex 37.65 ± 12.50 36.93 ± 11.72 35.45 ± 11.69 42.51 ± 15.05 0.14 L caudate 23.78 ± 8.46 23.55 ± 8.54 21.28 ± 6.95 27.42 ± 8.92 0.05 R caudate 30.08 ± 9.23 30.65 ± 9.41 26.69 ± 8.02 32.14 ± 9.37 0.11 L putamen (median/IQR) 48.15 ± 13.02 48.27 ± 13.80 45.32 ± 12.05 50.83 ± 17.34 0.26 R putamen (median/IQR) 42.77 ± 13.01 43.20 ± 12.95 40.94 ± 11.63 45.04 ± 14.98 0.17 L thalamus 38.29 ± 12.51 37.24 ± 10.29 34.92 ± 11.74 45.56 ± 16.98 0.01 R thalamus 35.16 ± 10.79 34.56 ± 9.18 32.65 ± 12.81 39.95 ± 12.13 0.07 L pallidum (median/IQR) 39.82 ± 14.26 40.08 ± 14.55 38.71 ± 14.67 38.73 ± 20.92 0.77 R pallidum (median/IQR) 40.58 ± 10.58 41.21 ± 9.54 35.69 ± 9.39 43.46 ± 13.89 0.05 L cerebral cortex 47.52 ± 13.85 46.32 ± 13.07 45.40 ± 12.69 53.78 ± 16.28 0.08 R cerebral cortex 44.87 ± 12.73 44.16 ± 11.70 42.02 ± 11.74 50.42 ± 15.71 0.08
Functional measures: BOLD (cope) SRT Task vs Rest
L lateral pre/postcentral gyrus 277 ± 151 279 ± 132 269 ± 183 279 ± 176 0.96
L medial precentral gyrus 130 ± 80 133 ± 65 128 ± 85 125 ± 114 0.90
R lateral precentral gyrus 219 ± 111 216 ± 107 220 ± 90 226 ± 145 0.93
R cerebellar lobe VI 270 ± 118 269 ± 115 274 ± 110 268 ± 139 0.98
R cerebellar lobe VIII 275 ± 119 290 ± 110 269 ± 115 232 ± 141 0.13
R V5 298 ± 115 304 ± 110 293 ± 99 281 ± 148 0.69
All (N = 118) Training set (n = 71) Validation set (n = 24) Test set (n = 23) p
Functional measures: BOLD (cope) Sequence-specific signal changes
Precuneus 3.86 ± 16.04 6.81 ± 15.27 –5.62 ± 16.47 4.68 ± 14.64 <0.001 R IPS –8.62 ± 21.99 –6.30 ± 19.36 –19.08 ± 31.79 –4.70 ± 12.43 0.03 R V1 –5.56 ± 21.25 –4.65 ± 21.19 –12.96 ± 24.06 –0.45 ± 16.49 0.12 Outcome-relevant measures FA 0.47 ± 0.03 0.47 ± 0.04 0.46 ± 0.03 0.47 ± 0.04 0.85 BOLD 128.16 ± 99.95 121.83 ± 92.72 123.49 ± 85.26 153.68 ± 133.14 0.42
MRI: magnetic resonance imaging; GM: grey matter; L: left; R: right; WM: white matter; IQR: interquartile range; FA: fractional anisotropy; NAWM: normal-appearing white matter; T2L: T2-hyperintense white matter lesions; RD: radial diffusivity; MTR: magnetisation transfer ratio; BOLD: blood oxygenation level dependent; cope: contrast parameter estimates (BOLD activation is presented in arbitrary units); SRT: serial reaction time; V1: area V1; V5: area V5; IPS: intraparietal sulcus.
Unless otherwise indicated, descriptive statistics provided are means and standard deviations. For comparison between the three groups, chi-square tests were performed for categorical variables, Kruskal–Wallis tests for skewed variables (i.e. lesion volume, CBF in the putamen and pallidum), and one-way ANOVA for the rest. p values for group differences are provided.
GM microstructural damage represents the proportion of GM with damaged voxels, whereby damage was assessed through a
voxel-wise comparison of the MTR to healthy control tissue. FA, RD and MTR measures are reported as z scores, derived from a voxel-wise comparison to healthy control tissue. Reductions or increases in sequence-specific activation changes are indicated by the sign of the measure. Outcome-relevant measures are functional measures derived from brain regions where correlations with outcome measures were found.
Table 2. (Continued)
group E that included demographic and clinical, as well as outcome-relevant MRI measures.
Data preparation
Prior to modelling, all variables were z-standardised using the mean and standard deviation (SD) from the training set. Missing values were mean-imputed. Patients with a home-practice outcome 1.5 interquar-tile ranges below the first quarinterquar-tile or above the third quartile of the distribution were excluded from mod-elling. Patients unable to complete T25-FW were assigned the value of the slowest patient who was able to complete the test. Variables with an absolute skew-ness > 2 were log transformed: the scores of 9-HPT and T25-FW, the measures of lesion volume and the CBF in the putamen and globus pallidus.
Statistical modelling
Lasso regression was used for the linear modelling in the training set (MATLAB (v R2015a) function: lasso). This method performs variable selection and parameter estimation simultaneously.19 Lasso
regres-sion overcomes the overfitting problems that are asso-ciated with traditional multiple linear regression analyses, by employing a regularisation of hyperpa-rameter lambda that penalises for the number of non-zero regression coefficients. Here, the optimal lambda was estimated by seven-fold cross-validation (repeated and averaged over five times) within the
training set, finding lambda that minimises the mean squared error (MSE) in the left-out folds. Correlations between predicted and actual outcomes were calcu-lated using Pearson correlation coefficients.
Lasso regression was applied to each of the five groups of variables in the training set for linear modelling (Figure 2), generating five linear regression models (models A–E), which consisted of a number of retained variables along with their parameter estimates (regres-sion coefficients). To obtain an index of the predicted home-practice outcome for each patient, we applied the regression coefficients of each of the five models to the baseline demographic, clinical and MRI data. Selection of the best performing regression model occurred by comparing the MSE across models in the validation set. The MSE quantifies how well the predicted home-prac-tice outcomes matched the measured home-prachome-prac-tice out-comes, with a low MSE indicating a small difference between predicted and measured outcomes. Therefore, the model with the lowest MSE was deemed the model best performing in the validation set and was tested for predictive performance in the test set by quantifying the amount of variance (R2) in the actual home-practice
out-come that could be explained by the predicted home-practice outcome.
Data availability statement
Anonymised data may be shared with qualified investigators.
Figure 1. Experimental task and participants. (a) The serial reaction time (SRT) task stimuli consisted of a red circle that could appear in one of four positions horizontally aligned on the computer screen. Participants had to react to the location of the circle by pressing a button with the corresponding finger as quickly as possible. (b) Example of one patient’s performance, measured as the reaction time (RT), in Sequence and Random conditions over 20 days of home practice (left). A contrast measure between Sequence and Random blocks was computed to capture the Sequence-specific aspect of performance improvements. The RT change over the training period was linearly modelled using the slope of this change as the home-practice outcome measure for that individual patient (right). (c) Out of 141 recruited patients, 118 successfully completed the study and entered the analysis. For the predictive modelling, patients were randomly assigned to one of three groups: training set, validation set and test set.
pts: patients.
Results
Baseline characteristics
Out of 141 recruited MS patients, 19 did not com-plete the study, including 6 who did not comply with baseline study procedures (e.g. claustrophobia in the scanner) and 13 patients who did not com-plete the home training programme (Figure 1(c)). Out of 122 patients who completed the study, four patients were identified as outliers in the home-practice outcome and thus not considered for the modelling purposes (Figure 1(c)). Figure S1 shows the distributions of the demographic and clinical characteristics for the whole cohort of patients. Table 1 summarises the characteristics of the whole cohort (N = 118), as well as of the three groups of
patients. There was no difference among the train-ing, validation and test sets in their baseline demo-graphic and clinical characteristics. Patients were on average in their mid-40s, mainly women and mildly to moderately disabled,20 as suggested by
measures of global disability, limb function, cogni-tion, anxiety, mood and fatigue. They had a wide range of disease duration, with many patients being untreated, but (as requested by the eligibility crite-ria) in a stable phase of their disease course.
Changes in behavioural measures with home practice
Patients completed 18.8 ± 2.2 days of home prac-tice (min = 11, max = 24). A two-way analysis of
variance (ANOVA) showed a significant interac-tion between time and condiinterac-tion, indicating stronger visuomotor performance improvements in the Sequence than in the Random for both RT (F(1, 117) = 115, p < 0.001) and accuracy (F(1, 117) = 82, p < 0.001). There were significant Sequence-specific RT improvements with practice in the whole cohort of patients (mean ± SD = –0.45 ± 0.33; t(117) = –15, p < 0.0001). The three groups did not differ in the mean ± SD Sequence-specific RT changes (training set: –0.41 ± 0.32; validation set: –0.52 ± 0.37; test set: –0.49 ± 0.30; p = 0.29). With practice, patients showed better performance in the 9-HPT and cognitive tests, as well as improved lev-els of mood and fatigue (Table 3). This improvement
did not correlate with the extent of home training– related improvements (Table 3).
Baseline MRI measures and their relationship with practice-related visuomotor improvements
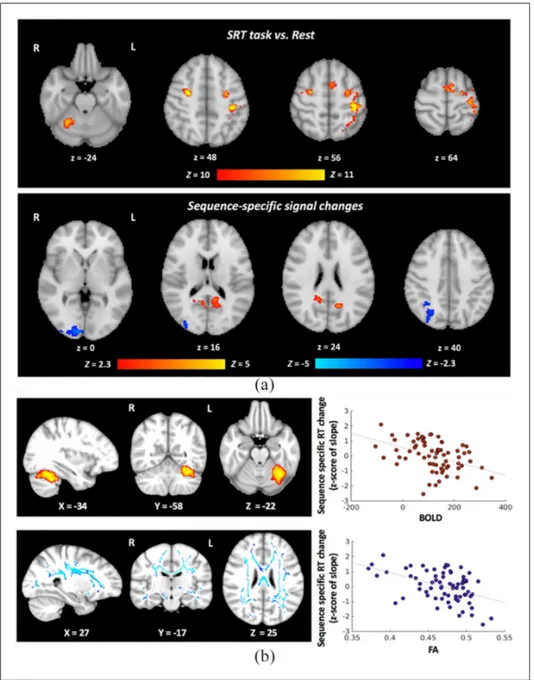
fMRI. In the training set, we identified SRT
task–rel-evant regions, that is, bilateral motor, premotor, visual and somatosensory cortices, as well as the right cere-bellum (Figure 3(a), top). Sequence-specific signal changes were observed in the posterior parietal and visual cortices (Figure 3(a), bottom).
When testing the relationship between functional responses in the SRT Task > Rest contrast and Sequence-specific RT changes, that is, the home
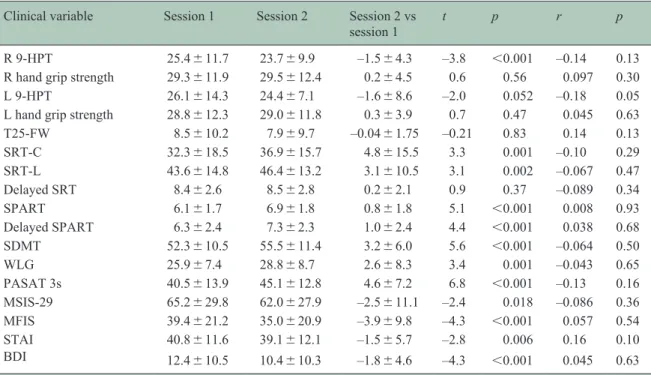
Figure 2. Overview of the analysis. All the demographic, clinical and MRI variables considered for the modelling are listed (left). For each type of the MRI variable, the acquisition sequence, the biological informativeness, the main processing steps and the extracted measures are indicated. ROI-based and outcome-relevant measures are indicated in blue and green boxes, respectively. Crossed boxes indicate non-significant results. The extracted measures that survived the statistical analysis were considered for the development of the predictive models. All variables were clustered in groups on the basis of their type (demographic and clinical, ROI-based MRI, outcome-relevant MRI) or combinations of types (right). First, within each group of variables (A–E), a lasso regression was performed in the training set, resulting in a number of retained variables and their corresponding regression coefficients. Second, these were applied to the validation set in order to quantify the modelling error (MSE). Third, the model with the lowest model error in the validation set (model A) was applied to the test
set to assess the relationship between the outcome predicted by the model built in the training set and the actual outcome as
measured in the test set. Crossed boxes indicate that the model did not survive the comparison of MSE.
T2-WI: T2-weighted image; T1-WI: T1-weighted image; GM: grey matter; MTI: magnetisation transfer imaging; DWI: diffusion-weighted imaging; BOLD: blood oxygenation level dependent; ASL: arterial spin labelling; DMT: disease-modifying treatment; MSE: mean squared error; WM: white matter; SRT: serial reaction time; RC: regression coefficient; ROI: region of interest.
training outcome, we found a significant correlation in the left cerebellar lobule VI (peak voxel coordi-nates in the MNI space: –36, –60, –24; cluster size: 722 voxels), where the BOLD signal change at base-line correlated with faster performance improvements (Figure 3(b), top). We did not find regions that showed the opposite relationship.
Structural MRI and resting perfusion MRI. In the
training set, there was no significant correlation between baseline MRI measures of grey matter (GM) integrity (GM volume and magnetisation transfer ratio (MTR)) or CBF and Sequence-specific RT changes. However, higher fractional anisotropy (FA) values in a wide range of white matter (WM) tracts, including the corticospinal tract, corpus callosum, and longitudinal fasciculi, correlated significantly with the home-practice outcome, that is, higher FA values were associated with faster improvements in RT with practice (Figure 3(b), bottom).
Table 3. Clinical measures and their changes over time.
Clinical variable Session 1 Session 2 Session 2 vs
session 1
t p r p
R 9-HPT 25.4 ± 11.7 23.7 ± 9.9 –1.5 ± 4.3 –3.8 <0.001 –0.14 0.13
R hand grip strength 29.3 ± 11.9 29.5 ± 12.4 0.2 ± 4.5 0.6 0.56 0.097 0.30
L 9-HPT 26.1 ± 14.3 24.4 ± 7.1 –1.6 ± 8.6 –2.0 0.052 –0.18 0.05
L hand grip strength 28.8 ± 12.3 29.0 ± 11.8 0.3 ± 3.9 0.7 0.47 0.045 0.63
T25-FW 8.5 ± 10.2 7.9 ± 9.7 –0.04 ± 1.75 –0.21 0.83 0.14 0.13 SRT-C 32.3 ± 18.5 36.9 ± 15.7 4.8 ± 15.5 3.3 0.001 –0.10 0.29 SRT-L 43.6 ± 14.8 46.4 ± 13.2 3.1 ± 10.5 3.1 0.002 –0.067 0.47 Delayed SRT 8.4 ± 2.6 8.5 ± 2.8 0.2 ± 2.1 0.9 0.37 –0.089 0.34 SPART 6.1 ± 1.7 6.9 ± 1.8 0.8 ± 1.8 5.1 <0.001 0.008 0.93 Delayed SPART 6.3 ± 2.4 7.3 ± 2.3 1.0 ± 2.4 4.4 <0.001 0.038 0.68 SDMT 52.3 ± 10.5 55.5 ± 11.4 3.2 ± 6.0 5.6 <0.001 –0.064 0.50 WLG 25.9 ± 7.4 28.8 ± 8.7 2.6 ± 8.3 3.4 0.001 –0.043 0.65 PASAT 3s 40.5 ± 13.9 45.1 ± 12.8 4.6 ± 7.2 6.8 <0.001 –0.13 0.16 MSIS-29 65.2 ± 29.8 62.0 ± 27.9 –2.5 ± 11.1 –2.4 0.018 –0.086 0.36 MFIS 39.4 ± 21.2 35.0 ± 20.9 –3.9 ± 9.8 –4.3 <0.001 0.057 0.54 STAI 40.8 ± 11.6 39.1 ± 12.1 –1.5 ± 5.7 –2.8 0.006 0.16 0.10 BDI 12.4 ± 10.5 10.4 ± 10.3 –1.8 ± 4.6 –4.3 <0.001 0.045 0.63
R: right; 9-HPT: nine-hole peg test; L: left; T25-FW: timed 25-foot walk; SRT-C: Selective Reminding Test Consistent Retrieval; SRT-L: Selective Reminding Test Long-term Storage; SPART: Spatial Recall Test; SDMT: Symbol Digit Modalities Test; WLG: Word List Generation; PASAT: Paced Auditory Serial Addition Test; MSIS-29: 29-item Multiple Sclerosis Impact Scale; MFIS: Modified Fatigue Impact Scale; STAI: State Trait Anxiety Inventory; BDI: Beck Depression Inventory.
For each clinical variable, the group mean ± standard deviation values across 118 patients are provided separately for sessions 1 and 2, as well as for the difference between the two sessions. In order to test whether, across the whole group, there was a significant longitudinal change in behavioural measures, we performed a paired t test. To test whether the home-practice outcome correlated directly with changes in visuomotor performance, we correlated individual changes between sessions in each measure reported below with the home-practice outcome. r and p values are indicated in the table.
Predictors of performance improvements with home practice
Variable selection and parameter estimation (training
set). Tables 1 and 2 list the clinical and MRI variables
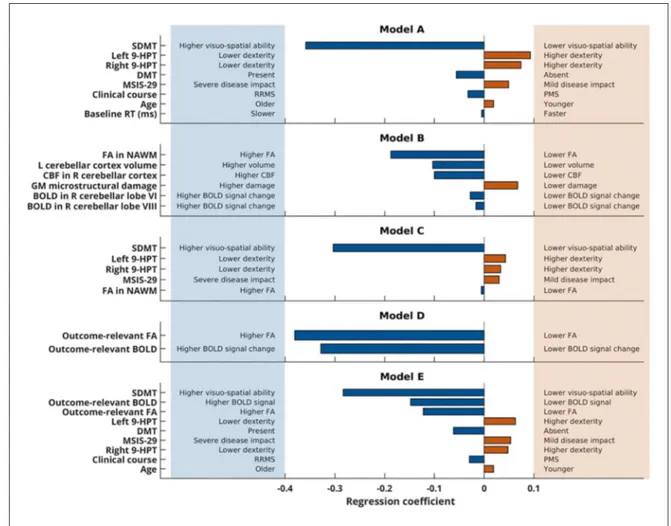
that were considered in the five modelling approaches for the predictive analysis. In each resulting model, between 3 and 13 variables were retained and contrib-uted to the model to varying extents (Figure 4).
Model selection (validation set). For each model, we
calculated the model error (MSE). The lowest model error in the validation set was found in model A (model A: 1.16, model B: 1.33, model C: 1.28, model D: 1.63, and model E: 1.23).
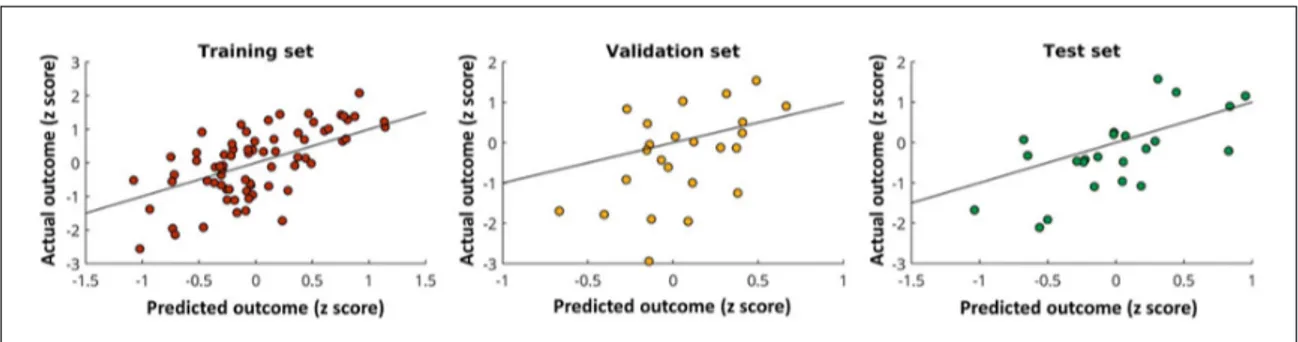
Model evaluation (test set). Model A was applied to
the independent test set. The home-practice outcome predicted by model A significantly correlated with the actual outcome (r(21) = 0.66, p < 0.0001; Figure 5) and could explain 44% of the variance.
Figure 3. Group-level results of the SRT task-related functional MRI and functional and structural brain regions relevant for visuomotor performance improvements with home practice. (a) For the contrast SRT Task versus Rest, we identified task-relevant clusters in sensory motor and premotor cortices, in the right cerebellum and the visual cortex. Six clusters were retained as task-relevant regions of interest for the modelling approaches B and C: (1) left lateral pre- and postcentral gyrus (peak coordinates in the MNI space: –38, –32, 54; cluster size: 887 voxels); (2) left medial precentral gyrus (peak coordinates: –10, 2, 63; cluster size: 236 voxels); (3) right lateral precentral gyrus (peak coordinates: 28, –6, 46; cluster size: 195 voxels); (4) right cerebellar lobule VI (peak coordinates: 28, –52, –26; cluster size: 195 voxels); (5) right cerebellar lobule VIII (peak coordinates: 14, –62, –48; cluster size: 42 voxels); and (6) right visual cortex V5 (peak coordinates: 44, –68, 4; cluster size: 40 voxels). For the Sequence-specific contrast, signal changes were observed in three clusters: (1) activation increases in the right precuneus (peak coordinates: 8, –54, 14; cluster size: 541 voxels); (2) activation decreases in the right visual cortex V1 (peak coordinates: 10, –94, –2; cluster size: 627 voxels); and (3) activation decreases in the right intra-parietal sulcus (peak coordinates: 32, –52, 36; cluster size: 366 voxels). These three clusters were retained as task-relevant regions of interest for the modelling analysis approaches B and C. In blue we indicate regions with a reduction of the BOLD signal; in red colour, we indicate regions with an increase in the BOLD signal. (b) Localised correlations between the home-practice outcome and the baseline functional activity (the BOLD signal change in contrast Task vs Rest, top) and the baseline white matter microstructure (FA, bottom). Correlations were localised with group-level analyses using the training set (n = 71) only. Scatter plots show the relationship between the MRI measures in those regions and home-practice outcomes (z-standardised) in the training set.
Based on these model parameters (regression coeffi-cients in Figure 4), the variables in model A predicted individual improvements with practice in upper limb performance according to the relationship
predicted outcome
(
zscore)
Y = Xβwhere X is a row vector of predictor values and β is a column vector of their respective beta coefficients (Table 4).
Discussion
By combining baseline demographic, clinical and neuro-imaging data, this study identified predictors of visuo-motor performance improvements with training in
individual MS patients. The strongest predictors were age, clinical characteristics such as disease duration, visuo-spatial abilities, upper limb dexterity and self-evaluated disease impact, and the presence of disease-modifying treatment (DMT). MRI metrics did not predict the training outcome over and above these meas-ures, but variation in brain activity and WM microstruc-ture in regions relevant to the practised task explained individual differences in the training outcome.
Visuomotor training to probe upper limb functional recovery
A 4-week standardised visuomotor training inter-vention probed brain plasticity underlying func-tional recovery. Compliance was high, with a
Figure 4. Predictive models. Predictors that were retained in the models and their respective contribution (regression coefficient) are shown on the y- and on the x-axis, respectively. The signs of the regression coefficient depend on the scaling of the predictor variable and the home-practice outcome (the negative slope reflects faster decreases in the reaction time). The lowest model error (MSE) in the validation set was found in model A, which was then evaluated in the test set. SDMT: Symbol Digit Modalities Test; 9-HPT: nine-hole peg test; DMT: disease-modifying treatment; MSIS-29: 29-item Multiple Sclerosis Impact Scale; RRMS: Relapsing-remitting MS; PMS: progressive (both primary and secondary) multiple sclerosis; RT: reaction time; FA: fractional anisotropy; NAWM: normal-appearing white matter; CBF: cerebral blood flow; GM: grey matter; BOLD: blood oxygenation level dependent (signal change).
dropout rate of less than 20%. Patients varied in the number of trained days, but this did not affect the outcome measure.
Interventional studies rely on the patient’s compliance with the intervention procedures. We monitored com-pliance by recording the log file of each session of intervention and by asking the patients to complete a diary to record specific deviations from the daily pro-tocol or factors affecting the practice. We mitigated the effect of variability in task execution by defining an outcome measure that is independent of the total number of practice sessions completed.
While, as a group, patients significantly improved performance with practice, the training outcome var-ied considerably between patients, reflecting the het-erogeneity in functional recovery and rehabilitation outcomes observed in the real-life setting. The distri-bution of performance improvements (Figure 5) sug-gested a continuum rather than distinct groups of
responders versus non-responders. Therefore, our modelling predicted the extent of performance improvement, without attempting an arbitrary classi-fication of patients into groups.
Our contrast-derived training outcome, that is, slope of Sequence-specific RT changes, allowed us to limit the confounding effect of attention, fatigue or motivation on performance, thus capturing more sta-ble changes in visuomotor performance.21 Although
our intervention was not individually tailored, as it would be in clinical rehabilitation, it facilitated the generalisability and interpretability of the results by allowing all patients to experience the same, con-trolled training conditions. Indeed, the biological processes underlying clinically induced or experi-mentally driven improvements in performance largely overlap. First, rehabilitation leads to func-tional recovery that, in most cases, is sub-served by brain changes similar to those occurring with skill learning.9 Second, Sequence-specific improvements
Figure 5. Model evaluation. Scatter plots showing the relationship between the predicted (from the model) home-practice outcome and the actual outcome in the training (left), validation (middle) and test (right) sets. The black line is the line of equality and indicates where the data points would lie in the case when the MSE is equal to 0.
Table 4. Calculation of the predicted outcome with model A.
β1 = –0.360 X1 = ((score in SDMT – 52.9)/10.7) β2 = +0.093 X2 = ((log[time in left 9-HPT (s)) – 3.22)/0.321] β3 = +0.074 X3 = ((log[time in right 9-HPT (s)) – 3.20)/0.316] β4 = –0.056 X4 = ((DMTa – 0.282)/0.453) β5 = +0.049 X5 = ((score in MSIS-29 – 66.2)/31.4) β6 = –0.032 X6 = ((disease courseb – 0.803)/0.401) β7 = +0.019 X7 = ((age – 44.8)/9.93) β8 = –0.005 X8 = ((RT in SRT task (ms) – 383)/57.5)
SDMT: Symbol Digit Modalities Test; 9-HPT: nine-hole peg test; DMT: disease-modifying treatment; MSIS-29: 29-item Multiple Sclerosis Impact Scale; RT: reaction time; SRT: serial reaction time; RRMS: relapsing-remitting multiple sclerosis; MS: multiple sclerosis.
The regression coefficient for each predictor is provided, along with the required equation for calculating each predictor via z standardisation.
a1 if on DMT and 0 if not on DMT. b1 if RRMS and 0 if progressive MS.
with training, closely reflecting task-oriented prac-tice in rehabilitation, rely on systems involved in visuomotor integration and learning of movement sequences, functions that are relevant in rehabilita-tion.3 Although this study was not designed to test
explicitly a generalisation of the effect of our inter-vention on routinely used clinical measures, changes in hand dexterity that accompanied performance improvements with practice suggest a possible, although small, clinical benefit of our experimental intervention.
Predictors of performance improvements
We used a statistical learning approach to identify predictors of visuomotor performance improvements, as a conventional linear regression could lead to over-fitting, that is, the resulting model could work well for the data that were used to establish the model, but not for independent data.
Within the most successful predictive model (model A), the strongest predictor was the performance of Symbol Digit Modalities Test (SDMT), a measure of visuo-spa-tial skills and speed of processing that is considered to be a powerful tool to assess cognition in MS.22 Patients
with higher SDMT performance showed faster visuo-motor performance improvements with practice, extending the relevance of cognitive reserve from nor-mal motor learning23 to functional recovery.
Higher levels of hand dexterity predicted performance improvements, with scores of both hands contributing independently to the model. Although right-hand dex-terity is directly relevant to the execution of the study intervention, left-hand dexterity in MS may also reflect the function of the left motor regions, thus con-tributing to explain the independent predictive role of the left upper limb function in performance improve-ments of the right upper limb.24
Our results also suggest that younger age, higher pre-morbid reserve, lower disease burden, as assessed for-mally and by self-report, and modulation of inflammation predict patients who will improve per-formance with practice. Since our intervention relies on brain plasticity, these factors can also act as deter-minants of the intervention success, as they can be associated with building,25 maintaining26 and
exploit-ing27 plastic reserve in the patients. By contrast,
path-ological MS changes, from brain atrophy to vascular abnormalities, can contribute to reduce plastic reserve in patients with higher disease burden, adding to the effect of age on brain health.5,28
MRI correlates of performance improvements
Performance improvements with training corre-lated significantly with baseline group-level struc-tural and fMRI measures. Higher FA in the longitudinal fasciculi, corticospinal tracts and corpus callosum was significantly associated with better home training outcome. These regions are important for visuomotor integration, inter-hemispheric com-munication and motor execution, functions all rele-vant to our visuomotor task.29 These effects were
widespread across white matter, suggesting that, along with the integrity of specific regions, the overall microstructural health, that provides the substrate for local and long-range connectivity and that is disrupted by MS damage,30,31 is beneficial to
support full recovery.
Patients with stronger cerebellar activation, as meas-ured by BOLD fMRI during the SRT task, showed greater improvements with practice. A localised brain–behaviour relationship was found in cerebellar lobule VI, which is functionally connected with the contralateral higher motor control regions.32 While
the relationship between training outcomes and base-line SRT–related signal changes in the cerebellum may result from a simple modification of perfor-mance,33 it could also suggest that stronger or more
intact error processing function leads to better train-ing outcomes.34
At least within the range of damage and length of training studied here, brain MRI data did not predict the outcome over and above demographic and clini-cal data, confirming the difficulty in translating directly results from MRI group-level analyses to the individual patient and clinical practice, and high-lighting the importance of developing novel biologi-cally informative MRI-based metrics to increase the potential of neuroimaging for single-subject predic-tion.35 Some aspects of damage in our population,
for example, those revealed by other MRI methods (e.g., MR spectroscopy) or within other anatomical sites (e.g., the spinal cord and optic nerve), may not have been fully captured. However, we aimed for a comprehensive, yet feasible baseline characterisa-tion of the brain funccharacterisa-tion and structure in a single MRI session, and selected MRI methods and meas-urements, whose biological informativeness for MS damage, repair and systems-level plasticity is well established.3 While we aimed to predict performance
improvements from a single baseline assessment, it is possible that the analysis of longitudinal clinical and MRI data could identify MRI predictors of func-tional recovery.
Conclusion
A comprehensive formal, as well as self-reported, baseline clinical assessment offers a reliable indica-tion of the likely extent of recovery of the visuomo-tor function in individual MS patients, at least within the range of disabilities, times and activities studied here. Residual abilities are retained functions, sub-served by the individual functional reserve, that is, the remaining capacity of the brain to cope with an increased behavioural demand.36 Our results
high-light the importance of extending the routine clinical assessment of current disability to include measures of residual abilities relevant for recovery. Prediction of functional recovery in individual patients can pro-vide valuable information at an early stage regarding the likelihood of response to standard rehabilitation interventions, as well as the stratification of patients for recovery-oriented clinical trials. The identifica-tion of structural and funcidentifica-tional imaging correlates of performance improvements in a large cohort of patients provides a strong rationale for further, more targeted exploration of neuroimaging predictors of recovery.
Acknowledgements
The authors are grateful to Mr Lukas Lipp and Mr Moritz Lipp for the implementation of the home-practice software and IT support; to Dr Jilu Mole, Peter Hobden and Martin Stuart, Cardiff University, UK, for technical support with MRI data acquisition; to Dr Bonni Crawford, Cardiff University, UK, for advice with structural data analysis; and to Prof Maria Pia Sormani, University of Genoa, Italy, for assistance with the study design and power analysis. They also wish to thank the MS patients and their carers for their participation in the study.
Declaration of Conflicting Interests
The author(s) declared no potential conflicts of inter-est with respect to the research, authorship and/or publication of this article.
Funding
The author(s) disclosed receipt of the following financial support for the research, authorship and/or publication of this article: The study was funded by the MS Society UK. C.F., R.S. and D.K.J. were funded by the Wellcome Trust and A.E.D. by the Medical Research Council UK. The funding source had no role in the study design, in the collection, analysis and interpretation of data, in the writing of the manuscript or in the decision to submit the paper for publication.
ORCID iDs
Emma C Tallantyre https://orcid.org/0000-0002 -3760-6634
Valentina Tomassini https://orcid.org/0000-0002 -7368-6280
Supplemental Material
Supplemental material for this article is available online.
References
1. Thompson AJ. Neurorehabilitation in multiple sclerosis: Foundations, facts and fiction. Curr Opin
Neurol 2005; 18(3): 267–271.
2. Lipp I and Tomassini V. Neuroplasticity and motor rehabilitation in multiple sclerosis. Front Neurol 2015; 6: 59.
3. Tomassini V, Matthews PM, Thompson AJ, et al. Neuroplasticity and functional recovery in multiple sclerosis. Nat Rev Neurol 2012; 8: 635–646. 4. Langer-Gould A, Popat RA, Huang SM, et al.
Clinical and demographic predictors of long-term disability in patients with relapsing-remitting multiple sclerosis: A systematic review. Arch Neurol 2006; 63(12): 1686–1691.
5. Tomassini V, Fanelli F, Prosperini L, et al. Predicting the profile of increasing disability in multiple sclerosis. Mult Scler 2019; 25: 1306–1315. 6. Grasso MG, Troisi E, Rizzi F, et al. Prognostic
factors in multidisciplinary rehabilitation treatment in multiple sclerosis: An outcome study. Mult Scler 2005; 11(6): 719–724.
7. Kehoe M, Saunders J, Jakeman P, et al. Predictors of the physical impact of multiple sclerosis following community-based, exercise trial. Mult Scler 2015; 21(5): 590–598.
8. Langdon DW and Thompson AJ. Multiple sclerosis: A preliminary study of selected variables affecting rehabilitation outcome. Mult Scler 1999; 5(2): 94–100. 9. Matthews PM, Johansen-Berg H and Reddy H.
Non-invasive mapping of brain functions and brain recovery: Applying lessons from cognitive neuroscience to neurorehabilitation. Restor Neurol
Neurosci 2004; 22(3–5): 245–260.
10. Tomassini V, Johansen-Berg H, Jbabdi S, et al. Relating brain damage to brain plasticity in patients with multiple sclerosis. Neurorehabil Neural Repair 2012; 26(6): 581–593.
11. Polman CH, Reingold SC, Banwell B, et al. Diagnostic criteria for multiple sclerosis: 2010
revisions to the McDonald criteria. Ann Neurol 2011; 69(2): 292–302.
12. Kurtzke JF. Rating neurologic impairment in multiple sclerosis: An Expanded Disability Status Scale (EDSS). Neurology 1983; 33(11): 1444–1452. 13. Hobart J, Lamping D, Fitzpatrick R, et al. The
Multiple Sclerosis Impact Scale (MSIS-29): A new patient-based outcome measure. Brain 2001; 124(Pt 5): 962–973.
14. Beck AT, Ward CH, Mendelson M, et al. Inventory for measuring depression. Arch Gen Psychiatry 1961; 4: 561–571.
15. Spielberger C, Gursuch R and Lushene R. State Trait
Anxiety Inventory manual. Palo Alto, CA: Consulting
Psychologist Press, 1970.
16. Fisk JD, Ritvo PG, Ross L, et al. Measuring the functional impact of fatigue: Initial validation of the fatigue impact scale. Clin Infect Dis 1994; 18(Suppl. 1): S79–S83.
17. Cutter GR, Baier ML, Rudick RA, et al. Development of a multiple sclerosis functional composite as a clinical trial outcome measure. Brain 1999; 122(Pt 5): 871–882.
18. Rao SM. A manual for the brief, repeatable battery
of neuropsychological tests in multiple sclerosis.
Milwaukee, WI: Medical College of Wisconsin, 1990. 19. Tibshirani R. Regression shrinkage and selection via
the lasso. J R Stat Soc B 1996; 58: 267–288.
20. Goldman MD, Motl RW, Scagnelli J, et al. Clinically meaningful performance benchmarks in MS: Timed 25-foot walk and the real world. Neurology 2013; 81: 1856–1863.
21. Robertson EM. The serial reaction time task: Implicit motor skill learning? J Neurosci 2007; 27: 10073–10075. 22. Parmenter BA, Weinstock-Guttman B, Garg N,
et al. Screening for cognitive impairment in multiple sclerosis using the Symbol Digit Modalities Test.
Mult Scler 2007; 13(1): 52–57.
23. Lingo VanGilder J, Hengge CR, Duff K, et al. Visuospatial function predicts one-week motor skill retention in cognitively intact older adults. Neurosci
Lett 2018; 664: 139–143.
24. Koch G, Rossi S, Prosperetti C, et al. Improvement of hand dexterity following motor cortex rTMS in multiple sclerosis patients with cerebellar impairment.
Mult Scler 2008; 14(7): 995–998.
25. Sumowski JF. Cognitive reserve as a useful concept for early intervention research in multiple sclerosis.
Front Neurol 2015; 6: 176.
26. Tomassini V, d’Ambrosio A, Petsas N, et al. The effect of inflammation and its reduction on brain plasticity in multiple sclerosis: MRI evidence. Hum
Brain Mapp 2016; 37(7): 2431–2445.
27. Tomassini V, Johansen-Berg H, Leonardi L, et al. Preservation of motor skill learning in patients with multiple sclerosis. Mult Scler 2011; 17(1): 103–115.
28. Haider L, Zrzavy T, Hametner S, et al. The topography of demyelination and neurodegeneration in the multiple sclerosis brain. Brain 2016; 139(Pt 3): 807–815.
29. Vanderah TW and Gould DJ. Nolte’s the human
brain: An introduction to its functional anatomy. 7th
ed. Philadelphia, PA: Elsevier.
30. He Y, Dagher A, Chen Z, et al. Impaired small-world efficiency in structural cortical networks in multiple sclerosis associated with white matter lesion load.
Brain 2009; 132(Pt 12): 3366–3379.
31. Shu N, Liu Y, Li K, et al. Diffusion tensor tractography reveals disrupted topological efficiency in white matter structural networks in multiple sclerosis. Cereb Cortex 2011; 21(11): 2565–2577.
32. O'Reilly JX, Beckmann CF, Tomassini V, et al. Distinct and overlapping functional zones in the cerebellum defined by resting state functional connectivity. Cereb Cortex 2010; 20(4): 953–965. 33. Seidler RD, Purushotham A, Kim SG, et al.
Cerebellum activation associated with performance change but not motor learning. Science 2002; 296: 2043–2046.
34. Tomassini V, Jbabdi S, Kincses ZT, et al. Structural and functional bases for individual differences in motor learning. Hum Brain Mapp 2011; 32(3): 494–508.
35. Arbabshirani MR, Plis S, Sui J, et al. Single subject prediction of brain disorders in neuroimaging: Promises and pitfalls. NeuroImage 2017; 145: 137–165.
36. Rocca MA, Amato MP, De Stefano N, et al. Clinical and imaging assessment of cognitive dysfunction in multiple sclerosis. Lancet Neurol 2015; 14(3): 302–317.
Visit SAGE journals online journals.sagepub.com/ home/msj