Alma Mater Studiorum · University of Bologna
Department of Computer Science and Engineering - DISI Two year Master degree in Computer Engineering
Interaction and Behaviour Evaluation for Smart
Homes: Data Collection and Analytics in the
ScaledHome Project
Master thesis in Mobile Systems M
Supervisor:
Prof. Paolo Bellavista
Correlator:
Prof. Damla Turgut
Author:
Matteo Mendula
Session VI
Contents
1 ScaledHome 7
1.1 IoT . . . 7
1.2 The Smart home scenario . . . 8
1.3 HAN: Home Area Network . . . 9
1.4 Energy consumption due to air condition and space heating . . . 10
1.5 The Smart Grid . . . 11
1.6 A formal representation of the goal . . . 13
1.7 Different types of data sources . . . 14
1.8 Related work . . . 15
1.9 The reason behind ScaledHome . . . 17
1.10 Interpreting ScaledHome experiments: the scaling problem . . . 18
1.11 ScaledHome: a physical scale model of a suburban home . . . 19
2 Software architecture principles 20 2.1 SOA paradigm . . . 22
2.2 Continuous Integration (CI) and Continuous Deployment (CD) . . . 23
2.3 DevOps . . . 23 2.3.1 Docker . . . 23 2.3.2 Kubernetes . . . 25 2.3.3 Micro-services architecture . . . 25 2.4 Middleware . . . 27 2.4.1 Definition . . . 27 2.4.2 Advantages . . . 27 2.4.3 Disadvantages . . . 27
2.5 Entities interaction patterns . . . 28
2.5.1 REST . . . 28
2.5.2 Publish Subscribe (MQTT) . . . 29
2.5.3 MQTT QoS . . . 30
2.6 MVC pattern . . . 32
2.7 Relation and Non-Relational Databases . . . 33
3 Data mining and Machine Learning principles 34 3.1 Data preprocessing in Data Mining . . . 34
3.1.1 Steps Involved in Data Preprocessing: . . . 34
3.1.2 Regression . . . 36
3.1.3 Interpolation vs Extrapolation . . . 36
3.1.4 Different types of distances . . . 37
3.1.5 From Data Mining to Machine Learning . . . 38
3.2 Artificial intelligence . . . 39
3.2.1 Tree search algorithms . . . 39
3.3 Machine Learning . . . 40
3.4 Parametric and non parametric machine learning algorithms . . . 41
3.5 Supervised and Unsupervised Learning . . . 41
3.6 Reinforcement learning . . . 42
3.10 Gradient descent . . . 46
3.10.1 Mini-batching . . . 48
4 Implementation of the ScaledHome system 50 4.1 Actuators and Sensors controllers . . . 51
4.1.1 Actuators Controller . . . 51
4.1.2 Sensors Controller . . . 52
4.2 Controllers interaction . . . 53
4.3 ScaledHome architecture . . . 54
4.3.1 Requirements analysis . . . 54
4.3.2 Two different options . . . 54
4.3.3 Options comparison . . . 56
4.4 ScaledHome middleware implementation . . . 57
4.4.1 NodeJS . . . 57
4.4.2 Interaction with the MQTT broker . . . 57
4.4.3 Web Interface . . . 58
4.4.4 WebSocket . . . 59
4.4.5 RestFul API . . . 59
4.4.6 Home Controller model . . . 61
4.5 Home Controller CD and CI . . . 65
4.6 Docker containerization of the Home Controller . . . 67
4.6.1 Managing different images with Minikube orchestrator . . . 68
4.7 Data collection . . . 72
4.7.1 First simulation: temperature boundaries . . . 72
4.7.2 Temperature regression for increasing and decreasing temperature functions . . . 74
4.7.3 Temperature and Humidity correlation . . . 75
4.8 Simulation of a real day in Milan . . . 76
4.8.1 Scaling approach: Hysteresis . . . 77
4.8.2 Two different simulations . . . 77
4.9 Machine learning models . . . 79
4.9.1 KNN: K Nearest Neighbours . . . 79
4.9.2 SVR: Support Vector Regression . . . 81
4.9.3 DNN: Deep neural network regression . . . 83
4.9.4 LSTM: Long Short Term Memory . . . 85
4.10 Hyperparameters tuning . . . 87
4.10.1 Keras Tuner . . . 93
4.11 Models evaluation . . . 95
4.12 Actions planner design . . . 96
4.13 Achieved results . . . 98
4.14 Possible extensions . . . 98
4.14.1 Parallel hyperparameter tuning . . . 98
4.14.2 Prediction chaining . . . 98
Abstract
Nowadays more and more devices are becoming ”smart”, in fact they can take autonomous decision and interact proactively with the surrounding environment.
Smart home is just one of the most popular terms related with this relevant change we are witnessing and its relevance in this project is mainly due to the fact that the residential sector account an important percentage in terms of energy consumption.
New ways to share and save energy have to be taken into account in order to optimize the usage of the devices needed by houses to make the environment cozy and comfortable for their inhabitants.
The work done with Professor Turgut’s team has improved the knowledge in the smart home system area providing a scalable and reliable architecture, a new dataset and an example of application of these data useful to save energy while satisfying the demands of its inhabitants.
Introduction
Since the days of prehistory the humankind has always looked for a shelter in order to protect itself from elements and bigger and stronger animals. Nowadays our habitations are not caves or huts anymore, this is because we are now able to force the environment to our will and to create houses, apartments, skyscrapers and then cities. Today houses are not only mere buildings, they are smart systems able to react to external events in order to improve the lifestyle quality of its inhabitants. They can acquire data from outside, predict actions performed by users and then react.
It could be reasonable to think that the introduction of so many additional devices can lead to higher power consumption. This is in part correct, but exploiting the smart capabilities of the introduced devices a new cooperative system can be designed which takes into account the desired state by the inhabitants, their behaviours, the outside and inside environment and then acts autonomously in an appropriate way.
By doing this the smart home systems can be used not only to ease the life of its living beings, but also to make power saving reasoning based on the different circumstances and then operate accordingly to save and share energy.
Since the smart home environment is composed by interconnected devices it is quite easy to collect large amount of data because the M2M(Machine to Machine) communication is already set to make the system working properly. This information flow can be forwarded to an artificial intelligence algorithm able to identify the best action to perform in order to react to the current circumstances.
Data collection plays an essential role because it is needed to achieve the needed accuracy and reliability of a predictive model, but how is it possible to simulate the variegated and heterogeneous set of phenomena that have to do with housing? Scaled models allow the simulation of events and circumstances that would be prohibitively expensive to do with the corresponding entities in the real world.
While scaled models had been extensively used in fields such as architecture, structural engineering or fluid dynamics, ScaledHome is novel in its goals of modeling a range of phenomena with different scaling similitude properties such as: the physical properties of the home, the heating/cooling balance of the interior of the home, as well as energy
In order for a green home to take the optimal actions that lower cost and minimize environmental impact, it needs a high quality predictive model based on the various ac-tions that can be taken. Due to the complex interacac-tions between internal and external factors, the geometry of the home and the actuators, such a predictive model is difficult to build. For instance, opening a window at night might lower the temperature, while during the day it might raise it, especially if the window is on the sunny side of the home. Naturally, this depends on the location (Arizona versus Minnesota), season and other factors (is the home shaded by a tree?).
ScaledHome provides a simulation environment where multiple real world scenarios can be mapped in such a way that it is not necessary to install real size actuators and sensors inside real size houses. This will be not only expensive, but it will lead to the need of setting multiple copies of the same system in each location where the real product will be applied since each geographical location has its own specific peculiarities.
The resulting system consists of several agents that actively take actions modifying the environment in order to allow us to model a miniaturized home with an accuracy and realism significantly exceeding a simulation model. Despite real-world homes remain the gold standard in terms of accuracy, ScaledHome represents a flexible and adaptive simu-lation environment to collect and analyze data and perform predictions about the state of the house in order to react to the outside circumstances by taking appropriate actions in an autonomous way.
Since a good part of the energy consumption is due to the residential usage, the opti-mization of the employment of the devices inside the house can lead to a better solution in terms of less environmental impact and lower electricity bills. Despite the fact that the progress of science and technology is causing higher energy demands this kind of optimization is a proof of how the technological development do not consist of just the expansion of energy-hungry data centers, but it can be redirected to greener purposes. The work done with Professor Turgut’s team led to a an heterogeneous system composed of different controllers and agents coordinated by a central entity in charge of communi-cating with all of them and providing high level interfaces to interact with. This has been done in order to design a flexible and scalable system which can be extended by adding new entities without changing the essential structure of the other components.
First we designed an architecture suitable for our simulation and testing purposes able to scale up and serve a desirable increasing traffic generated by third parties since one of the main goals of the project has been to encourage different teams to participate to the project by running their own simulation and so increase the chances of finding the best solution as possible. This has been done by following the software design principles theory as a basement to apply the most suitable and disruptive technologies.
The business logic of the system has been delegated to a single entity which has been scaled up by using micro-services techniques to guarantee reliability and fault tolerance of the whole system.
The containerization of the central entity has been followed by the deployment of several replicas of the service in such a way to load balance the traffic among them.
Then we collected sufficient data to analyze and identify the constrains of the ScaledHome system in order to map real world scenarios inside our scaled model. This part had a great importance in the development of the project because without a reliable mapping to the real world any result even if relevant would not be applicable in a real environment. We had to take into account both the scaling factors and the bounds of the system in order to find a solid mapping between the actual and the simulation scenario.
Thanks to that analysis we have been able to simulate a real world day inside our simu-lation environment with a reasonable matching.
Then we used the data collected to train several supervised machine learning models in order to find the best predictor to use in order to forecast the consequences of possible sets of actions on the system.
A specific entity called hyperparameter tuner has been implemented to tune the hyper-parameters of each model in a flexible way. In fact it can be integrated by adding new machine learning model implementations with the minimal effort. Each model can be set by providing the most promising hyperparameters to evaluate so the hyperparameter tuner can train on all of them using a grid search algorithm in order to find the ones which will lead to the best accuracy.
After implementing our custom hyperparameter tuner we checked the performances and the usability of one new technologies that can be used to ease the tuning by providing higher interfaces for the tuning.
Each machine learning model has been trained after the tuning with more data and then we have been able to identify as the most suitable to our purposes the one with the higher accuracy.
Finally the best model has been used to explore the space of the actions that can be performed at each interval inside the house to reach the target state while minimizing the energy consumption of the whole system.
The final result represents a great improvement in the smart home area since it provides a well scalable architecture and a policy implementation of an energy saving autonomous planner.
The reminder of this paper is organized as follows. A first section introduces the topic and the reasons behind the project. Then the main software engineering principles adopted are underlined in order to support the understanding of the final implementation. After that the essential machine learning concepts have been explained to provide to the reader a complete overview of the subject which will be needed to interpret the outcomes appropriately.
The final section documents the resulting product reporting some relevant modules of the implementation and commenting the most important parts in addition to describing the significant goals accomplished.
1
ScaledHome
1.1
IoT
It is an old term, probably its first appearance in 1999 by Kevin Ashton and at that time it was mainly applied to RFID, supply chain, and the Internet. It stands for internet of things and it is a general term often used to address all the kind of heterogeneous entities interconnected by the same network. A ”thing” can be any physical or digital objects that can be monitored or controlled and it is generally classified into two different categories: actuators and sensors; depending on if they perform actions or if they collect data respectively.
While the human being has limited time, attention and accuracy, computers fed with sufficient data are able to greatly reduce wast, loss and costs in many different areas. In 2009 it has been realized how the conventional diagrams of the Internet was keeping out the most important gateway of information: people.
In this sense the lifestyle of each single individual is a great source of information which can be easily collected. In fact it is going to spread the idea that the size of the network where interconnected device operate will shrink drastically. Actually we now refer as PAN (Personal Area Network) a computer network for interconnecting devices centered on an individual person’s work-space.
Examples of objects that can fall into the scope of Internet of Things include connected security systems, thermostats, cars, electronic appliances, lights in household and com-mercial environments, alarm clocks, speaker systems, vending machines and more. A thing in the IoT can be a person with a heart monitor implant, a farm animal with a biochip transponder, an automobile that has built-in sensors to alert the driver when tire pressure is low or any other natural or man-made object that can be assigned an Internet Protocol (IP) address and is able to transfer data over a network.
According with SAP/Intel and Ericsson statistics the number of connected devices will reach 50-100 billions by the end of 2020. It is reasonable to think that this trend is going to change not only the big industry workflow but also the lifestyle of simple consumers. IoT architectures can consists of one horizontal layer/platform managing heterogeneous information in an efficient manner or they can be composed by merging several different applications to provide specific information in a market-tailored manner.
One of the common consideration about IoT is its relationship with Cloud models. They provide resources on demand ”as a service”, but they are not designed for the volume, variety, and velocity of data that the IoT generates.
In order to overcome this limit Fog Computing can be considered. Its primary goal is to process as much data as possible on the edges of the network. This process can became challenging when the devices at the edge of the network are constrained in their compu-tation capabilities. What cannot be processed at the edges is then passed to the Cloud infrastructure which will perform the most demanding operations in terms of resources usage.
1.2
The Smart home scenario
A classical definition for smart home system could be the following: a smart home is a home equipped with lighting, heating, and electronic devices that can be controlled remotely by phone or computer; and that was completely correct four or five years ago. Nowadays smart houses are much more that just an interface for remote control, they use what in the literature is called automation scheduling to plan different actions that have to be performed. These actions can be manually declared by a human or they can be the final result of an artificial reasoning process which has as main goal to reach a target state. Despite the apparent simplicity, a smart home system became more and more complicated every time we introduce a new smart device in the same network. But having everything connected to the same hub can be incredibly convenient, nonetheless. Think of it this way: each time you are coming back home and you are about a mile away from it, your smartphone tracks your destination and interacts with your house to inform it about your arrival; thanks to that the space heating system increases the temperature inside the house, the lights turn on, the security system disarms and the door opens. So each agent inside the house has a specif task to perform and given a target state to achieve (make the house cozy and welcoming) in such a way that given a context (your arrival) the system is able to select which is the best action to perform.
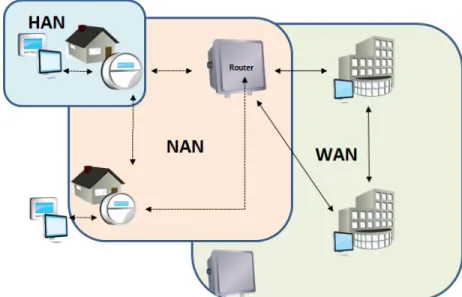
Figure 1: Smart home schema
In order to do that the computation needed by the reasoning process can be remarkable both if we are distributing it among the set of smart devices or we are focusing all the business logic into a central broker entity.
It might seems that because of new entities have to be introduced inside the system we are increasing the amount of energy consumed. In general terms this is correct, but another goal of the smart home systems is to optimize energy demands by for example keeping the temperature lower when no one is in the house.
So, instead of consuming more energy to have more comforts and more support from the smart home system it is possible to obtain all these advantages while saving energy just considering it as an optimization problem.
1.3
HAN: Home Area Network
Home Area Network connects smart appliances, thermostats and other electric devices to an energy management system.
The home area network (HAN) communicates with various smart devices to provide energy efficiency management and demand response. Compared with Neighbourhood area network (NAN) and Wide area network (WAN), the former connects multiple HANs to local point while the latter provides communication links between the NANs and the utility systems to transfer information. As one of the core technologies, an efficient, reliable, and secure communication network plays an important role in realization of all the goals of smart grid NANs.
1.4
Energy consumption due to air condition and space heating
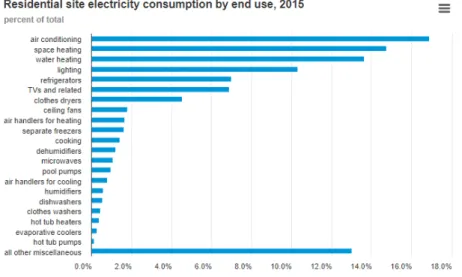
Most of the time when we think about energy consumption we are focusing our attention on huge data centers and big companies or maybe vehicles and public infrastructures, but we forget about the impact that each of us has on the environment and the energy demands around the world.According with the U.S. Energy Information Administration statistics ”in 2018, the resi-dential and commercial sectors accounted for about 40% (or about 40 quadrillion British thermal units) of total U.S. energy consumption.” [1] where for BTU is a non-SI which is defined as the amount of heat required to raise the temperature of one pound of water by one degree Fahrenheit.
The graph below come from the same source [1] and it shows as air conditioning and space heating have the highest percentage of energy consumption when we are considering the residential usage of electricity.
Figure 3: Residential energy usage
Being aware of the main contribution given by the air conditioning and space heating it seems reasonable to focus the optimization process of energy consumption inside residen-tial houses on these two factors, but many additions can be made in order to take into account the others.
According with the review made by Amir Mosavi [2] machine learning has recently con-tribute very well in the advancement of the prediction models used for energy consump-tion. This kind of forecasting has been becoming crucial after the energy crisis in 1973 and it is even more important in these days because of the environmental impact plays an important role, too.
Given a sufficient amount of data about temperatures, contexts and energy consumed it could be possible to use this information to predict the incoming state and the actions required to move to the desired one.
1.5
The Smart Grid
Another factor related with the smart home area concerns the power distribution which is the final stage of in the delivery of electric power from the transmission system to individual customers.
Our current electric grid was conceived more than one hundred years ago when the elec-tricity needs were simple. The power generation was localized and built around commu-nities and at that time there were small energy demands such as few light bulbs and a radio. The grid was designed for utilities to deliver electricity to consumers homes in a unidirectional way; this limited one-way interaction makes it difficult for the grid to respond to the ever-changing and rising demands of the 21st century.
The smart grid introduces a two-way dialog where electricity and information can be exchanged between the utility and its customers. It is a set of smart systems, commu-nication controllers and computers automation working together to make the grid more efficient, more reliable, more secure and greener.
This smart grid enables newer technologies to be integrated such as wind and solar en-ergy production and plug-in electric vehicle charging. Most likely with the participation of informed consumers the smart grid will replace the aging infrastructure of today’s grid and utilities can better communicate with the consumers to help manage our electricity needs.
A smart home can communicate with the grid enabling consumers to manage their elec-tricity usage by measuring home’s elecelec-tricity consumption more frequently through a smart meter. Utilities can provide their customer much better information to manage their electricity bills.
Renewable resources such as wind and solar are sustainable and growing source for electric power; however these are variable by nature and add complexity to normal grid opera-tions. The smart grid provides the data and automation needed to enable solar panels and wind farms to put energy onto the grid and optimize its use. To keep up with constantly changing energy demands utilities must turn power on and off depending on the amount of power needed at a certain times of the day.
The cost to delivery power depends on the time of day it is used, electricity is more costly to deliver at peak times because additional and often less efficient power plants must be run to meet the higher demand. The smart grid will enable utilities to manage and moderate electricity usage with the cooperation of their customer especially during peak demand times, as a result utilities will be able to reduce their operating costs.
By deferring electricity usage away from peak hours and having appliances and devices run at other times, electricity production is even more distributed throughout the day. Smart grid technologies provide detailed information about the NAN that enables grid operators to check and manage electricity consumption in real time. This greater insight and control reduces outages and lowers the need for peak power avoiding this way to fire up costly secondary power plans.
The distribution system routes power from the utilities to residential and commer-cial customers through power lines switches and transformers. While on the actual grid utilities rely on complex power distribution schemes and manual switching to keep power flowing to their customers, the smart grid distribution intelligence counters the unpre-dictable energy fluctuations due to break in the system caused by storm and bad weather by automatically identifying problems in rerouting and restoring power delivery. Utilities can further use distribution intelligence to predict and manage electricity usage with the collaboration of their customers leading to lower production cost.
In addition increasing the number of plug-in electric vehicles to the grid we have the potential to reduce fuel costs, lower our dependency from foreign oil and help reduce greenhouse gas emissions.
We can then say that smart grid is then another very promising aspect of today’s smart changes related with IoT.
1.6
A formal representation of the goal
We define:• T the whole simulation period time. • ti is a time in T
ti ∈ T (1)
• N s as the number of sensors • N a as the number of actuators
• C as the context of the scenario we are simulating, actually it includes the outside temperate and humidity.
• A as the vector of action chosen by the planner in a time t1
A(t1) = [a0, a1, ..., an]; i ∈ [0, N a] (2)
• S as the state of the house, including the temperature, humidity and the actuators state in a time t1
S(t1) = [s0, s1, ..., sn]; i ∈ [0, N s ∗ 2 + N a] (3)
• f (X) is the function able to predict S0(t2) by S(t1) and C(t1) where t1 > t2. The following (4) is a formal mathematical representation of f
f (S(t1), C(t1)) = S0(t2) (4)
• Lp is the loss between the predicted state and the real one in ti.
Lp(ti) = |S0(ti) − S(ti)| (5)
Because ofPtni=1 Lp(ti) is prone to be greater than 0 we will have a loss equal to
L(ti) = |St(ti) − S0(ti)| > 0 (6)
everytime we try to select the best A(t1) action vector to reach St(ti).
So our goal is to find the best f(X) that minimizes the Lp = Ptni=1 Lp(ti) loss and
consequently the L =Ptni=1 L(ti) loss.
In addition we want to minimize the Lcost function which represents the energy con-sumption due to the actuators working time.
1.7
Different types of data sources
To predict new states of the house as consequences of planned actions a huge amount of records is needed.
Three ways to collect information are possible: • From a real size home.
• From a virtual environment.
• From a miniaturized version of a real home.
While the last has to face many problems due to the simulation aspect, which will be discussed in the next chapters, the other two are going to be unfeasible for our purposes. At a first glance, a real size home looks a better solution because it seems really easy to map the simulation results into the real world.
The work done by A. Anvari Moghaddam [3] and his team based their results on this kind of approach and it has been proved without any doubt the accuracy of the outcomes achieved. Despite this, if we want to provide to the planner a sufficient amount of data we would have to install sensors and actuators all around the countries where we want to use it. This happens because it is not possible to use the data collected, for instance, from a small cottage in North Dakota to predict the actions the planner has to perform in a tent placed in the middle of the Sahara desert. These two environments would be too different from each other and the result will be neither satisfactory or useful. With respect to the virtual environment simulation the researches made by Joonseok Park[4] and Kyungmee Lee[5] have shown how even artificial data can be useful to the energy saving programming model, but the fact that data is not collected by real sensors in a real world scenarios still remains. Furthermore, the veracity of the results is hard to demonstrate because many different simulations have to be run and compared with real world scenarios in order to prove the accuracy of the model. In addition, unpredictable factors can effect the consequences of an action while in a virtual environment the en-tropy of the system is limited by the set of circumstances taken into account during the simulation design phase.
The same virtual approach has been adopted during the simulation performed by Lee which consists of a virtual smart home and the sensors within the house created in Unity. This kind of virtual simulation approach is indeed the cheapest alternative for researchers to simulate a configurable smart home environment which enables autonomous agent gen-eration.
On the contrary a scaled approach is widely used in many different areas where the conse-quences of performable actions and surrounding environments are challenging to predict a priori and expensive to test empirically. For example, a scaled version of the Missis-sippi river has been built about an hour west of Boston to rebuild Louisiana’s vanishing coast, which is rapidly being lost to rising seas and sinking land. The team leaded by Dan Gessler [6], of Alden Research Laboratory, is now using this $4 million dollar model to guarantee flood protection while preserving the health of the wetlands. In fact, the today hydraulic architecture is not taking care of the river since it has as its main and only goal to prevent the urbanized area from being surrounded by floods. The physical scaled model is going to be used to study the behavior of hydraulic structures and to find
With reference to our specific scenario a physical scaled version of a suburban home provides real data and it will be easier to set up compared with several real houses located all around the world. Also, it would be possible to use the same house for different scenario because the environment can be changed with only a little effort. Despite the fact that the simulation will be easier and a larger amount of data can be collected, it will be more challenging to use the results in a real home environment and many considerations should be taken into account in order to reach reliable results.
1.8
Related work
The work done by Prashant Shenoy and the members of the Laboratory for Advanced Software Systems [7] has led to a set of heavily instrumented real-size smart homes used to collect data and to write a large amount of high quality papers. They are able to provide a wide amount of test-beds useful to experiment new techniques and algorithms to improve the smart home efficiency. A part of the data collected is available on the web page of the project and it has been very useful to introduce the optimization matter and its related problems since it shares with ScaledHome the same goals and the same procedure even if the data set collected comes from real houses instead of scaled ones. It has also necessary to mention the work done by Lin and his team [8]. They have examined the relationship between the behavior of in-home inhabitants and indoor air quality based on the data collected from several smart home sensors and chemical indoor air quality measurements. This has been done by gathering data from two smart homes and analyzing how indoor air quality affected the human behaviour inside the house, as well as the relationship between different groups of smart home features and indoor air quality variables. To analyze this data they used different machine learning models such as random forest, linear regression, and support vector regression. The conclusion can be summarized as follows: there is a strong relationship between in-home human behavior and air quality and this observation can be generalized across multiple smart homes. The temperature was found to be the most relevant selected feature among human activities. The author believed that the temperature changes within the homes were caused by mul-tiple human activities, making it the most impactful feature within the data-set.
Instead of proving the importance of air quality the work done by Jin et al. [9] has produced as final result a prediction model able to optimize the power consumption for heaters within a smart home environment. The model has been achieved by implementing a recurrent neural network (RNN) and a long short memory model (LSTM) which utilized real data about temperature and humidity collected by a real-size physical home. The final outcome is an optimization scheme that saves energy while providing a comfortable environment in terms of user-desired temperature and humidity.
The study conducted by Mateo [10] and his team has used different kind of regression
models in order to predict the temperature with a average error of about 0.1◦C. It has
to be pointed out that the model has been applied only to large buildings and because of that target the results cannot be applied in a smart home system.
Weatherman is the model presented by Chen and Irwin [11] that analyzes energy con-sumption data as well as wind and solar generation data to predict where on earth a set of coarse energy consumption data has occurred. The main idea behind Weatherman is that a set of weather signatures appear in a similar way in different environments around the world. The result of the research can be applied in the construction of energy con-sumption aware environments around the world.
implemented inside smart homes in order to maintain a cozy temperature defined by the user in an energy-efficient way. The dynamicity of the model allows it to re-train itself based on new activities inside the home.
The work done by Kim [13] has been about a different probability-based algorithm to identify human activities inside the house. The target application scenarios are human-centered such as healthcare and education. The research focused on the recognition of multiple patterns and the ambiguity of different actions.
As well as the algorithm developed by Kim, the smart home created by Cook et al. [14] has as main goal to accurately predict inhabitant action. Their neural network algorithms predictions facilitated an adaptive and automated environment meant to improve the ex-perience of its inhabitants.
Fritz and Cook [15] focused their work on elderly healthcare. They discussed the appli-cation of health-assistive smart homes by using data collected from sensors in elderly pa-tients’ homes, monitoring it with intelligent algorithms, and predicting potential changes in the health status of the patients.
The smart home health-based model proposed by Alberdi et al. [16] is about healthcare too. Using data collected in more than two years they developed two models. The first is able to detect changes in mobility skill while the second is related with the detection of changes about memory skills. Both of them act as an early warning system meant to prevent potential dangerous symptoms to be harmful.
A completely different purpose leaded Dahmen and his team [17] to focus on the security aspect in smart homes. The model implemented has the goal to detect anomalies within the home behaviours in order to automatically detect threads and identify proper actions to be taken in order to guarantee the security of the environment.
1.9
The reason behind ScaledHome
ScaledHome has been built to accomplish the goal of collecting a large amount of data in order to set up a predictive model able to support the air conditioning system.
We used the term support with respect to AC system because our purpose has not been to take over the AC system. In fact, there are many different scenario where the importance of the role played by AC cannot be neglected. For example, when we want to reach a state which is very different than the current state no energy-saving actions inside the house can be performed to achieve it and the only solution still remain to turn on the AC system. Nonetheless, there are many other scenarios where our target state is close to the one we want to achieve. In those cases the heterogeneous state of the rooms inside the house can be balanced in order to reach the target state saving as much energy as possible.
For instance, consider a simplified situation where we have just two rooms with different temperatures (Ta and Tb) and we are interested in reaching a target temperature T. If T is in the [Ta, Tb] range it is possible to decrease the temperature of the warmest and increasing the one of the coldest just allowing them to exchange thermal energy.
With this consideration in mind a planner able to take autonomous choices in order to accomplish the target state requirements with the minimum energy consumption as pos-sible would be a great improvement in the smart house area. For this reason a large amount of data is needed in order to build the predictive model used by the planner. It is also necessary to point out the nature of the data collected, they are in fact gathered by empirical experiments run in the real world in order to guarantee the maximum cor-respondence between actual scenarios and the simulation ones. The similitude is reliable because in contrast with a virtual simulation the actions performed and their consequences are true actions and effects on the state of the house.
1.10
Interpreting ScaledHome experiments: the scaling problem
Some considerations about the scaling approach adopted have to be taken before moving on. Because of every simulation runs in a scaled environment the results of this work has to be mapped into the real world.This mapping has to consider not only that the time speed inside the house is different, but also that every length change leads to a spatial dimension raised to the third ratio change since this is due to the relation between length and a physical space.
It is not hard to understand how this kind of similitude could be very difficult to achieve for a human being and for a standard artificial planner, too.
That is an additional reason why several machine learning techniques have been employed in order to reach our goal.
The mapping between scaled models and real world models is not novel, it has already been faced in many engineering areas and all of them found their base on the Bucking-ham p-theorem which formalizes how a n dimensional problem can be described as the combination of p = n − k dimensionless parameters where k is the number of physical dimension.
This kind of considerations have to be taken into account in order to apply the results to a real world scenario.
1.11
ScaledHome: a physical scale model of a suburban home
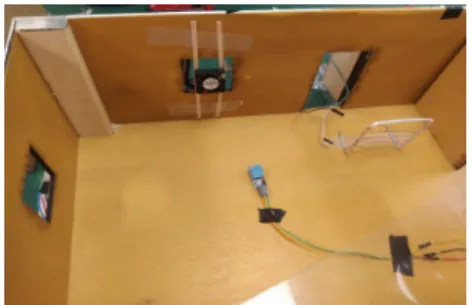
ScaledHome is composed of 6 rooms and each of them has at least a temperature and humidity sensor, a door and a window. The model has eight windows and seven doors, two of which are entrances to the house. Each door and window is connected to a motor to open and close it, this is done in order to both simulate a real human being moving inside the house and to provide to the planner an alternative way to change temperature and moisture inside each room.Figure 6: Rooms and motors
Figure 7: AC and heater
A small fan and an heater have been in-stalled inside the house to reproduce the AC cooling and heating systems, these two devices were needed to change the inside temperature and moisture independently
from the outside environment. In fact,
the goal of this project has been to use these two devices as less as possible and in-stead of consuming energy accomplish the desired requirements by opening and clos-ing doors and windows. In order to simu-late the outside environment there are also a fan and a lamp representing the wind trend and the sun respectively.
2
Software architecture principles
Before stepping into the real implementation which has led the project to the results we were interested in; it is better to introduce the principles that have been taken into account during the development of the product in terms of software architecture. When we talk about software architecture we mean a set of fundamental a priori choices made before implementation than will be hard to change once performed.
A good software architecture should be resilient to extreme cases even when they are not expected. In order to do that several considerations have to be taken into account, such as:
• Performance: a good set of choices will lead to a fast and performing application able to handle multiple request or multiple action all together.
• Scalability: an entity is well scalable if it can grow and manage increased demand over the time. In order to do that the system has to be able to require and obtain new resources if the number of requests increases beyond a well defined threshold, this can be set in terms of resources consumption or in terms of latency.
• Reliability: this property is related with the probability of failure-free software operation for a specified period of time in a specified environment, it should be as great as possible because we want make services and resources available most of the times.
• Flexibility: a flexible architecture can handle many changes with less effort as pos-sible. New features and new entities have to be introduced modifying the original structure as less as possible.
• Security: all the application which want to provide services for entities able to consume them have to be aware that not each of them will have an honest purpose. For that reason safety precautions have to be taken into account, even knowing that this will always effect badly the performance.
• Availability: it is the characteristic which represents how easy and how often the services provided by the architecture are accessible by interested entities.
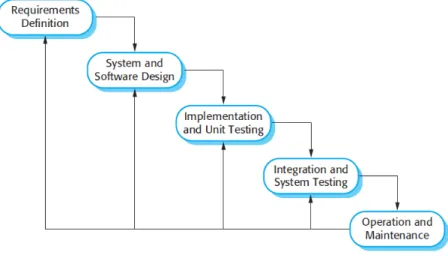
A good architecture can still be changed if the requirements will change, but an high frequency change of the architecture is often a symptom of bad choices made in the be-ginning of the project. For that reason every time a new system has to be developed it is a good habit to spend some time analyzing the requirements and designing the architec-ture before starting to implement the code. Also it is better to test each component of the application by itself before integrate it with the whole system and then test all the components together.
The following diagram shows which is a good practise to take when we are facing a com-plex design architecture.
Figure 8: Rooms and motors
As we can see after the requirements definition and the system and software design we find the implementation step alongside testing. That consideration leads us to the next main concept.
2.1
SOA paradigm
The term SOA stands for Service Oriented Architecture and according to the SOA Man-ifesto it ”is a paradigm that frames what you do. Service-oriented architecture (SOA) is a type of architecture that results from applying service orientation.” [18].
A Service Oriented Architecture leads the system to share as many components and services as possible. There are two major roles within Service-oriented Architecture:
• Service provider: the service provider is the maintainer of the service and the orga-nization that makes available one or more services for others to use. To advertise services, the provider can publish them in a registry, together with a service con-tract that specifies the nature of the service, how to use it, the requirements for the service, and the fees charged.
• Service consumer: The service consumer can locate the service metadata in the registry and develop the required client components to bind and use the service. Basically, a system developed according with the SOA paradigm has the main aim of splitting the code into services. Each module has its own service to provide, but it can interact with the others when multiple services have to work together in order to satisfy some common requirements or when a service is needed to make available an other ser-vice.
SOA leads to a more flexible architecture and it is commonly considered a good practise in every complex scenario where the system has to change frequently every time a new module has to be integrated inside the whole application.
The following picture illustrates the main difference between a monolithic and SOA ar-chitectures.
Once a SOA architecture has been designed it can be deployed as a single application bundling all the modules together or it can be distributed among different nodes which communicate each other in a cluster or cloud architecture.
2.2
Continuous Integration (CI) and Continuous Deployment (CD)
First we have to define these two terms:
• Basically, CI means merging different developing branches into a common main flow. This became even more important when teams with different scopes and skills have to work on the same project such as ScaledHome where I had to work with a mainly computer science team which has the primary background in the data mining and machine learning while my background was main devoted to the distributed system area. CI is often used in combination with test-driven deployment which is done by running and passing all unit tests in the developer’s local environment before committing to the mainline. In order to do that many automated test tools are widely used and available to the developers communities depending on their different languages and technologies.
• CD is often confused with Continuous delivery and despite of they share some common denominators they are two different concepts. Both of them have the aim of being able to ship a product in any moment, but the academic literature agrees that while Continuous deployment involves a manual activity, Continuous development uses an automated deployment approach.
2.3
DevOps
DevOps combine these good practices into a broader scope whose purpose it to shorten the system deployment life cycle while keeping an high quality software delivery.
2.3.1 Docker
Docker is now a well known technology, by know it can be referred as a standard
even if it is a set of PaaS product. It
uses OS-virtualization to run custom ap-plications in a self contained environment called container. That means that an ap-plication deployed into a docker container can be shipped and moved across differ-ent platform independdiffer-ently of the
under-ling hardware infrastructure. A custom
application lies on top of different layers, basically the more complex is the applica-tion the more layers will have to be stack. An image is a file containing the instruc-tions needed to run one or more docker instance. Each layer decorate the previous one adding more libraries and frameworks used by the custom application plugged on
top of the stack.
Compared with a classical Virtual
Ma-chine which wrap the entire operating system we are going to use, a Docker container shares the host OS kernel with the other containers on the same physical machine and, usually, the binaries and libraries, too. Because of their lightness due to the fact that they do not have a own OS containers can be migrated and replicated in a easier way than VMs. Load balancing policies and changes are made easier too and this is the reason why when we talk about DevOps we often refer to Docker as the main solution. Thanks to these advantages CI and CD are widely used in containerized environments. For ex-ample if we need to add a new feature to our dockerized application while keeping the service available to an imaginary customer we can create a replica of the application using the old images and in the meantime develop and test the new feature in a new isolated environment creating a different image. Only after a reliable validation the new version can be released replacing the previous one. Dynamic load balancing can be easier for the same reasons, too.
Docker became even more powerful when we are facing cloud or cluster type scenarios because many containers can be spun on the same machine with a minimal effort. In fact when an image has been built it can be stored in an online repository accessible from any kind of platform as shown in the following image.
Figure 11: Docker production environment
In a cluster or cloud environment different containers can interact with each other and there is where the DevOps concept finds its best realization. Usually docker instances communicate throw REST API in order to use specific services. Thanks to that kind of interaction different teams can develop in parallel specific and heterogeneous features and services with just an agreement on which are the API endpoints used to access a service provided by and other containers.
2.3.2 Kubernetes
Kubernetes is an orchestrator for containers instances. It is used to automate containers instantiation and behaviour within the same cluster. Also, Kubernetes restarts containers that fail, replaces containers, kills containers that don’t respond to your user-defined health check, and does not advertise them to clients until they are ready to serve. Kubernetes’s core is the Cluster services, it receives a desired state via API and it takes care of the actions needed to move and to maintain it. The configuration file can be a yaml file or a json file and once it has been fed to the cluster services core it will run the desired images on container hosts called workers.
The atomic configuration entites in Kubernetes are called Pods. A pod is a group of one or more containers which share the same storage, network and specifications for how to run the containers. Most of the times a pod and a microservice are in a one to one relationship even if when two microservices are very coupled, for example if they share the same persistent storage, it can make sense to place them in the same pod.
2.3.3 Micro-services architecture
We have already discussed about SOA architecture and its main advantages and before the advent of distributed system architecture it was the best solution without any doubt. But with the diffusion of internet more and more applications start moving the compu-tational overhead towards back-end services making them available over HTTP for the users. This has eased the update of software versions because new releases can be de-ployed on the same server the users where accessing before the release. This solution keeps an high QoS because flexible providers are able to scale up the number server instances when the demand increases and vice versa.
The problem arises when for example just one of the services is overwhelmed by a traffic peak, in this case the whole application has to scale up even if the other services are work-ing without additional effort. The approach suggested by Docker and Kubernetes in the previous section is called Micro-services architecture and after what we have said about CI and CD it should be easy to understand why Micro-services are so widespread used. Disparate services can be developed, tested and delivered while guaranteeing scalability, reliability, flexibility and availability. Instead of keeping the entire application bundled as a single entity each service can be containerized keeping just the few resources and code needed to serve a specific task. When a container fails or when the traffic arises Kubernetes can automatically instantiate new replicas of the same image while keeping still the number of the other containers.
Despite the Micro-services community tends to stress the difference between SOA archi-tecture and Micro-services it seems reasonable to say that they have the same purpose, but they differ in the context where they can be applied. The former has been used mainly on single machine architectures while the latter is now wide spreading because in many cases we face distributed and cloud architectures.
In addition, we have to say that moving a SOA architecture to a micro-services system is not so complicated. Thanks to the SOA paradigm the different functionalities inside the application are already well split and thanks to Docker, Kubernetes and CI/CD tools the greatest part of the deployment is heavily eased by external support.
In order to achieve such architecture functionalities have to be split and organized wisely delegating as less duties as possible to each of the modules comping the application. These well organized pieces of code are so called micro-services because they are small
and they provide few specif services. On the other hand the interaction between them can be tricky and more and more challenging while the size of the project increases. For this reason an entity able to manage their interaction grant an higher level interface is needed.
2.4
Middleware
In a loose sense, a middleware in the software engineering area can be described as the ”glue” which keeps together different and modular part of the same system. It is the infrastructure with coordination duties which overcomes the problems due to the heterogeneity nature of many ad-hoc scenarios.
Basically a middleware acts as support base to higher level applications. The following can be a more formal definition.
2.4.1 Definition
The definition of middleware was born in 1968 in the famous NATO school of Software Engineering, but it become more significant after the 90’ because the the widespread diffusion of distributes system design practices. Nowadays, according with Etzkorn, a middleware can be defined as a ”software that connects computers and devices to other applications.” Another way to define middleware is to say that ”it acts as an interme-diary. It is often used to support complicated and distributed applications. It can be a web server, application server, content management system, or other tool that supports application development and delivery. It can also be a software application that connects two or more applications so that data can be shared between them.” [19].
2.4.2 Advantages
A middleware approach leads to the following advantages:
• Transparency: a middleware provides to the application level an higher level of abstraction to interact with hiding the heterogeneity due to several subsystems that have to share data and access or provide services even if they are completely different. This transparency enable the developer to spend more time and energies to improve the business logic without taking into account how the underlying assets interact each other, and the same concept eases the life of a new person that has to interact with the whole system.
• Flexibility: because of the middleware has to respect the ”loose-coupling” principle it makes changes of existing entities or introduction of new ones easier.
• Grant necessary availability and QoS: a middleware has also to deal with resources discovery and QoS.
2.4.3 Disadvantages
In terms of main disadvantages we have to say that the introduction of a new entity make our system more complex and it force the addition of a new interaction each time two entities have to communicate.
In addition without any replication techniques the middleware service represents a single point failure since the communication flow is force to pass though this entity.
2.5
Entities interaction patterns
Many ways are possible to make different entities interact each other. Because of the set of requirements for this project includes interaction in a high heterogeneous environment we are going to mention only those pattern suitable to this requirement.
2.5.1 REST
REST stands for ”Representational state transfer”. RESTful Web services allow the requesting systems to access and manipulate textual representations of Web resources by using a uniform and predefined set of stateless operations. Compared with SOAP which is a standardized protocol such as HTTP and SMTP that describes how programs built on different platforms and programming languages could exchange data in an easy manner, REST is an architectural style in which a web service can only be treated as a RESTful service if it follows the constraints of being:
• Client-Server • Stateless • Cache-able • Layered System • Uniform Interface
In terms of bandwidth usage SOAP is a more complicated service oriented protocol. Since SOAP Messages contain a lot of information inside of it, the amount of data transferred using SOAP is generally a lot.
1 < ?xml v e r s i o n=" 1.0 "? >
2 < SOAP - E N V : E n v e l o p e
3 x m l n s : S O A P - ENV =" h t t p : // www . w3 . org / 2 0 0 1 / 1 2 / soap - e n v e l o p e "
4 SOAP - E N V : e n c o d i n g S t y l e =" h t t p : // www . w3 . org / 2 0 0 1 / 1 2 / soap - e n c o d i n g ">
5 < s o a p : B o d y > 6 < D e m o . g u r u 9 9 W e b S e r v i c e x m l n s =" h t t p : // t e m p u r i . org / "> 7 < E m p l o y e e I D > int < / E m p l o y e e I D > 8 < / D e m o . g u r u 9 9 W e b S e r v i c e > 9 < / s o a p : B o d y > 10 < / SOAP - E N V : E n v e l o p e >
Listing 1: Soap message as XML file
While REST does not need much bandwidth when requests are sent to the server. REST messages mostly just consist of JSON messages. Below is an example of a JSON message passed to a web server. You can see that the size of the message is comparatively smaller to SOAP.
1 {
2 " c i t y ":" M u m b a i ",
3 " s t a t e ":" M a h a r a s t r a "
4 }
2.5.2 Publish Subscribe (MQTT)
Publish/subscribe messaging, or pub/sub messaging, is a form of asynchronous service-to-service communication used in serverless and microservice-to-services architectures. In a pub/sub model, any message published to a topic is immediately received by all of the subscribers to the topic. Pub/sub messaging can be used to enable event-driven architectures, or to decouple applications in order to increase performance, reliability and scalability. Pub/Sub interaction is compliant with the ”Loose coupling principle” which states that entities in the same system have to be as much decoupled as possible, in fact in a pulishers and subscribers are not only decoupled in time, but in space too.
They do not need to know the location of each other because the broker takes care of all these aspects.
Figure 12: MQTT mono and bidirectional communi-cation
MQTT is an open OASIS and ISO standard (ISO/IEC PRF 20922) and it was invented by Dr Andy Stanford-Clark of IBM, and Arlen Nipper of Arcom (now
Eu-rotech), in 1999. It stands for
MQ Telemetry Transport.
Ac-cording with the mqtt.org web-site MQTT ”is a
publish/sub-scribe, extremely simple and
lightweight messaging protocol, designed for constrained devices and low-bandwidth, high-latency or unreliable networks. The de-sign principles are to minimise network bandwidth and device resource requirements whilst also attempting to ensure reliability and some degree of assurance of
delivery. These principles also
turn out to make the protocol ideal of the emerging “achine-to-machine (M2M) or Inter-net of Things world of connected devices, and for mobile applications where bandwidth and battery power are at a premium.”[20].
Because of its lightness MQTT represents a gold standard in the M2M communication and it is even more suitable in cases where devices with limited hardware resources have to interact each other. Its usage in this project is due to the fact that it is a well known standard and because many Open SaaS are available online.
In this project I have used ”cloudmqtt” as SaaS because it offers a free tier with up to 5 clients and 24/7 availability [21]. It is quite easy to configure and it offers interfaces to monitor the state of the connections and to set ids and passwords for each authorised client.
A single topic for the three clients composing ScaledHome (Home-Controller, Actuators-Controller and Sensors-Actuators-Controller) has been deployed.
2.5.3 MQTT QoS
It is important to underline that it is also possible to set a desired QoS. The possible options are:
• At most once (QoS 0): this service level guarantees a best-effort delivery. There is no guarantee of delivery. The recipient does not acknowledge receipt of the message and the message is not stored and re-transmitted by the sender. QoS level 0 is often called “fire and forget” and provides the same guarantee as the underlying TCP protocol.
Figure 13: Pub/Sub interaction diagram
• At least once (QoS 1): QoS level 1 guarantees that a message is delivered at least one time to the receiver. The sender stores the message until it gets a PUBACK packet from the receiver that acknowledges receipt of the message. It is possible for a message to be sent or delivered multiple times.
• Exactly once (QoS 2): QoS 2 is the highest level of service in MQTT. This level guarantees that each message is received only once by the desired recipients. With QoS 2 the service will be slow and safe. The guarantee is provided by at least two request/response flows (a four-part handshake) between the sender and the receiver. The sender and receiver use the packet identifier of the original PUBLISH message to coordinate delivery of the message.
When a receiver gets a QoS 2 PUBLISH packet from a sender, it processes the publish message accordingly and replies to the sender with a PUBREC packet that acknowledges the PUBLISH packet. If the sender does not get a PUBREC packet from the receiver, it sends the PUBLISH packet again with a duplicate (DUP) flag until it receives an acknowledgement. Once the sender receives a PUBREC packet from the receiver, the sender can safely discard the initial PUBLISH packet. The sender stores the PUBREC packet from the receiver and responds with a PUBREL packet. After the receiver gets the PUBREL packet, it can discard all stored states and answer with a PUBCOMP packet (the same is true when the sender receives the PUBCOMP). Until the receiver completes processing and sends the PUBCOMP packet back to the sender, the receiver stores a reference to the packet identifier of the original PUBLISH packet. This step is important to avoid processing the message a second time. After the sender receives the PUBCOMP packet, the packet identifier of the published message becomes available for reuse.
Figure 15: Pub/Sub interaction diagram
In our case we have used QoS 2 which means that messages can arrive duplicated, but they will arrive for sure. In fact, we are not interested in receiving each message exactly once because any kind of filtering can be done on the Home-Controller in case messages arrive duplicated, while a QoS 1 would not be reliable enough because we have to be sure that every message arrive to the intended receiver in order to collect data or perform actions while maintain the synchronization with the model stored inside the middleware.
2.6
MVC pattern
MVC stands for Model-View-Controller and it is a design pattern commonly used for developing user interfaces.
According with the Design principles book: ”MVC decouples views and models by estab-lishing a subscribe/notify protocol between them. A view must ensure that its appearance reflects the state of the model. Whenever the model’s data changes, the model notifies views that depend on it. In response, each view gets an opportunity to update itself. This approach lets you attach multiple views to a model to provide different presentations.” [22].
It splits the system into three different entities:
• MODEL: this entity directly manages the date, keep track of the current state and handles sessions.
• VIEW: this is what is going to be presented to the user, it has to be user-friendly even to those who are not very familiar with the specific user-case the application is facing.
• CONTROLLER: it accepts inputs from the user and performs actions in order to modify the state inside the model or to retrieve data from it.
It eases the development of applications that have to interact with the user by mapping different services into different entities. Each of the different parts composing the appli-cation can be developed by different person simultaneously because they are decoupled from each other with reference to the ”loose coupling principle”.
2.7
Relation and Non-Relational Databases
Databases are used to store persistent data which can be gathered by interested applica-tions later.
Relational databases represent and store data in tables and rows. They’re based on a branch of algebraic set theory known as relational algebra by using Structured Query-ing Language (SQL) which makes them a good choice for applications that involve the management of several transactions. The structure of a relational database allows to link information from different tables through the use of foreign keys (or indexes), which are used to uniquely identify any atomic piece of data within that table. Other tables may refer to that foreign key, so as to create a link between their data pieces and the piece pointed to by the foreign key. This comes in handy for applications that are heavy into data analysis. Relational algebra states that the relationship between tables must remain consistent as a consequence of the normalization which is the practise consisting in refer-encing existing elements by other tables. For many years relational databases have been the most common type of databases; MySQL, PostgreSQL and SQLite3 are just some of the widespread implementations.
Nowadays the requirements may have changed; in particular when we have to face spe-cific scenarios such as IoT or real-time application the solid structure offered by relational databases is often not suitable. In fact many savings of unstructured data have to be han-dled concurrently and simply they do not fit the tables defined a priori.
In that situation it is may needed to consider going with a non-relational database. A non-relational database just stores data without explicit and structured mechanisms to link data from different tables (or buckets) to one another. This way they overcome the limits of relational databases storing data in more flexible formats. Instead of storing data into rows and columns the atomic data is stored into a document; which is compliant with JSON format standard. In the same way rows and columns are organized into tables, sets of documents can be grouped into collections. Documents in the same collection do not have to share a common structure and for this reason they are more suitable to store un-structured data which would be hard to process and normalize real-time. One of the most popular non-relational databases is MongoDB, it offers also standardized connectors for Javascript frameworks like NodeJs. Since Mongo doesn’t automatically treat operations as transactions the way a relational database does, transaction must be manually created and then manually verified, the same happens in case of commit or roll back. This is of course the main disadvantage, but we have also to consider that since there are no joins like there would be in relational databases, multiple queries have to be handled manually in the code. This main disadvantage can be partially solved avoid any kind of reference distributing multiple replicas of the same record among the documents instead. This is only a partial solution that can save time when a new document is inserted while updates lead to the distributed caching invalidation problem which occurs when a single replica is modified and the update has to be propagated to the others.
3
Data mining and Machine Learning principles
3.1
Data preprocessing in Data Mining
Vast amounts of data are around us in the world; it has always been this way, but thanks to the continual improvement of digital technologies we can now gather them automatically saving effort. In fact, most of the times the hardest part of the Data Mining process is not to collect the data, but it is to properly process them instead.
Data preprocessing is a data mining technique that involves transforming raw data into an understandable format. Real-world data is often incomplete, inconsistent, and/or lacking in certain behaviors or trends, and is likely to contain many errors. Data preprocessing is a proven method of resolving such issues.
The importance of the preprocessing phase comes from the need of handling reliable data instead of sparse and noisy data.
When we have to deal with real world data we have to face one or both the following problems:
• Noise: it can be generated by faulty data collection, data entry errors or a wrong data collection procedure. It will affect badly the results in the learning phase. • Inconsistency: we can define inconsistency as anything that affects the data
in-tegrity. In fact especially if you’re using the database as a System of Record any duplicated record or unpredicted data type can lead to unexpected results in the learning phase.
3.1.1 Steps Involved in Data Preprocessing:
• Data cleaning: The data can have many irrelevant and missing parts. To handle this part, data cleaning is done. It involves handling of missing and noisy data.
– Missing Data: this situation arises when some data is missing in the data. It can be handled in various ways, such as ignoring the tuples or fill the missing values with attribute mean or the most probable value.
– Noisy Data: noisy data is meaningless and it cannot be interpreted by a ma-chine. To solve it we can use one of the following methods:
∗ Binning method: this method works on sorted data in order to smooth it. The whole data is divided into segments of equal size and then various methods are performed to complete the task. Each segmented is handled separately. One can replace all data in a segment by its mean or boundary values can be used to complete the task.
∗ Regression: here data can be made smooth by fitting it to a regression function.The regression used may be linear (having one independent vari-able) or multiple (having multiple independent variables).
∗ Clustering: this approach groups the similar data in a cluster. The outliers may be undetected or it will fall outside the clusters.
• Data tranformation: this step is taken in order to transform the data in appropriate forms suitable for mining process. This involves following ways:
– Attribute selection: in this strategy, new attributes are constructed from the given set of attributes to help the mining process.
– Normalization: it is done in order to scale the data values in a specified range. Usually the target range is between zero and one.
– Standardization: it transforms data to have a mean of zero and a standard deviation of one, it is also called z-score standardization.
– Discretization: this is done to replace the raw values of numeric attribute by interval levels or conceptual levels.
– Concept Hierarchy Generation: here attributes are converted from level to higher level in hierarchy. For Example-The attribute “city” can be converted to “country”.
• Data Reduction: since data mining is a technique that is used to handle huge amount of data. While working with huge volume of data, analysis became harder in such cases. In order to get rid of this, we uses data reduction technique. It aims to increase the storage efficiency and reduce data storage and analysis costs. The various steps to data reduction are:
– Data Cube Aggregation: aggregation operation is applied to data for the con-struction of the data cube.
– Attribute Subset Selection: the highly relevant attributes should be used, rest all can be discarded. For performing attribute selection, one can use level of significance and p- value of the attribute.the attribute having p-value greater
than significance level can be discarded. This is done because an high
p-value is symptom of a great difference of the attribute compared with the null hypothesis.
– Numerosity Reduction: this enable to store the model of data instead of whole data, for example: Regression Models.
– Dimensionality Reduction: this reduce the size of data by encoding mecha-nisms. It can be lossy or lossless. If after reconstruction from compressed data, original data can be retrieved, such reduction are called lossless reduc-tion else it is called lossy reducreduc-tion.