i
GENETIC ANALYSIS OF GH1, GLI2 AND SHOX GENES
IN PATIENTS WITH GROWTH IMPAIRMENT
By
DEEPAK BABU
A thesis submitted to
The Department of Health Sciences of the
University of Eastern Piedmont
In partial fulfilment of the requirements
for the degree of
Doctor of Philosophy
in
Molecular medicine
Supervisor:
Prof. Mara Giordano
Coordinator:
Prof. Emanuele Albano
Year 2015
ii
ACKNOWLEDGEMENTS
First and foremost I would like to thank my supervisor Prof. Mara Giordano for giving me the opportunity to carry out this research. I appreciate all her contributions of time, advice, patience and funding to make my PhD possible.
I would also like to thank my fellow PhD student Ileana Fusco for her constant support, help and friendship during the last three years.
I wish to express my sincere gratitude to all the members of my group, both present and past, for providing a wonderful environment to work in. I gratefully acknowledge the contributions of Michela Godi, Simona Mellone, Ranjith Muniswamy and Gillian Walker to this work.
I would like to extend my special thanks to Alessandra Bagarotti and Lucia Corrado for their valuable encouragement, help and friendship. I know that I could always go to them for advices and opinions and they were most supportive whenever I needed. I will never forget the fun activities we have done together.
Laboratory of Genetica has been a place of friendships and fun. I would like to thank Nadia Barizzone, Antonella Fanelli, Clarissa Locci, Elena Corsetti, Giulia Predebon, Miriam Zuccalà, Sabrina Botta and all the other present and past members of the laboratory for their friendship and support.
Lastly, I would like to thank my family and friends for all their love and encouragement. I am grateful to my parents and my sister for their unconditional support in all my pursuits, to whom I dedicate this thesis.
i
LIST OF CONTENTS
List of Tables iii
List of Figures iv
List of Abbreviations v
I. INTRODUCTION 1
1. Growth Disorders 2
2. Growth Hormone Deficiency 3
1. GH1 gene 3
2. GH1 mutations and classification of IGHD 4
3. Alternative Splicing in GH1 5
4. Mutations in GH1 splicing elements cause IGHD II 10
3. Combined Pituitary Hormone Deficiency 12
1. Pituitary transcriptional factors associated with CPHD 13
2. Human GLI2 17
3. Role of GLI2 in the development of pituitary 18
4. GLI2 mutations 19
4. Idiopathic Short Stature 20
1. SHOX gene 22
2. SHOX protein and Expression 23
3. SHOX mutations 24
4. SHOX Enhancers 26
5. Phenotypic Variability associated with SHOX mutations 27
II. AIMS 28
III. SBJCECTS 30
1. IGHD Cohort 31
2. CPHD Cohort 32
3. ISS Cohort 33
IV. MATERIALS AND METHODS 34
1. Hormonal investigations 35
2. Genomic DNA Extraction 35
3. Polymerase Chain Reaction 35
4. Sequencing 37
5. T/A Cloning 38
6. Site-Directed Mutagenesis 38
7. Cell culture, Transfection and isolation of RNA 39
8. cDNA synthesis 39
9. Western immunoblot analysis 40
10. MLPA Analysis 40
11. ESE finder analysis 42
12. Gel image analysis 43
V. RESULTS AND DISCUSSIONS 44
1. Novel mutations in the GH gene (GH1) uncover putative splicing regulatory elements.
45
1. Background 45
2. Genetic analysis of the IGHD patients 46
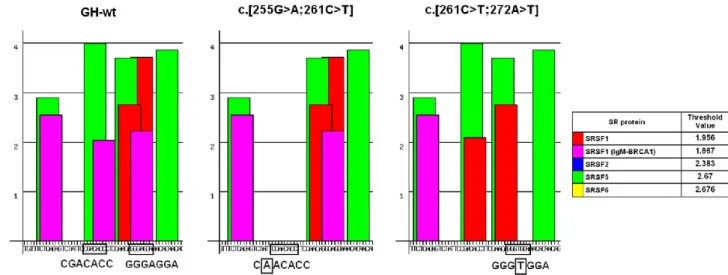
3. Detailed description of patients carrying GH1 variations 47 4. The Exon3 variations fall within predicted ESEs 49 5. Variants c.255A and c.272T affect GH1 splicing in vitro 50
ii
6. Discussion 53
2. Novel GLI2 variations in Italian CPHD patients 57
1. Background 57
2. Novel GLI2 variants 59
3. In silco analysis 61
4. Discussion 62
3. SHOX mutations in ISS patients 64
1. Background 64
2. Molecular Analysis of SHOX defects in ISS patients 64
3. Deletions/Duplications 65 4. Point mutations 69 5. Discussion 73 VI. CONCLUSION 76 VII. REFFERENCES 78 VIII. APPENDICES 89
1. Appendix 1: Primer sequences 90
2. Appendix 2: MLPA probes 93
3. Appendix 3: Plasmids 94
iii
LIST OF TABLES
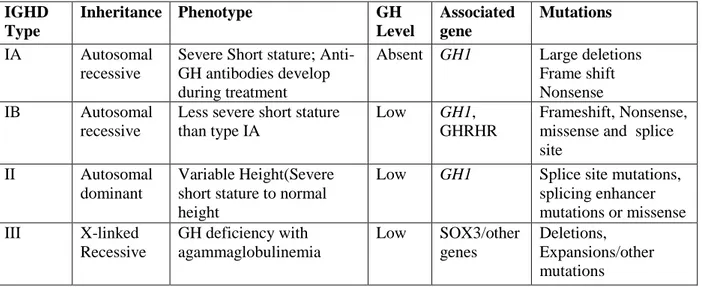
Table 1: Genetic forms of IGHD and the mutations associated with them 5
Table 2: Mutations affecting GH1 splicing 9
Table 3: Mutation frequencies within PROP1, PIT1, HESX1, LHX3, LHX4, and GLI2 in different CPHD cohorts
15
Table 4: Summary of SHOX defects in ISS patients 25
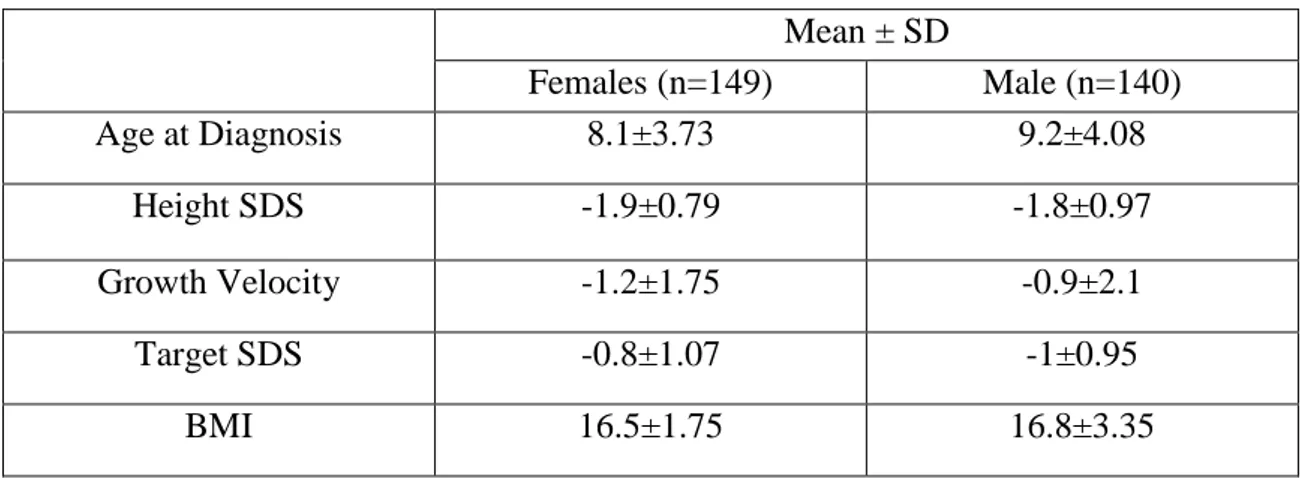
Table 5: Clinical characteristics of the ISS patients screened for SHOX defects 33
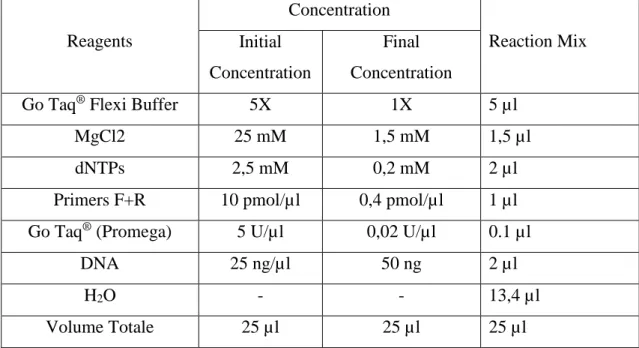
Table 6: PCR conditions for Taq Polymerase 36
Table 7: PCR conditions for DyNAzyme EXT DNA Polymerase 37
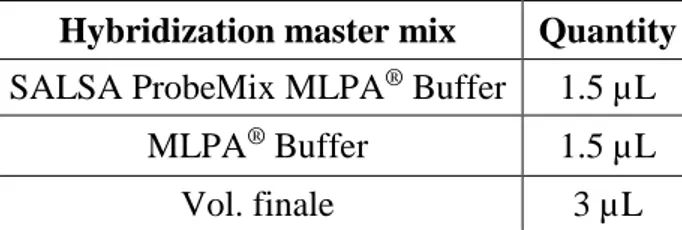
Table 8: MLPA Hybridization reaction 41
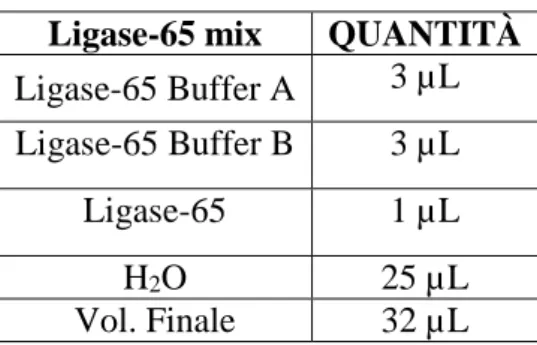
Table 9: MLPA Ligation reaction 42
Table 10: MLPA PCR reaction 42
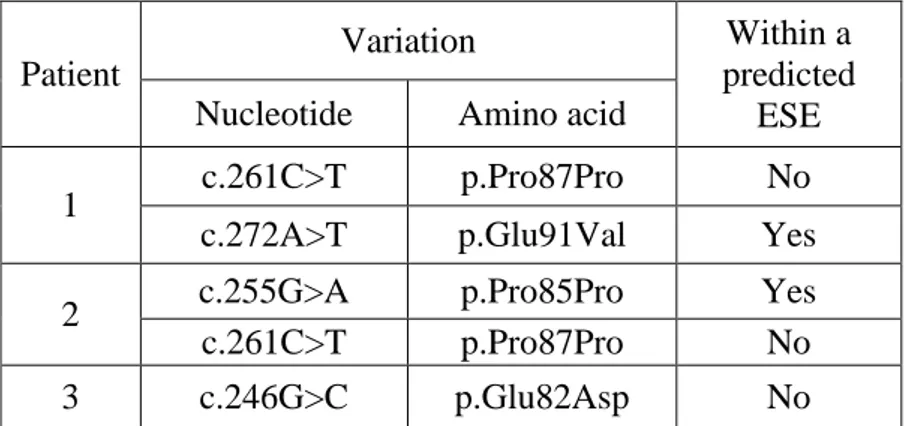
Table 11: Exon 3 variation identified in IGHD patients 48
Table 12: Clinical characteristics of CPHD patients identified with GLI2 mutations 60 Table 13: Insilico analysis of the novel variants identified in the present study 61
Table 14: Clinical characteristics of patients identified with deletions/duplications 68
iv
LIST OF FIGURES
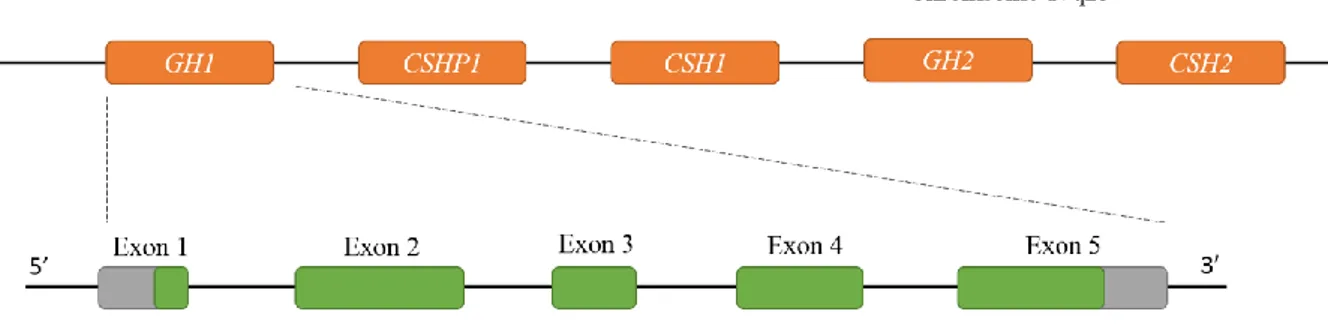
Figure 1: Schematic representation of the GH gene cluster and the GH1 gene 4
Figure 2: Alternative splicing in GH1 7
Figure 3: Location of Exonic and Intronic splicing enhancer mutations identified in GH1 10 Figure 4: Schematic representation of different domains identified in the human GLI2 17 Figure 5: Schematic representation of hedgehog signalling pathway 19 Figure 6: Chromosomal Localisation and genomic structure of SHOX gene 23 Figure 7: Schematic representation of the genomic location of the SHOX enhancers 26 Figure 8: Schematic representation of PAR1 with the location of the MLPA probes 41
Figure 9: ESEs in exon 3 49
Figure 10: Scheme of GH1 pre-mRNA 52
Figure 11: Western immunoblot analysis of the different GH isoforms 53 Figure 12: Schematic representation of GLI2 with the variations identified among CPHD
patients in this study
59
Figure 13: Flow chart detailing the strategy for the molecular investigation in ISS patients 65 Figure 14: The schematic representation of the genomic locations and the approximate
extension of the deletions or duplications
67
Figure 15: Family pedigrees of the ISS probands carrying deletions 70 Figure 16: Family pedigrees of the ISS probands carrying deletions whose relatives were
not available for the molecular analysis
71
Figure 17: Family pedigrees of the ISS probands carrying duplications 71 Figure 18: Family pedigrees of the ISS probands carrying point mutations 72
v
LIST OF ABBREVIATIONS
SDS Standard Deviations Score
rhGH recombinant human Growth Hormone
GHD Growth Hormone Deficiency
CPHD Combined Pituitary Hormone Deficiencies
GH1 Growth Hormone gene
GHRHR Growth Hormone Releasing Hormone Receptor
IGHD Isolated Growth Hormone Deficiency
ESE Exonic Splicing Enhancer
ISE Intronic Splicing Enhancer
IVS Intervening Sequence
ISS Idiopathic Short Stature
SHOX Short stature Homeobox containing gene
CNE Conserved non-coding elements
MLPA Multiplex Ligation-dependent Probe Amplification assay
PCR Polymerase Chain reaction
SHH Sonic Hedgehog Signalling
HPE Holoprocensephaly
aCGH array Comparitive genomic Hybridisation
PAR1 Pseudo autosomal region 1
TS Turner Syndrome
PRL Prolactin
TSH Thyroid stimulating Hormone
CGDP Constitutional delay of growth and puberty
1
2
I.1 Growth disorders
Longitudinal growth is a complex process in which genetic, nutritional, hormonal and environmental factors among others are involved. Growth abnormalities resulting in short stature is one of the most common conditions affecting the childhood growth. The cause of short stature can be either a variant of normal growth or a pathological condition. Variants of normal growth includes familial short stature, constitutional delay of growth and puberty and small gestational age with catch-up growth. Pathological causes of growth defects can be systemic diseases and their treatment, pituitary hormone deficiencies (isolated or combined) or a series of genetic syndromes. Short stature can also be found in individuals where no cause can be identified (idiopathic short stature).
It is assumed that the human height follows a normal distribution (Gaussian distribution) where the height is distributed along a bell shaped curve. The mean height of the population is located at the centre of the curve with shorter and the taller stature distributed towards both the sides. The standard height deviation (SDS) is obtained by subtracting the mean value of the reference population from the observed value and dividing by the standard deviation (SD) value of the reference population. For example, Height SDS = (Child’s height – normal population mean for children of comparable age and sex) / SD of the height of children of comparable age and sex. Height SDS of >-2 SD is used to identify children with short stature. However, it is more likely that stature does not fit a perfect Gaussian distribution and a variety of conditions such as Growth hormone deficiency (GHD), Hypopituitarism, chronic diseases and malnutrition contribute to the extreme cases within the Gaussian distribution.
Successful treatment with rhGH (recombinant human growth hormone) has been developed to achieve the target height in selected children with small gestational age without catch up growth, growth hormone deficiency, idiopathic short stature due to SHOX mutations and other
3
genetic syndromes like Turner syndrome. The accurate and early diagnosis of the abnormal growth patterns are highly important as it allows appropriate treatment and improved clinical outcomes.
I.2 Growth Hormone Deficiency (GHD)
Growth hormone Deficiency (GHD) refers to conditions associated with childhood growth failure due to the lack of growth hormone action. It can be isolated (IGHD) or in combination with other pituitary hormone deficiencies. The incidence of GHD is estimated to be 1/4000 – 1/10000 births (1). While majority of cases are sporadic, 3-30% has an affected relative, suggesting a genetic etiology. In most of the sporadic cases, no cause of GHD can be identified, even though mutations have been identified up to 4% of patients with sporadic growth hormone deficiency. It is assumed that significantly higher proportion of sporadic cases may have genetic causes. Several mutations, including de novo, mainly in the GH encoding gene (GH1) or in some cases, the receptor of growth hormone releasing hormone (GHRHR) have been detected in both sporadic and familial cases of IGHD. The deletion of the entire gene, missense and frameshift mutations produce severe growth hormone deficiency whereas the splicing mutations produce milder forms (2-4). In addition to GH1 mutations, other mutations that cause growth hormone deficiency has been reported in the growth hormone receptor (GHR) gene and in a series of transcription factor genes involved in the pituitary development such as Pit-1, Prop-1, Hesx-1,Sox-2, Sox-3, Lhx-3, Lhx-4 (5).
I.2.1 GH1 gene
Human growth hormone gene (GH1) is located on chromosome 17q23 within a cluster of five highly homologous (92-98%) genes consists of GH1, CSHP (chorionic somatomammotropin pseudogene), CSH1 (chorionic somatomammotropin gene), GH2 and CSH2 (Figure 1) (6,7). Despite the high degree of sequence homology, they express in a tissue-specific manner. While
4
GH1 gene express exclusively in the somatotrophic cells of the anterior pituitary gland, GH2, CSH1 and CSH2 all are expressed in placental level (8,9). All the five genes in this cluster are
located in the same transcriptional orientation and consists of 5 exons separated by 4 introns.
GH1 encode a 217 aminoacid prehormone which is cleaved to yield a mature hormone with
191aminoacods and a molecular weight of 22KDa.
Figure 1: Schematic representation of the GH gene cluster and the GH1 gene.
I.2.2 GH1 mutations and Classification of IGHD
On the basis of clinical characteristics, severity and mode of inheritance familial IGHD has been classified into four types; Type IA and IB, Type II and Type III (Table 1). IGHD Type 1A is the most severe form of IGHD with patients showing early and profound growth failure due to the lack or extremely low levels of serum GH. It has an autosomal recessive mode of inheritance and is caused by deletions removing the entire GH1 or a nonsense mutation leading to a premature stop codon (10-12). IGHD Type IB is a milder form with low but detectable serum GH and positive response and immunological tolerance to treatment with exogenous GH. This condition is inherited as autosomal recessive trait due to the splice site mutations of the GH gene or mutations within gene encoding the GHRH receptor (5). IGHD Type II, a very common form of IGHD which are inherited in an autosomal dominant pattern. They are mainly caused by the GH1 mutations affecting the mRNA splicing and subsequent loss of exon 3. A 17.5 kDa isoform is produced as result of the skipping of Exon 3, which exerts a dominant
5
negative effect on the wild type isoform. The most common cases include mutations within the first 6 bp of intervening sequences 3(IVS3)(13). Several mutations causing skipping of exon3 in patients with IGHDII have also been reported within the Intron Splice Enhancer (ISE) and Exon Splice Enhancer (ESE) sequences (Table 2) (14-16). Missense mutations that affect growth hormone secretion or action or both were also identified to be causing IGHD. Type III is X-linked, recessively inherited disorder. Previous studies have shown that some individuals have an associated X-linked agammaglobulinemia. It is also suggested that the disorder may be caused by mutations and/or deletions of a portion of the X-chromosome containing two loci, one necessary for normal immunoglobulin production and the other for GH expression (17,18).
Table 1: Genetic forms of IGHD and the mutations associated with them.
IGHD Type Inheritance Phenotype GH Level Associated gene Mutations IA Autosomal recessive
Severe Short stature; Anti-GH antibodies develop during treatment
Absent GH1 Large deletions Frame shift Nonsense IB Autosomal
recessive
Less severe short stature than type IA
Low GH1,
GHRHR
Frameshift, Nonsense, missense and splice site
II Autosomal dominant
Variable Height(Severe short stature to normal height
Low GH1 Splice site mutations, splicing enhancer mutations or missense III X-linked Recessive GH deficiency with agammaglobulinemia Low SOX3/other genes Deletions, Expansions/other mutations
I.2.3 Alternative splicing in GH1
Alternative splicing is the event responsible for the production of multiple mature mRNAs with different sequence compositions from a single gene. In most of the cases, Alternative splicing is a very common and crucial mechanism, responsible for the complexity and diversity of the proteome. It is also well understood that alternative splicing isoforms are differently expressed among tissues (19). Majority of the human genes are subject to alternative splicing and genes that code for ten to hundreds of transcripts are common in the genome. Alternative splicing
6
studies on chromosome 22 indicated that about 60% of genes are represented by two or more transcripts (20-22).
Alternative splicing is recognized by several modes of splicing patterns. Some common mechanisms involve; use of alternative 5’ or 3’ splice sites (cryptic splice sites), exon skipping or inclusion, selection between mutually exclusive exons and intron retention. Other important modes for alternative splicing also includes the use of alternative promoters and alternative poly (A) signals. The mechanism of accurate recognition of the exons are significant to maintain the splicing fidelity. For example, a “weaker” splice site is harder to recognize by the splicing machinery and leads to alternative splicing. Alternative splicing has both positive and negative impact on the gene expression. While alternative splicing maintain the greater diversity in proteome, its misregulation underlies several genetic diseases.
When correctly spliced GH1 produces the biologically active 22 KDa protein comprises of all the exons (Figure 2). It accounts for the majority of the circulating GH (10). Despite the correct processing, even under normal conditions, small percentages of at least other four kinds of alternatively spliced isoforms are produced. The presence of an in frame cryptic splice site within exon 3 (Figure 2) gives rise to a transcript lacking the first 45 base pairs of exon 3 and encodes a shorter active isoform of 20KDa representing 5-10% of GH transcripts(23). A 17.5 KDa isoform is produced by the complete skipping of exon 3, which acts as dominant negative isoform (Figure 2). This isoform lacks the entire loop connecting helix 1 and helix 2 in the tertiary structure of GH. This biologically inactive isoform accounts for 0.1 – 5% of GH transcripts and prevents the secretion of the wild type GH (24-26). Trace amounts of transcripts skipping exon 3-4 (11.3 KDa) and exons 2-4 (7.4 KDa) have also been identified (Figure 2). These severely truncated isoforms are biologically inactive (27).
7 Figure2: Alternative splicing in GH1
The classical splicing elements (5’ and 3’ splice sites) are not sufficient enough for the correct identification of the splice sites and maintain splicing fidelity. Additional cis acting regulatory elements are necessary to guide the spliceosome to the splice sites. These elements are capable of stimulating (enhancers) or repressing (silencers) splicing and have an important role in the regulation of alterative splicing. Based on their location and function they are mainly characterised into exonic splicing enhancers (ESEs), exonic splicing silencers (ESSs), intronic splicing enhancers (ISEs) and intronic splicing silencers (ISSs). Among these splicing regulatory elements, ESEs are the most prevalent, widely present and intensively studied. ESEs are short 6-10 nucleotide elements reside within exons, recognised by SR proteins to promote spliceosome assembly (20,28). SR proteins are a large family of structurally related and highly conserved splicing factors which can stimulate the exon definition either by directly recognising the splicing machinery or by antagonising the action of nearby silencer elements (20,28,29). Most of the identified enhancers are purine rich motifs (GC rich), although it is
8
proved that high purine rich composition by itself is not sufficient to promote splicing. Several ESEs are identified with no purine rich elements, mostly AC rich elements (30-32). Although most of the ESEs are studied in the context of alternative splicing(28,32), it is likely that they are also important for constitutive splicing (33).
The canonical splice sites surrounding GH1 exon 3 are relatively weak and require the multiple cis acting splicing elements to maintain the exon 3 definition. Two ESEs residing within exon 3 and an ISE within intron 3 have been well characterised. ESE1 comprises the first 7 base pairs of exon 3 and is essential to maintain the proper recognition of upstream 3’ splice site and silencing the cryptic splice site (14,34). ESE2 is found 12 nucleotides upstream of the cryptic splice site and comprises of 15 nucleotides(14). ISE is a nine nucleotide sequence within intron 3(IVS3+26-34).
9 Table 2: Mutations affecting GH1 splicing.
GH1 mutation Type Comment Location Reference IGHD
type Mutations within Exon Splice Enhancers
Glu32X; E3+1G>T
Heterozygous ESE1; loss of exon 3 (amino acids 32–71) Exon 3, c.172G>T* Takahashi et al.(35) II Glu32Lys; E3+1G>A
Heterozygous ESE1 Exon 3,
c.172G>A*
Shariat et al. (24) II
Glu32Ala; E3+2A>C
Heterozygous ESE1; 17.5 kDa (68%), 20 kDa (22%) Exon 3, c.173A>C* Petkovic et al. (16) II Glu33Gly; E3+5A>G
Heterozygous ESE1; 17.5 kDa (62%), 20 kDa (27%)
Exon 3, c.176A>G*
Moseley et al. (34) II
Lys41Arg Heterozygous ESE2; 20% exon skipping
Exon 3, c.200A>G*
Millar et al.(36) II
Splice site Mutations
IVS2 –1G>A Heterozygous 3’ acceptor splice site Intron 2 Millar et al. (36) II IVS2 –2A>T Heterozygous 3’ acceptor splice site Intron 2 Fofanova et al. (37) II IVS3+1G>A Heterozygous Skipping of exon 3,
del32–71 GH
Intron 3 Cogan et al. (38) II
IVS3+1G>C Heterozygous Skipping of exon 3, del32–71 GH
Intron 3 Binder&Ranke (39) II
IVS3+2T>C Heterozygous Skipping of exon 3, del32–71 GH
Intron 3 Fofanova et al. (40) II
IVS3+5G>A Heterozygous Skipping of exon 3, del32–71 GH
Intron 3 Hayashi et al. (41) II
IVS3+5G>C Heterozygous Skipping of exon 3, del32–71 GH
Intron 3 Hayashi et al. (42) II
IVS3+6T>C Heterozygous Skipping of exon 3, del32–71 GH
Intron 3 Cogan et al. (43) II
IVS3+6T>G Heterozygous Skipping of exon 3, del32–71 GH
Intron 3 Katsumata et al. (44) II
IVS4+1G>C
Homozygous
Loss of amino acids 103-126 in exon 4; frame
shift in exon 5
Intron 4 Cogan et al. (12)
IVS4+1G>T
Homozygous
Loss of amino acids 103-126 in exon 4; frame
shift in exon 5
Intron 4 Phillips & Cogan (2) IB
IVS4+5G>C
Homozygous
Loss of amino acids 103-126 in exon 4; frame
shift in exon 5
Intron 4 Leiberman et al. (45) IB
IVS4 –1G>A Heterozygous No amino acid change; assumed to affect splicing
Intron 4;c.456G>A
Fofanova et al. (46) II
Mutations affecting ISE elements or BPS
IVS3+28– 45del
Heterozygous 18 bp deletion; skipping of exon 3
Intron 3, ISEm2
Cogan et al. (47); McCarthy & Phillips (15)
II
IVS3+56– 77del
Heterozygous removes BPS in intron 3; skipping of exon 3
Intron 3 Vivenza et al. (48) II
IVS3+28G>A Heterozygous Abnormal splicing Intron 3, ISEm1
Cogan et al. (47); McCarthy & Phillips (15)
10
I.2.4 Mutations in GH1 Splicing elements cause IGHD II
Several mutations in GH1 have been reported in IGHDII patients producing increased levels of exon 3 skipped transcripts represents the 17.5 kDa isoform (Table 2). Majority of these mutations are present within the splice sites (3’ and 5’) bordering exon 3 or in cis regulating splicing elements (splicing enhancers). The splice sites flanking exon 3 are particularly weaker than the cryptic splice site present within exon 3. Any disruption in the natural splice sites thereby increases the aberrant splicing and skipping of exon 3(2,36-38,42,49,50). Besides, the mutations identified in ESE1 (E3+1G→T, E3+2A→C, E3+5A→G; Figure 3) and ESE2 (E3+29A→G; Figure 3) affects the splicing enhancer functions and exon 3 definition (14,34,35,47,51). These enhancers activate the 3’ splice sites of intron 2 and inactivate the cryptic splice site and promote the exon 3 inclusion. Two families with mutations in Intron splicing Enhancer (IVS3+28G→A, IVS3+del28-45; Figure 3) were also identified to produce abnormal levels of transcripts encoding the 17.5kDa isoform (15,38). In addition to these, missense mutations at amino acid positions 89(P89V), 110(V110F), 183(R183H) and a 22- bp deletion including the branch point site within intron 3 (IVS3 del+56-77; Figure 3)have also been reported leading to Exon 3 skipping (5,39,48,52). However, splice site mutations which produce 17.5KDa isoforms are understood to cause severe impact on the patients than ESE mutations.
11
Cell culture and transgenic mice experiments have proved that the 17.55 KDa isoform exhibit a dominant negative effect on the secretion of the wild type 22 KDa isoform (25,26,41). This dominant negative isoform is retained in the endoplasmic reticulum and impairs the secretory pathway and trafficking of GH and other hormones (53). Under normal conditions, the 17.5KDa isoforms are targeted by ER and undergoes controlled degradation by proteasomal pathway. When the amount of 17.5KDa exceeds the limit of the proteasome degradation mechanism, it accumulates in the cytoplasm leading to reduced cell proliferation in vitro (16). Moreover, transgenic mice overexpressing the 17.5 KDa isoform exhibited a loss of majority of somatotropes and subsequent defects in the maturation of GH secretory vesicles and anterior pituitary hypoplasia (14,25).
12
I.3 Combined pituitary hormone deficiency (CPHD)
Pituitary development is dependent upon a complex genetic cascade of transcription factors and signaling molecules acting as activators or repressors which dictate organ commitment, cell differentiation and cell proliferation that produces five distinct pituitary cell types (54,55). These cells in the in the pituitary gland are specialized to produce and secrete specific hormones, including growth hormone (GH), prolactin (PRL), thyroid stimulating hormone (TSH), luteinizing hormone (LH), follicle-stimulating hormone (FSH), and adrenocorticotropic hormone (ACTH). Combined Pituitary Hormone Deficiency (CPHD) is diagnosed when the production of GH and one or more of the pituitary hormone is insufficient or absent. The incidence of CPHD is estimated to be approximately 1:8000 births and is usually sporadic but, familial forms have also been described (56). Clinically, CPHD is mainly characterised by short stature, hypothyroidism, impaired sexual development and hypocorticolism. More distinctive facial features with prominent forehead, marked midfacial hypoplasia with depressed nasal bridge, deep-set eyes, short nose with anteverted nostrils and hypoplastic pituitary gland by MRI examination were also have been reported along with growth deficiency (57). Some cases were also presented with mental retardation along with other typical phenotypical features (58).
The aetiology of CPHD is considered to be multifactorial which includes environmental and genetic factors. However, in the majority of cases the aetiology of CPHD cases remains unexplained. So far, the genetic aetiology is explained by the perturbation of expression or function of several developmental genes which are involved in different stages of pituitary development.
13
I.3.1 Pituitary Transcriptional factors associated with CPHD
The identification and characterization of the pituitary developmental factors in vitro and from
animal models has enabled us to clarify a genetic basis for combined pituitary hormone
deficiency (CPHD) in humans (59,60). To date detected genes include PROP1, PIT1 (also named POU1F1), HESX1, LHX3, LHX4, OTX2, GLI2, SOX2, and SOX3 (Table 3). Numerous studies demonstrated that mutations of these transcription factor genes cause a wide range of pituitary phenotypes, from severe life-threatening CPHD to isolated GH deficiency (59-61).
Numerous studies demonstrated that mutations of these transcription factor genes cause a wide range of pituitary phenotypes, from severe life-threatening CPHD to isolated GH deficiency (59-61). Transcriptional factors that are involved in the formation of pituitary primordial structures are not pituitary-specific but also play a role in the development of other organs and structures. Mutations within these “early factors” may present extra-pituitary manifestations: syndromic hypopituitarism with craniofacial defects such as septo-optic dysplasia (SOD) or holoprosencephaly (HPE) in the case of HESX1 or GLI2 mutations respectively. In some instance HESX1 and GLI2 mutations have been found associated to milder phenotypes with pituitary hormone deficiency without a syndromic phenotype (62,63). Other extra-pituitary manifestations such as Chiari malformation, corpus callosum hypoplasia, hearing impairment and skeletal abnormalities are associated with LHX3 and LHX4 mutations (59).
Conversely, PROP1 and PIT1 are homeodomain transcription factors specifically involved in pituitary development. Accordingly, mutations of these later-acting factors, are responsible of a pituitary specific phenotype (59) characterized by multiple hormone deficiencies without relevant extrapituitary findings. The hormonal phenotype in patients with PROP1 mutations is characterized by deficiency of GH, TSH, PRL and gonadotropins with an extremely variable phenotype both within and between families with respect to the severity of hormone deficiency,
14
age of onset, adrenal function and height at diagnosis. In magnetic resonance imaging (MRI) posterior pituitary and infundibulus are normal, while anterior pituitary is often hypoplastic; a hyperplastic expansion of the intermediate lobe that usually involves during the second decade of life has been described (64-66).
PIT1 mutations present a phenotype characterized by profound deficiency of GH and PRL,
variable degree of TSH deficit, severe proportional short stature, a typical facies, feeding difficulties in infancy and variable degree of mental delay. Neuroimaging usually shows a normal or hypoplastic anterior gland and a normal pituitary stalk and posterior pituitary.
In many CPHD patients genetic screening failed to detect mutations within any of these genes whereas in some CPHD cohorts the majority of the tested patients carried mutations, mostly affecting PROP1.
15 Table 3: Mutation frequencies within PROP1, PIT1, HESX1, LHX3, LHX4, and GLI2 in different CPHD cohorts
Gene Geographical origin
Sporadic cases Familial cases
Total mutation rate
(sporadic and familial) Reference Analysed patients, n Patients with
mutation, n (%) Analysed families, n Families with mutation, n (%) PROP1 Italy 118 2 (1.7) 8 1 (12.5) 2.4% Unpublished Lithuania 43 25 (58.1) 11 10 (90.9) 64,8% Navardauskaite et al. (67)
Turkey 51 0 1 1 (100) 1.9% Kandemir et al. (68)
*Japan 77 0 0 - 0 Takagi et al. (69)
*Japan
71 0 0 - 0 Dateki et al. (70)
Germany (mostly)
75 0 1 0 0 de Graaff et al. (71)
Various (UK mostly)
119 1 (0.8) 0 - 0.8% Mehta et al. (72)
*USA 19 0 0 - 0 Diaczok et al. (73)
Brazil 24 0 5 5 (100) 17.2% Vieira et al. (56) Spain 36 0 0 - 0 Coya et al. (74) Various 92 12 (13.2) 17 8 (47) 18.3% Reynaud et al. (75)
Portugal 29 2 (6.9) 7 7 (100) 25% Lemos et al.(76)
Hungary 35 15 (42.8) 0 - 42.8% Halasz et al.(77)
UK
20 0 6 0 0 Rainbow et al.(78)
*Czechia
66 12 (18.2) 4 3 (75) 21.4% Lebl et al. (79)
φ Various (UK minority) 189 2 (1) 25 6 (24) 3.7% Turton et al.(65)
Australia 31 0 1 0 0 McLennan et al.(80)
Korea 12 0 0 - 0 Kim et al.(81) Russia 7 3 (42.9) 4 2 (50) 45.5% Fofanova et al. (82) Various 21 2 (9.5) 10 5 (50) 22.6% Cogan et al.(83)
**Various 0 - 36 18 (50) 50% Deladoey et al.(84)
Total 1135 76 (6.7) 136 66 (48.5) 11.2% PIT1 Italy 24 1 (4.2) 0 - 4.2% Unpublished *Japan 77 1 (1.3) 0 - 1.3% Takagi et al. (69)
*Japan 71 0 0 - 0 Dateki et al. (70)
Germany (mostly) 75 0 1 1 1.3% de Graaff et al. (71)
Various (UK mostly)
55 1 (1.8) 0 - 1.8% Mehta et al. (72)
*USA
19 0 0 - 0 Diaczok et al. (73)
Brazil
5 0 0 - 0 Vieira et al. (56)
Spain 36 0 0 - 0 Coya et al. (74)
Various
13 0 4 1 (25) 5.9% Reynaud et al. (75)
*Czech
66 1 (1.5) 4 0 1.4% Lebl et al. (79)
φ Various (UK mostly) 105 4 (3.8) 17 3 (17.7) 5.7% Turton et al.(65)
UK 20 0 6 2 (33.3) 7.7% Rainbow et al.(78)
Australia 31 2 (6.5) 1 0 6.3% McLennan et al.(80)
Korea
12 0 0 - 0 Kim et al.(81)
Russia
8 0 4 1 (25) 8.3% Fofanova et al. (82)
16 HESX1 Italy 126 1 (0.8) 7 0 0.8% Unpublished *Japan 77 0 0 - 0 Takagi et al. (69) *Japan 71 0 0 - 0 Dateki et al. (70)
Germany (mostly) 75 0 1 0 0 de Graaff et al. (71)
Various (UK mostly)
119 0 0 - 0 Mehta et al. (72) *USA 19 0 0 - 0 Diaczok et al. (73) Brazil 24 0 5 0 0 Vieira et al. (56) Spain 36 2 (5.6) 0 - 5.6% Coya et al. (74)
Various 16 0 0 - 0 Reynaud et al. (75)
*Czechia 66 0 4 0 0 Lebl et al. (79) UK 20 0 6 0 0 Rainbow et al.(78) Korea 12 0 0 - 0 Kim et al.(81) Total 661 3 (0.5) 23 0 0.4% LHX3 Italy 95 0 7 0 0 Unpublished *Japan 77 0 0 - 0 Takagi et al. (69) *Japan 71 0 0 - 0 Dateki et al. (70)
Germany (mostly) 75 0 1 0 0 de Graaff et al. (71)
UK 119 0 0 - 0 Mehta et al. (72) *USA 19 0 0 - 0 Diaczok et al. (73) Brazil 13 0 5 0 0 Vieira et al. (56) * Various 300 2 (0.7) 2 2 (?) 1.3% Pfaeffle et al. (85)
Various 17 0 3 0 0 Reynaud et al. (75)
Korea 12 0 0 - 0 Kim et al.(81) Total 798 2 (0.3) 18 2 (11.1) 0.5% LHX4 Italy 94 0 7 0 0 Unpublished
*Japan 77 2 (2.6) 0 - 2.6% Takagi et al. (69)
*Japan 71 1 (1.4) 0 - 1.4% Dateki et al. (70) Germany (mostly) 75 0 1 0 0 de Graaff et al. (71) UK 119 0 0 - 0 Mehta et al. (72)
Various 126 0 7 2 (28.6) 1.5% Castinetti et al.(86)
* Various 244 2 (0.8) 1 1 (?) 1.2% Pfaeffle et al. (85)
*USA 19 0 0 - 0 Diaczok et al. (73) Brazil 11 0 0 - 0 Vieira et al. (56) Total 916 5 (0.5) 16 3 (18.8) 0.9% GLI2 *Brazil 136 4 (2.9) 0 - 2.9% Franca et al. (87) *Various 165 1 (0.6) 0 - 0.6% Flemming et al. (63) *Japan 77 0 0 - 0 Takagi et al. (69) Total 430 7 (1.6) 0 - 1.6%
* Subjects considered as sporadic if otherwise not specified ** All subjects considered as familial
φ IGHD patients were also considered because it was not possible to obtain the number of CPHD sporadic and familial patient
17
I.3.2 Human GLI2
GLI2 is a member of GLI family of transcription factors along with GLI1 and GLI3 known as Glis super family. These transcription factors are recognized by a conserved DNA binding domain X3-Cys-X4-Cys-X12-His-X4-His-X3, where X is any amino acid. GLI2 is specifically recognized and bind to GAACCACCCA motif in the target genes. GLI2 is a 1586 –aminoacid protein (197 kDa) which is encoded by 13 exons on chromosome 2q14. The functional domains of GLI2 are not yet fully understood. In addition to the central zinc finger DNA binding domain consisting of 5 fingers, GLI2 proteins also contains an amino terminal (N-terminal) repressor domain and carboxyl terminal (C-terminal) transactivation domain. GLI2 protein has been identified to be present in at least four different splice variants, known as α (133kDa), β (131kDa), γ (88 kDa) and δ (86kDa). A human variant lacking the N-terminal repressor domain (GLI2∆N) showed a 30-fold higher activity compared with the full length protein in vitro (Figure 4).
Figure 4: Schematic representation of different domains identified in the human GLI2. GLI2∆N represents the isoform lacking the N-terminal repressor domain (below) compared with the Full length isoform (above).
18
I.3.3 Role of GLI2 in the development of pituitary
GLI2 is an important component in the developmental programs. As an effector molecule of the sonic hedgehog (Shh) signalling pathway, GLI2 has a fundamental role in the pituitary development. Sonic hedgehog is a morphogen expressed in the early steps of pituitary otogenesis by exerting effects on both proliferation and cell-type determination. Sonic
hedgehog is expressed in the ventral diencephalon and throughout the oral ectoderm except
Rathke’s pouch (88,89). However, the patched receptor (PTCH1) as well as the GLI family of transcription factors (GLI1, GLI2 and GLI3) are expressed in the Rathke’s pouch, indicating the developing gland is competent to receive and respond to SHH signalling (90).
There are three different Hedgehog proteins in humans, each with different cellular responses and distribution in the body: Sonic hedgehog (SHH), Indian Hedgehog (IHH) and desert hedgehog (DHH). The Hh pathway is considered as the canonical pathway through which GLI2 activity is regulated (Figure 5). The Hedgehog ligands binds to and activate the transmembrane receptor called patched (PTCH). When the Hh ligand is absent, PTCH exerts a consistent inhibitory effect on transmembrane G-protein coupled receptor smoothened (SMO). When the Hh ligand is present and binds to PTCH, inhibition over SMO is released (91,92). The GLI transcription factors are bound with SuFu which keeps GLI2 tethered in the cytoplasm (93). Activated SMO triggers the dissociation of SuFu/GLI complex and allowing the nuclear translocation and activation of GLI. This translocation promotes the subsequent DNA binding and transcription of a series of Hh pathway target genes (Figure 5).
19 Figure 5: Schematic representation of hedgehog signalling pathway
Multiple studies using knockout mice has been performed to study the importance of GLI2 in development. Mice with homozygous loss of functioning GLI2 resulted in lethal phenotype later in development while the heterozygous mice developed normally. The phenotypic evaluation of abnormalities in the knock out mice showed severe skeletal abnormalities including absence of vertebral body and intervertebral disc, truncated mandibles with absent incisors, shortened limbs and sternum, missing tympanic ring bones of the inner ear and severe cleft palate malformations (90). GLI2 deficient mice also showed defects in the pituitary development including partial loss of anterior and complete loss of posterior pituitary (94,95). These defects were attributed by the loss of expression of GLI2 target genes BMP4 and FGF8 (95).
I.3.4 GLI2 Mutations
A spectrum of disorders and diseases has been described involving the loss of expression and deregulation of GLI2. The loss of function GLI2 mutations are generally responsible for congenital malformations while gain of function in adult cells to tumerogenesis. The status of
20
Apart from Carcinogenesis, Heterozygous GLI2 loss of function mutations were initially reported in patients with holoprocensephaly (HPE), a condition of incomplete or failed forebrain separation, or HPE-like phenotypes with pituitary anomalies and postaxial polydactyly (96,97). Several GLI2 variations were since reported in patients with HPE characterized by a wide spectrum of phenotypes including craniofacial abnormalities, brancial arch anomalies, polydactyly and variable degree of pituitary malformations (98-101). Recently, Franca et al (87,102) reported novel heterozygous frame shift or nonsense GLI2 mutations and high frequency of non-synonymous GLI2 variants in patients with congenital hypopituitarism without HPE and most of these patients presented with CPHD and an ectopic posterior pituitary lobe. These patients were also presented with a wide spectrum of phenotype including polydactyly, hypoglycemia, seizures, midline facial defects and hypoplastic anterior pituitary. More recently, Bear et al (103) reported that individuals with truncating GLI2 mutations were more likely to have typical pituitary anomalies, polydactyly and subtle facial features rather than HPE. These individuals are more likely to have higher penetrance than individuals with missense mutation.
I.4 Idiopathic Short stature
Short stature is a condition where the height of an individual is less than 2 standard deviation (SD) from the mean height, where the normal height is considered within more or less 2 SD, for a given age, sex and population. In most of the cases the aetiology of short stature is unknown and this is referred as Idiopathic Short Stature (ISS) (104,105). Thus, ISS can be defined as a condition in which the height of an individual is more than 2 SD below the corresponding average height for a given age, sex and population with no recognizable endocrine or systemic diseases and no known genetic causes. It has been estimated that around 80% of the short children presented to a paediatric clinic are classified as ISS (105). ISS can be subdivided into Familial Short Stature or FSS (when the height of an individual is below the
21
mean height compared to the reference population but remain within the target height of the family and Non Familial Short Stature) and Non Familial Short Stature or NFSS (when the height of a child is short compared to both reference population and the target height of the family). In FSS children, with the absence of pathological causes of parental shortness, full set of diagnostic screening may not be necessary and they attain their genetic potential. However, if one of the parent is short (<-2 SDS) attention should be given to the possibility of a dominant genetic effect. Similarly, in NFSS children with a positive family history of constitutional delay of growth and puberty (CGDP), and the experienced clinician may follow an expectant course (105).
Thus, ISS is a diagnosis based on careful exclusion of recognizable conditions such as chromosomal abnormalities, dysmorphic syndromes, low birth size (small for gestational age, SGA), systemic, endocrine or nutritional disorders and skeletal dysplasias (104,105). But, how far these criteria should be considered before a condition could be labelled as ISS is still remain to be completely agreed. It is widely considered that analysis to exclude turner syndrome should be done in all females presented with short stature. SHOX is another gene now widely agreed to be screened in the ISS patients. SHOX haploinsufficiency, which is caused by heterozygous mutations or deletion of SHOX or abnormalities of the enhancer region, is reported in 2-15% of children previously diagnosed as ISS (106-110). SHOX screening is also relevant, since GH therapy is reported as an effective treatment of short stature associated with
SHOX defects(111). SHOX defect is now an approved indication for GH treatment in US and
22
I.4.1 SHOX gene
SHOX (short stature homeobox containing gene) was first discovered by deletion mapping of
the short arm of chromosome as a gene responsible for growth failures in idiopathic short stature and Turner Syndrome (TS) patients (108). The gene is located in the pseudoautosomal region 1 (PAR1), a region of 2.6Mb, on the very tip of the short arms of both X and Y chromosomes, Xp22 and Yp11.3 (Figure 6). All characterized genes residing in PAR1 region escapes X inactivation. Because of this, SHOX is expressed on both X and Y chromosomes as two functional copies. PAR1 is a hotspot for recombination events between the X and Y chromosomes during the meiosis pairing of spermatogenesis (112).
The SHOX gene contains two characteristic domains: a homeodomain encoded by the homeobox and an OAR domain (otp, aristaless and rax) at the carboxyl terminal. The homeobox enables specific DNA binding and act as transcriptional activators. This domain is also relevant for nuclear translocation and dimerization of SHOX. The OAR domain is also relevant in keeping transactivation capacity of SHOX.
The SHOX mRNA is encoded by 7 exons (one non-coding and six coding) encompassing about 40 kb of genomic DNA. The homeobox is coded by exons 3 and 4. Two alternative forms of exon 6 (6A and 6B), leads to different spliced transcripts named SHOXa and SHOXb (Figure 6). Both the transcripts are identical at the 5’ end but differ at the 3’ end in exon 6 and are translated into two different proteins of 292 (SHOXa) and 225 (SHOXb) aminoacids.
23 Figure 6: Chromosomal Localisation and genomic structure of SHOX gene
I.4.2 SHOX Protein and Expression
SHOX is a nuclear protein and acts as a transcriptional activator. SHOX is expressed during fetal life in the development of bone tissue in the distal humerus, radius, ulna, wrist, limbs and pharyngeal arches. The SHOX expression is restricted to limbs, first and second pharyngeal arches and it can be detected in osteoblasts of human embryos from the second month post consumption. This expression pattern resembles the locations of the anatomic structures which are affected when the SHOX is deficient such as the forearm, lower legs, maxilla, mandible and the external ear tract (113). The role of SHOX in bone development is also indicated by the finding that SHOX protein is detected in the hypertrophic chondrocytes of the growth plate. The overexpression SHOX causes blockage of the cell cycle with proliferation arrest and apoptosis which indicate the role of SHOX in the processes regulating chondrocytes differentiation (114,115). Even though the highest expression of SHOX is identified in skeletal muscle and bone marrow fibroblasts, SHOXa and SHOXb are independently expressed in a different array of tissues. SHOXa is also expressed in placenta, pancreas and heart while low
24
level of SHOXb expression is also identified in fetal kidney. Natriuretic peptide (NPPB) gene which encode brain natriuretic peptide (BNP) is identified as the first transcriptional target of SHOX. The significance of this finding is still not fully understood (116).
I.4.3 SHOX mutations
The correct SHOX gene function is dosage dependant. The loss-of-function mutation of one
SHOX allele results in haploinsufficiency and the disorder of SHOX deficiency causing growth
failure. The haploinsufficiency of SHOX causes a wide range of short stature phenotypes. The mutations in SHOX were frequently reported as responsible for short stature in patients with Leri-Weill syndrome. The prevalence of SHOX mutations in individuals with Leri-Weill syndrome is estimated around 50- 90% (117-120). The deletion at the end of the short arm of the X chromosome including SHOX gene (loss of one allele) is almost always associated with Turner syndrome (121). The loss of both the SHOX alleles causes the complete lack of SHOX and results in extreme phenotype of osteodysplasia called Langer syndrome (122). A relatively smaller percentage of SHOX mutations were also identified as the cause of growth retardation in 2-15% individuals with ISS (Table 4).
The high frequency of repeats within the PAR1 region make this genomic region highly prone to the recombination and this explains the high frequency of deletions identified in affected individuals. The deletions which encompass SHOX gene itself or the regulatory enhancer regions account for 80% of all the SHOX mutations. The other gene defects found were point mutations which were reported all over the gene, but predominantly in exon 3 and 4 encoding homeodomain. The missense mutations in the homeodomain fundamentally impairs the SHOX key functions such as DNA binding, dimerization and nuclear translocation (123). Partial and complete SHOX duplications of varying sizes were also reported in the short stature patients (124,125).
25 Table 4: Summery of SHOX defects in ISS patients
Study Patients Mutation (%)
Rao et al. (108) 91 1.1 Binder et al. (109) 68 1.5 Musebeck et al.(126) 35 - Rappold et al.(106) 900 2.4 Ezquieta et al.(127) 73 - Stuppia et al.(128) 56 12.4 Binder et al.(129) 140 2 Schneider et al.(130) >1500 2 Huber et al.(110) 84 4.2 Rappold et al.(107) 1534 2.2 Jorge et al.(119) 63 3.2 Chen et al.(117) 735 4.2 Benito-Sanz et al.(124) 613 1 Benito-Sanz et al. (131) 576 1.9 Hirschfeldova et al.(132) 51 13.7 Sandoval et al.(133) 62 8.1
A phenotypic scoring system assisting the identification of the most suitable subjects for the
SHOX genetic testing has been developed by Rappold et al. (107) by integrating clinical and
anthropometric data of the patients. This score combines three anthropometric variables; arm span/height ratio, sitting height/height ratio and BMI with five clinical variables; cubitus valgus, short forearm, bowing of forearm, muscular hypertrophy and dislocation of the ulna at the elbow. Each of these variable represents at least two points in the scoring system. This system recommends SHOX testing in the presence of a score greater than 4 or 7 (increased threshold) out of a total possible score of 24.
26
I.4.4 SHOX Enhancers
Enhancer elements are cis acing regulatory elements located upstream or downstream of an associated gene. When bound by specific transcription factors these elements enhance the transcription of the gene. Enhancers can reside at considerable distance away from the coding parts of the gene and can be the site of mutations in genetic diseases.
Along with comparative genomics and functional analysis, mutational screening in affected individuals demonstrated the presence of multiple evolutionary conserved sequences (ECS) both upstream and downstream of SHOX that have variable effects on transcription (Figure 7). Three conserved non coding elements (CNE4, CNE5 and CNE9) within the downstream enhancer region have been shown transcriptional activity in vitro and or in vivo (117,123,134). The presence of another 3’ enhancer (CNE7) has been recently identified by Benito-Sanz et al.(131) and the in vitro functional analysis using luciferase reporter assay showed its enhancer activity. All these enhancers reside within 250 kb downstream from the start codon. Three Enhancers (CNE-5, CNE-3 and CNE-2; Figure 7) upstream of SHOX within 300kb has also been identified as functionally active (134).
27
Almost all the SHOX deletions/duplications identified were either included whole/partial
SHOX gene or 3’ (downstream) enhancers. The deletions identified in the downstream region
had highly variable in extension and location. Only one case has been reported involving the 5’ (upstream) enhancer region in which two of the three upstream enhancer regions were deleted in a female patient and her father with ISS (135). A deletion within enhancer region could affect transcription simply by the removal of an important regulatory region or indirectly by altering the DNA folding thereby the known regulatory enhancers becomes inaccessible. Partial tandem duplications may affect the gene expression by changing the distance between the coding sequence of the gene and the regulatory elements (131).
Recently, the presence of an additional putative long range regulatory region further downstream of currently known enhancers has been suggested by the deletions identified in individuals with mild phenotypic effect (125,136). This may be more likely due to the presence of one or more additional downstream transcription regulators. A highly conserved transcription factor was also identified within this region and is the most likely candidate for the critical part of these deletions (125).
I.4.5 Phenotypic Variability associated with SHOX mutations
All classes of SHOX mutation are associated with broad phenotypic variability even within families. In the case of the enhancer deletions, they generates a phenotype indistinguishable from that of patients with mutations in the SHOX coding region and the size of the deletion is not considered to be related to the severity of the clinical phenotype (137). Kant et al. (138)reported a case in which an enhancer deletion was associated with normal stature although below target height. In many previous studies on SHOX deficiency, not all index parents had short stature and is not always the leading clinical sign to request a SHOX analysis by clinicians, who consider other clinical characteristics of the patients and the family.
28
29
1. Functional analysis of GH1 mutations identified in Italian IGHD patients.
The exon 3 GH1 contains two known exon splicing enhancers (ESEs) which are necessary for the correct splicing. The aim of this study was to perform functional analysis on the novel point mutations identified in exon3 outside of known ESEs to determine their involvement in splicing.
2. Screening of GLI2 gene in CPHD patients
The involvement of GLI2 gene in the aetiology of CPHD has been recently identified. The aim of this study was to determine the frequency of GLI2 mutations in a cohort of Italian CPHD patients that resulted negative for mutations in other causative genes encoding pituitary transcription factors (PIT1, PROP1, HEXS1, LHX3 and LHX4). 3. Screening of SHOX gene in Idiopathic Short Stature patients
SHOX mutations are the most frequent monogenic defects identified in idiopathic short
stature patients. The aim of this study was to screen for the SHOX deletions, duplications and point mutations in large cohort of ISS patients and to establish a phenotype-genotype correlation in patients carrying mutations, in order to identify new criteria for patient selection.
30
31
III.1 IGHD Cohort
A total of 103 sporadic patients with IGHD and 205 normal stature individuals, all belonging to the Italian population, were included in the genetic analysis. The subjects were referred to the clinical centers because they had a height less than or equal to -2 SDS (Standard Deviation Score) or a height less than or equal to -1.8 SDS in combination with a height velocity over 1 year less than -1.5 SDS using the criteria of Tanner-Whitehouse(139). Patients with a known postnatal cause of acquired hypopituitarism were excluded. Skeletal maturation was estimated as bone age (radius, ulna and short bone) with the TW2 (Tanner –Whitehouse 2nd edition) method by a pediatric endocrinologist (140). They were all evaluated for GH serum levels after two provocative tests (with arginine or clonidine or insulin or glucagon or with GHRH+arginine (141). Traditionally, a diagnosis of GH deficiency (GHD) is supported by GH peaks less than 10 ng/ml both after the two different stimuli (142), or less than 20 ng/ml after the double provocative test with GHRH + arginine. The GHD patients futfill these criteria and had a mean (±SD) secretion peak of 4.4 ± 2.5 ng/ml after the classical stimuli (N=78) or 9.4 ± 5.8 ng/ml after the test with GHRH+arginine (N=25). None of the GHD patients was deficient for other pituitary hormones and none had a documented family history of the disease or consanguineous parents. All the patients have been also screened for mutations in GHRHR (data not shown). Patients carrying mutations in this gene were not included in the IGHD cohort described here. Normal stature controls included University and Hospital staff, as well as medical students who were not tested for GH secretion levels. A written informed consent was obtained from the patient’s parents, as they were all aged less than 18 and from the normal stature controls.
32
III.2 CPHD Cohort
The CPHD patients were recruited based on the following criteria:1) they presented with a clinical and hormonal evidence of childhood-onset GH deficiency combined with at least one other pituitary defect in the absence of an identified cause of hypopituitarism (e.g. cerebral tumors, cranial trauma, documented asphyxia, or other injuries at delivery), 2) they had a negative family history for pituitary dysfunction or apparent or declared consanguinity and were thus considered as sporadic cases, and 3) mutations in the coding sequences of genes associated with multiple pituitary hormone dysfunctions (PIT1, PROP1, HEXS1, LHX3, and LHX4) were excluded (data not shown). Mean height SDS for chronological age was calculated using the criteria of Tanner-Whitehouse(140). The mean height of the patients at diagnosis was −2.26 SDS ± 2.3 sd. Morphological evaluation of the hypothalamus-pituitary area and/or of the central nervous system was performed in 136 patients by magnetic resonance imaging, using precontrast coronal spin echo T1-weighted images followed by postgadolinium T1-weighted imaging. Among the 136 CPHD index cases, 8 (5.8%) were the probands of pedigrees with more than one affected individual (familial cases). Four patients were born from consanguineous parents but they were considered as sporadic cases since they were the only affected subject in their families. The mean height of these patients at diagnosis was -2.81 ± 1.83 SDS and the mean delay in bone age relative to chronological age was 2.57± 2.36 years. GHD was present in all the patients, TSH deficiency in 78.6% (107/136) and ACTH deficiency in 61% (83/136). Thirty-nine subjects were prepubertal at the time of diagnosis. Among the remaining 97 subjects that could be evaluated in terms of pubertal age, 81 (83.5%) presented with FSH/LH deficiencies. Eight male patients presented neonatal micropenis and/or cryptorchidism. Five patients (3.5%) had diabetes insipidus. We obtained MRI data from 101 patients (74% of the total). Among these, abnormalities (ectopy of the neurohypophysis, pituitary hypoplasia and empty sella) were found in 81 (80%) subjects; in particular anterior
33
pituitary hypoplasia or aplasia was the most frequent abnormality and was present in 61 patients (60.4%), while pituitary stalk interruption and/or neuropituitary ectopia were observed in 35 patients (34.6%), 16 of them presenting both abnormalities. Eleven patients (10.8%) presented also extra-pituitary abnormalities such as SOD, other midline defects or cerebellar abnormalities.
Patients or parents of the patients under 18 years of age gave their written informed consent to participate to this study, which was approved by the local ethical committee of each contributing auxological center.
III.3 ISS Cohort
Two hundred and ninety ISS patients with growth failure of varying severity were screened for
SHOX abnormalities. The mean height SDS of the cohort was -1.8±0.9. The patients were
generally selected with a height <-2SDS or with growth velocity of <-2SDS. Some patients with >-2SDS were also considered based on other clinical characteristics. The detailed description of the ISS patients selected for this study are shown in table 5. Patients with recognizable conditions such as chromosomal abnormalities, dysmorphic syndromes, low birth size (small for gestational age), systemic, endocrine or nutritional disorders and skeletal dysplasias were excluded from this analysis.
Table 5: Clinical characteristics of the ISS patients screened for SHOX defects.
Mean ± SD Females (n=149) Male (n=140) Age at Diagnosis 8.1±3.73 9.2±4.08 Height SDS -1.9±0.79 -1.8±0.97 Growth Velocity -1.2±1.75 -0.9±2.1 Target SDS -0.8±1.07 -1±0.95 BMI 16.5±1.75 16.8±3.35
34
35
IV.1 Hormonal investigations
Hormonal assays were performed using several commercial kits and results of biochemical investigations at diagnosis were recorded including basal free T4, TSH, cortisol, and ACTH levels and basal and peak levels of GH, TSH, LH, FSH, and cortisol in response to pituitary stimulation tests. GH deficiency was diagnosed in the presence of low-normal IGF-I levels according to sex and age cutoffs and impaired response to two consecutive classical provocative tests (with arginine or clonidine or insulin; GH peaks <10 ng/ml) or one double stimulus with GHRH + arginine (GH peaks <20 ng/ml)(141). A diagnosis of TSH deficiency was made if serum free T4concentration was under the normal cutoff level(<10 pmol/liter) with normal or low TSH levels. ACTH deficiency, in presence of low or normal ACTH levels, was suspected when fasting morning serum cortisol was less than 193 nmol/liter and was confirmed by an impaired response to the 1-μg tetracosactide or insulin tolerance test (<497 nmol/liter). Gonadotroph axis was investigated only in patients of postpubertal age. FSH-LH deficiency was diagnosed on the basis of delayed or absent pubertal development and no increase in serum FSH and LH in response to the GHRH test.
IV.2 Genomic DNA extraction
Genomic DNA was extracted from whole blood samples using either the salting out method based on Miller et al. (143) or QIAGEN blood mini kit according to the manufactures instructions.
IV.3 Polymerase Chain Reaction (PCR)
Standard PCR reactions were performed using Taq Polymerase (Promega) for the amplification of the genomic DNA for the sequencing analysis of GH1, GLI2 and SHOX. For the screening of GH1, Genomic DNA was initially amplified by PCR using a proof reading Taq polymerase (Finnzymes). The primers (Appendix 1) were designed specifically for the GH1 gene and do
36
not amplify other genes in the cluster The resulting 2.7 Kb product, including the whole GH1, was used as template for a series of nested PCRs using internal primers for the proximal promoter, five exons, four introns and the untranslated regions of the GH1.
A standard reaction was carried out using relevant primers (sequence showed in appendix 1), dNTPs, Taq Polymerase and 5x Buffer (Promega). The final volume of PCR reactions were 25µl unless otherwise specified. The reactions were set up as follows:
Table 6: PCR conditions for Taq Polymerase
Cycling Parameters used were: denaturation at 94°C for 2 min, 30cycles consisting of 30s denaturation at 94°C, 30s annealing at 55-58°c (optimized passed on the primers ) and 30s extension at 72°c, followed by a final extension at 72°C for 10 min.
Reagents Concentration Reaction Mix Initial Concentration Final Concentration
Go Taq® Flexi Buffer 5X 1X 5 µl
MgCl2 25 mM 1,5 mM 1,5 µl
dNTPs 2,5 mM 0,2 mM 2 µl
Primers F+R 10 pmol/µl 0,4 pmol/µl 1 µl
Go Taq® (Promega) 5 U/µl 0,02 U/µl 0.1 µl
DNA 25 ng/µl 50 ng 2 µl
H2O - - 13,4 µl
37
The Reactions using proof reading Taq polymerase were set up as follows:
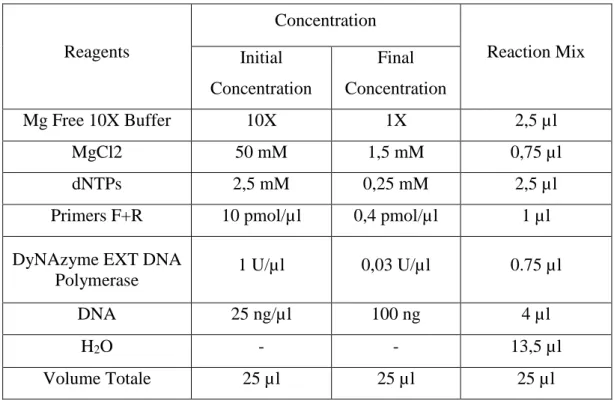
Table 7: PCR conditions for DyNAzyme EXT DNA Polymerase
Cycling conditions used were: denaturation at 94°C for 2 min, 30cycles consisting of 30s denaturation at94°C, 30s annealing at 58°c and 3min extension at 72°c, followed by a final extension at 72°C for 10 min.
After the reaction all the PCR products were visualized on a 2% agarose gel and purified using ExoSAP-IT enzymatic PCR clean up system (Affymetrix).
IV.4 Sequencing
The purified products were directly sequenced in the forward or reverse direction with Big Dye Terminator kit (Applied Biosystems) and analyzed on an ABI PRISM 3100 Genetic Analyzer (Applied Biosystems).
Reagents Concentration Reaction Mix Initial Concentration Final Concentration Mg Free 10X Buffer 10X 1X 2,5 µl MgCl2 50 mM 1,5 mM 0,75 µl dNTPs 2,5 mM 0,25 mM 2,5 µl
Primers F+R 10 pmol/µl 0,4 pmol/µl 1 µl
DyNAzyme EXT DNA
Polymerase 1 U/µl 0,03 U/µl 0.75 µl
DNA 25 ng/µl 100 ng 4 µl
H2O - - 13,5 µl
38
The sequencing Reactions were set up as follows: 2 µL of purified PCR product
1 µL primer (3.2 µM)
1 µL Big Dye terminator mix 6 µL H2O
Cycling conditions used were: 25cycles consisting of 15s denaturation at96°C, 05s annealing at 50°c and 4 minutes extension at 60°c.
IV.5 T/A cloning
T/A cloning (Thermo Scientific InsTAclone PCR cloning kit) has been performed to understand whether the double mutations were in the compound heterozygous state. The PCR products containing the variations in the heterozygous state were cloned into the plasmid vector pTZ57R/T (Appendix 3) using the InsTAclone PCR cloning kit (Fermentas) and the two alleles were separately sequenced.
IV.6 Site-directed mutagenesis
The 2.7-kb fragment containing GH1 was inserted into the pcDNA 3.1(+) expression vector (Appendix 3). The constructs bearing the single variants, namely 246C, 255A, 261T, and 272T, and the variants combined as in the patients, namely 261T/272T (patient 1) and 255A/261T (patient 2), were generated from the GH(wt)-pcDNA 3.1 plasmid by the QuikChange Site-Directed Mutagenesis kit from Stratagene using mismatch complementary primers (Appendix 1) containing the desired mutations. Reaction mixtures were denatured at 940C for 5 minutes, cycled 25 times at 940C for 15 sec, 580C for 1 min, 680C for 8 minutes.
The reaction was set up as follows:
Buffer (10X) 5µl
Primer 1 (100ng/µl) 1.25 µl (100ng/µl)