Department of Psychology
International Doctor of Philosophy course in Psychology and Social Neuroscience
XXXII cycle
Towards real world neuroscience: the impact of virtual and augmented
reality techniques on the study of human performance and sense of
presence.
FINAL DISSERTATION
Candidate
Dott. Matteo Marucci
Supervisor: Reviewers:
Prof.ssa Viviana Betti Prof.ssa Sara Bagassi Prof. Pietro Cipresso
2
Table of Contents
Preface ... 3
1. INTRODUCTION ... 4
1.1 Grounded Cognition and Virtual reality: Towards real world neuroscience ... 4
1.2 Virtual Reality ... 6
1.3 Augmented Reality ... 11
1.4 Aims ... 13
2. STUDY 1 - Multisensory Integration and Perceptual Load: The Impact on Performances, Workload and Presence in Virtual Reality. ... 15
2.1 Abstract ... 15
2.2 Introduction ... 16
2.3 Materials and methods... 18
2.4 Results ... 30
2.5 Discussion ... 35
2.6 Conclusion ... 41
3. STUDY 2 - Human-machine interaction assessment by neurophysiological measures: a study on professional air traffic controllers using Augmented reality ... 43
3.1 Abstract ... 43
3.2 Introduction ... 44
3.3 Material and Methods ... 45
3.4 RESULTS ... 50
3.5 DISCUSSIONS ... 52
4. STUDY 3 - How Neurophysiological Measures Can be Used to Enhance the Evaluation of Augmented Reality based Remote Tower Solutions... 53
4.1 Introduction ... 53
4.2 Materials and Methods ... 57
4.3 Results ... 74 4.4 Discussion ... 81 4.5 Conclusion ... 84 5. GENERAL CONCLUSION ... 85 5.1 Future Directions ... 87 6. ACKNOWLEDGEMENTS ... 91 7. BIBLIOGRAPHY ... 92
3
Preface
Virtual and Augmented reality systems are rapidly evolving. Their technical development is accompanied by a spreading of applications in fields such as architecture, design, digital marketing, education, entertainment, gaming, robotics, fine arts, military and medicine training, engineering and research. Those tools, requiring 8 years ago investment in the order of tens of thousands of US dollars (Bohil, Alicea, & Biocca, 2011) can boast nowadays easier economical accessibility and predicted market size in the next 5 years ranging from 50 to 300 billion (summary of sources). Having regard to the forthcoming large-scale adoption, it is beyond necessary, from a neuroscientific perspective, to investigate the impact of VR and AR technology on human cognition and performance. Therefore, monitoring the interplay between these devices and our brain dynamics in the short and long term and across their development leaps will be crucial to ensure their correct and safe usage in research and beyond. This could pave the way to new research paradigms and commercial applications, granting users the right experience for their needs whether they will need to train for a complex surgical intervention along with an artificial agent or just get the maximum excitement from an immersive sensorial journey. The first introductory chapter will discuss the contribution of virtual and augmented reality as tools for the study of human cognition and performance and the need, arising from an "embodied" vision of cognition, for a transition towards experimental paradigms that allow neuroscientist to study subjects that interact in a realistic environment through spontaneous and natural actions.
4
1. INTRODUCTION
1.1 Grounded Cognition and Virtual reality: Towards real-world neuroscience
Over the last few decades, in the field of neuroscience, the empirical research related to the theoretical framework of Grounded Cognition (Barsalou, 2008) has been expanded. This approach, diametrically opposed to Cartesian dualism, is in stark contrast to the representational and computational theories that dominated the panorama of cognitive psychology from the 1950s to the 1980s (Fodor, 1983; Pylyshyn, 1984) and rejects their conception of the mind as a computer software based on amodal mental representations. On the contrary, the theoretical proposal of Grounded Cognition emphasizes the causal and constitutive role of the sensorimotor system and the interaction with the physical and social environment in the development of cognitive processes and human behavior. A fundamental impulse for the diffusion of GC theories in the psychological and neuroscientific panorama and in particular in the development of theories on social cognition came from the discovery of the mirror neuron system. Originally identified in the premotor cortex of macaques while observing an experimenter grasping food (Gallese, Fadiga, Fogassi, & Rizzolatti, 1996; Rizzolatti & Craighero, 2007; Rizzolatti, Fadiga, Gallese, & Fogassi, 1996), this system is also present in humans and consists of a neuronal population extended to different brain areas (Rizzolatti & Craighero, 2004). This network is able to activate itself, even if with different intensity (Rochat et al., 2010), both after the production and compared to the mere observation of action. Following its discovery, some studies have shown that the activity of a part of this network is also involved in understanding the intentions that motivate the perceived action (Iacoboni et al., 2005) and constitutes also the neurophysiological mechanism behind the prediction of the purpose of an action (Fogassi et al., 2005). In other words, the sensorimotor system is able, through a simulation of the observed action (mirror neurons) and according to the properties of the objects (canonical neurons) with which it
5 interacts (Murata et al., 1997; Sakata, Taira, Murata, & Mine, 1995) to make inferences about the purpose of a movement (Kohler et al., 2002) and its possible outcome. This mechanism is not only valid for actions, but we are also witnessing an internal simulation of the bodily state and emotions of the agent observed. From this point of view, watching facial expressions that encode a certain emotion produces in the observer the activation of the same brain areas of those involved in the first person (Wicker et al., 2003). The circuits of mirror neurons would, therefore, allow us to put ourselves in the shoes of the other not only on the motor plane but also on the emotional one in a vision that Gallese defines as "embodied simulation" (Gallese, 2005). According to the author, this mechanism is the basis of the intersubjective relationship and makes it possible for two individuals to find in the other the relationship of similarity that Stein defines as empathy (W. Stein, 2012). The results of the scientific resonance that this discovery has constituted, extend even further (e.g. cognitive development and autism), nevertheless, its greatest contribution has certainly been to shift the attention of the scientific community, involved in the study of cognition, towards the body and motor domain. To date, this vision of cognition, as grounded to the opportunities offered by the physical, perceptual and motor characteristics of the human body to interact with the environment and other agents, has numerous theoretical declinations (e.g., embodied, extended, enacted and situated cognition) that are characterized by the weight attributed respectively to the body or the environment in shaping our cerebral architecture (Barsalou, 2008; Clark & Chalmers, 1998; Noë & Noë, 2004; Wilson, 2002). These approaches, though relatively distant on some positions, are united by the need that a study of cognition concretely placed in the domain of action, perception and interaction poses: the need to study the brain in a context as natural as possible.
From this perspective, we will understand the importance of virtual and augmented reality technology in the implementation of paradigms of "real-world neuroscience" that investigate the brain in its natural habitat, the realistic interaction.
6
1.2 Virtual Reality
The term virtual reality (VR) refers to a computer-generated environment (Parsons, Gaggioli, & Riva, 2017), that aims to achieve a realistic sensory substitution. The goal of an ideal VR setup, in fact, is to immerse the user in a virtual scenario that, through the concurrent stimulation of multiple sensory channels, will result in an artificial experience almost indistinguishable from reality. The state of the art in virtual reality is represented by Head-Mounted Displays (HMD). Although also other technology can be used to render virtual 3d environments, like a CAVE (CAVE Automatic Virtual Environment) system (Cruz-Neira, Sandin, & DeFanti, 1993), using projectors and 3d glasses, their price and maintenance costs are usually sufficient reasons to opt for a more portable and less expensive solution, like a helmet.
Modern head-mounted displays have built-in audio devices, internal tracking sensors and external cameras that track the helmet and the controllers in space. Additionally, In the last
Figure 1 | A) HTC Vive eye pro helmet with depth cameras and eye tracking. B) Cave apparatus employing mirrors, projectors and special 3d googles to give the user the illusion of a 3d space.
7 decade more and more companies appearing on the market are developing virtual reality control systems such as gloves and suites with haptic and force feedback. Nowadays the creation of virtual experience is becoming increasingly simpler. A virtual world, in fact, can be easily generated with little expertise using free software usually employed in the gaming industry (e.g., Unity3d or Unreal Engine) and free 3d models found on online repositories.
1.2.1 Virtual Reality helmets
Another, more technical, definition (Cruz-Neira et al., 1993), sees VR as a system capable of providing real-time viewer-centered head tracking perspective with a large field of view, interactive control, and binocular display. Inside modern helmets, an Inertial Measurement Unit (IMU) is usually found. The IMU is fundamental for head tracking and relies on an accelerometer and a gyroscope to give the user 6 degrees of freedom tracking in the virtual space. The field of view is defined as the total angular size of the image visible to both the eyes. On average, the human vertical FOV is approximately 130 degrees, while the horizontal binocular FOV is 200, out of which 120 degrees is a binocular overlap( The binocular overlap is especially important for stereopsis). One of the latest VR Headsets of the market (www.Pimax.com) sports a FOVof 200 degrees and a resolution up to 3840x2160x2. Using a binocular display, each eye gets a separate image creating a stereoscopic view. These display types provide the most depth cues and a sense of immersion however, they are the heaviest, most complex and computationally intensive displays. For this reason, only recently we are seeing on the market, standalone Head-Mounted Displays (HMD) that don’t need a computer and its powerful GPU to render the stereoscopic images. A VR HMD is defined as fully immersive as it completely blocks the user’s view of the outside world.
8
1.2.2 Presence and immersion in VR
The use of virtual reality is spreading at great speed in research fields such as psychology and cognitive neuroscience. This diffusion can be understood by analyzing the possibility that this technique offers in the design of experimental paradigms that are both realistic (Meehan, Insko, Whitton, & Brooks Jr, 2002) and controlled at the same time. Through a computer
programmed simulation, then projected into a helmet for virtual reality, it is possible to immerse an individual in contexts simulated at the detail level. On the contrary, is possible
to create situations where the laws of physics are distorted. For example, Mast and Oman (Mast & Oman, 2004) employed a virtual reality paradigm to explore the illusions of visual reorientation. This phenomenon is experienced by astronauts when the perceived identity of a surface change due to the rotation of the entire field of view. This is hard to replicate in real life, as we are usually immersed in visual cues in our environment that help us to navigate. In both cases VR allows scientists to draw behavioral information or gather physiological data while participants watch move and interact in a much more ecological condition than a task performed in a laboratory setting. Often, in fact, in cognitive, affective or even in social
Figure 2 | A setup similar to that used by Meehan and colleagues (2002) can be taken as an example of ecological,
9 neuroscience subjects are evaluated while pushing keyboard buttons in front of a screen in a dark room.
Among the characteristics that oriented researchers towards VR, one cannot avoid mentioning the two constructs that have most contributed to act as a bridge to neuroscience, namely immersion (Mel Slater, 1999), and the sense of presence. The first term refers to the degree of sensory fidelity achieved by the technological setup (Mel Slater, Brogni, & Steed, 2003) and is fundamental to evoke the illusion of being present in the virtual world (Cummings & Bailenson, 2015). One need only to consider the technological extent reached during the last 5 years by VR devices in domains such as field of view (from 90° to 200°), display resolution (from 1280 x 800 to 3840 x 2160), pixel density (from 215 PPI to 800) and refresh rate (from 60 to 120 HZ) to grasp the pace of technological progress and the consequent immersion provided.
The sense of presence, on the other hand, is the illusion that between the user and his experience there is no mediation (Lombard & Ditton, 1997) of an artificial screen, so he "feels there".
Slater (M. Slater, 2018) defines it as a perceptual but non-cognitive illusion, in which the perceptual system, for example, identifies a threat (the virtual precipice) and the brain-body system reacts automatically and rapidly (this is the safest thing to do), while the cognitive system activates relatively later and concludes "But I know this is not real". Certainly, this illusion can arise in very different contexts due to its intrinsically multidimensional nature (Kalawsky, 2000). However, only a paucity of studies has investigated directly the impact of multisensory stimulation on the sense of presence (Cooper et al., 2018; Dinh, Walker, Hodges, Chang, & Kobayashi, 1999; Hendrix & Barfield, 1996). Nevertheless, interconnected cognitive and psychological factors such as the involvement in the digital experience or the sense of agency and ownership experienced towards a virtual body can play an important role in shaping the sense of perceived presence (Skarbez, Brooks, & Whitton, 2017).
10
1.2.3 Body and Visual Perception in VR
The sense of ownership (Gallagher, 2000), refers to the feeling of belonging that we perceive with respect to our body or its parts, while agency (Haggard & Chambon, 2012) refers to the experience of control that we experience in relation to an action. Ownership and Agency are both concepts that relate to the theoretical domain of Embodiment, or "Incorporation". In this field, numerous evidences, have shown how it is possible to induce in experimental subjects a sense of incorporation towards a virtual avatar (IJsselsteijn, de Kort, & Haans, 2006) following the multisensory approach used by Botvinick & Cohen to obtain the famous "rubber hand illusion" (Botvinick & Cohen, 1998). Virtual reality, for his multimodal nature, is the ideal tool to carry out multisensory induced illusions through the use of body manipulation techniques (V. Petkova & Ehrsson, 2008; Mel Slater, Pérez Marcos, Ehrsson, & Sanchez-Vives, 2009; Mel Slater, Spanlang, Sanchez-Vives, & Blanke, 2010). One the other hand virtual reality gave precious insight also in the field of space perception. For example, using an immersive environment researcher can study the interplay between movement and illusions investigated only in stationary situations, such as change blindness (Bruder, Wieland, Bolte, Lappe, & Steinicke, 2013) automaticity and inattention blindness (Suma, Clark, Finkelstein, & Wartell, 2010). Additionally, VR enables a concurrent and precise control of the photometric relationship of the environment and the stimuli position and orientation. This measure prevents light from bouncing from environmental surfaces from interfering with phenomenon like the Simultaneous Lightness Contrast (SLC)(Soranzo, Lugrin, & Wilson, 2013).
11
1.2.4 Performance and Workload in VR
Despite a pervasive belief that the sense of presence is causally related to performance (Mel Slater, Linakis, Usoh, & Kooper, 1996; Witmer, Jerome, & Singer, 2005), there is no solid evidence to support this statement. While researchers have recently started to point to a significant correlation between the two factors (i.e. presence and performance(Cooper et al., 2018; Ma & Kaber, 2006; Stevens & Kincaid, 2015), however, as stated by Nash and colleagues (Nash, Edwards, Thompson, & Barfield, 2000), one could argue that the relation between a construct like presence and a measured variable like performance, is easily influenced by external factors and thus is not always easy to draw conclusions. In fact, even when a correlation between the sense of presence and participants’ performances is found, it is important to mention that it could be a result worth analysing considering also the cognitive resources depleted in the process. It is easy to imagine, how the same performance achieved in a task could be still obtained at the expenses of a very different mental cost, also depending on the amount of data the brain has to process. Indeed, in operational contexts where the goal of a virtual reality application is not related to mere entertainment, then it is crucial to monitor the workload experienced by the user, even regardless of the performances.
1.3 Augmented Reality
In Augmented Reality (AR) we can witness an enrichment of the information at our disposal thanks to digital data displayed on a virtual layer or spatialized sounds in the environment. Within an AR system, the virtual content is arranged in real-time (Azuma et al., 2001) around users in the same spatial coordinates as the physical objects they have around them and is possible to employ techniques of interaction that simulate those between the physical world and objects (e.g., move, grab and leave). According to Milgram et al. (Milgram, Takemura,
12 Utsumi, & Kishino, 1995), AR places between reality (real environment) and virtuality (virtual environment) on the reality-virtuality continuum. While this definition can refer to the enrichment of reality through the five senses, it is often used to indicate only the visual domain. Most of AR technology can be an Optical see-through or Video see-through (Bimber & Raskar, 2006). In Optical see-through glasses, the user views reality directly through optical elements such as holographic waveguides and other systems that enable graphical overlay on the real world. Microsoft’s Hololens, Magic Leap One and the Google Glass are recent examples of optical see-through smart glasses, however, AR applications can be easily programmed using the camera of a modern smartphone, also known as HandHeld Augmented Reality. Using a Video see-through instead, the user views reality that is first captured by one or two cameras mounted on the display. These camera views are then combined with computer-generated imagery for the user to see. The HTC Vive VR headset (Fig. 1), for example, has an inbuilt pair of cameras which is often used for creating AR experiences on the device
.
The sensory element superimposed on the reality can have an additive role, namely, to provide additional details, or subtractive, and act as a filter or a mask. The virtual elements can partially or completely overlap with the original view of an object. In augmented reality based on overlapping, object recognition plays a fundamental role because the application cannot replace the original view if it is unable to determine coordinates and boundaries. An example of augmented reality overlap could be as follows: by downloading an application and scanning the selected pages in a printed or digital catalog, users can visualize virtual furniture in their apartment. Augmented reality, unlike VR, requires that the viewer has an immersive experience in a concrete context, altering the perception of the environment through superimposed, visual, auditory or tactile elements but without losing the feeling of being in a physically real context. Nevertheless, as seen for VR environments in the previous paragraphs, also in augmented reality a realistic virtual environment can elicit a sense of presence (Juan et al., 2006). Additionally, augmented reality systems can be triggered using a marker as well as by GPS coordinates or by sound detection. For example,13 Marker-based augmented reality employs image recognition using a camera and a visual marker, such as a QR code, to produce a 3D output only when the marker is detected. As noted by Cipresso and colleagues (Cipresso, Chicchi Giglioli, Alcañiz Raya, & Riva, 2018), despite AR recent appearance in applied context, given its technological immaturity, its technology contribution is already being explored in many fields such as surgery (Ha & Hong, 2016; Thomas, 2016), Architecture (Lin and Hsu, 2017), maintenance (Palmarini, Erkoyuncu, Roy, & Torabmostaedi, 2018), education ( Bacca et al., 2014) and air traffic control (P. Aricò et al., 2018; Bagassi, De Crescenzio, Lucchi, & Masotti, 2016).
1.4 Aims
The present work explored experimentally the contribution of multimodal VR and AR systems both in a laboratory environment and in an applied context.
The first study will explore the usage of virtual reality in combination with EEG to investigate the dynamics of multisensory stimuli combinations and perceptual load on human workload and performance. Multisensory integration effects on attention, in fact, have traditionally been studied in a laboratory environment, far from our everyday multimodal experience. This work instead, researched whether a virtual immersive system can reproduce previous findings under more ecological circumstances. Therefore, we asked subjects to drive on a virtual racetrack using pedals and a real steering wheel with the goal of collecting 3D targets appearing on the road. They were cued by auditory, vibrotactile or both signals, in two different conditions of multimodal perceptual load: Low and High. In addition to assessing their performance, we collected subjective ratings on workload and the sense of presence derived by the virtual experience. Furthermore, we recorded skin conductance and electroencephalography to select the spectral features related to the workload.
In the second and third studies (chapters 3 and 4) through an augmented reality setup, we investigated the contribution of an extra layer of information applied to a real-world context
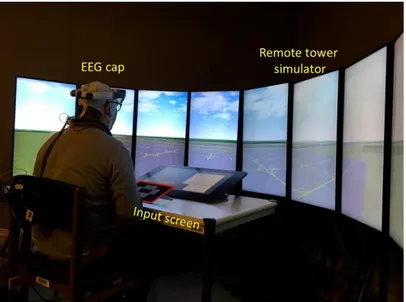
14 such as the air traffic control domain, in combination with electrophysiological measures. The project had the specific aim to evaluate, through neurophysiological measures, the impact of a novel solution such as a remote air traffic control tower. In order to improve cost-efficiency in air traffic provision, in fact, many countries are currently considering the remote tower air traffic control. The general idea is that in the future, the air traffic controller (ATCO) will no more need to be present in the actual control tower, but he will be able to operate from another location. With respect to standard control towers, this new solution will allow monitoring the traffic in small airports thanks to high-resolution cameras, advanced sensors and radio transmissions.
15
2. STUDY 1 - Multisensory Integration and Perceptual Load: The Impact
on Performances, Workload, and Presence in Virtual Reality.
2.1 Abstract
Evidence indicates that multisensory integration, although subject to perceptual load modulation, enhances attentional capture. This effect, however, has always been investigated in front of a screen, far from our everyday multimodal experience. Since virtual reality can help scientists to bridge the gap between experimental control and ecological validity, we devised an immersive driving task in combination with electroencephalography to investigate
the dynamics of multimodal cueing and multisensory load modulation on attention, mental workload, and presence. Subjects drove on the virtual track collecting 3D targets appearing
on the road, cued by auditory, vibrotactile or both signals, in two different conditions of multimodal perceptual load: Low and High. We assessed their performance and recorded skin conductance and electroencephalography to select the spectral features related to their workload. Furthermore, we collected subjective ratings on the workload and the sense of presence derived from the virtual experience. In the High load task, we found higher performances associated with the bimodal and trimodal stimulations and an increase in the presence and in the GSR. In the trimodal condition (Visual-Audio-Vibrotactile) participants felt an overall increase in the sense of presence and a decrease in workload, both subjective and EEG based, regardless of the load.
16
2.2 Introduction
Although the visual channel is the major source of information on which we rely to navigate in the external environment, natural stimuli are typically multimodal.
The process through which the brain combines information from independent, but temporally aligned, signals derived from multiple sensory sources (e.g., vision, audition)(L. E. Miller, Longo, & Saygin, 2017; Barry E. Stein, Stanford, & Rowland, 2014) into a coherent representation is termed multisensory integration. The spatiotemporal concordance of visual and auditory signals derived by this integration is known to enhance neuronal responses (Meredith & Stein, 1983; R. L. Miller, Pluta, Stein, & Rowland, 2015; Barry E Stein & Meredith, 1993), BOLD signal (Stevenson, Geoghegan, & James, 2007) and ERPs activity (Talsma, Doty, & Woldorff, 2007). This enhanced activation is also reflected at the behavioral level. For instance, multimodal stimuli induce faster and more accurate responses than the summed probability of two unisensory stimuli (Lunn, Sjoblom, Ward, Soto-Faraco, & Forster, 2019; Pannunzi et al., 2015)Also, multisensory cues reduce visual search latencies, not only when spatially informative and colocalized with visual targets (Ngo & Spence, 2010; Charles Spence, Pavani, & Driver, 2000), but also when task-irrelevant or uninformative (Matusz & Eimer, 2011; Van der Burg, Olivers, Bronkhorst, & Theeuwes, 2008). Benefits from multisensory stimuli are also found at a perceptive level. A broad-band auditory stimulus significantly enhances the perceived intensity of a visual stimulus (Barry E. Stein, London, Wilkinson, & Price, 1996) also, task-irrelevant tactile stimulations increase auditory intensity ratings (Gillmeister & Eimer, 2007). However, evidence shows that the facilitation effects of the multisensory integration seem to partially rely on the stimuli to be attended (Talsma et al., 2007).
When evaluating whether multisensory integration can modulate exogenous orienting mechanisms, an important role is played by the perceptual/attentional load (N. Lavie, Hirst, de Fockert, & Viding, 2004; Santangelo & Spence, 2007). In fact, during a
17 peripheral spatial cueing task the subjects’ performance is not particularly benefitting from multisensory integration, compared to the unisensory stimulation. By contrast, under a condition of concurrent visual perceptual load (e.g. Rapid Sequential Visual Presentation task - RSVP) the effectiveness of multimodal stimuli improved in enhancing subjects’ performance, compared to unisensory signals (Santangelo & Spence, 2007). However, a limit of previous studies consists of using only the visual source to modulate the perceptual load. This is in line with Spence and Santangelo’s remark (C. Spence & Santangelo, 2009) on the great number of studies that failed to shed light on the modulatory effects of load on multisensory stimuli using a silent and dark laboratory environment.
Real-life sensory processing and behavior are complex and dynamic, involving interactions of many context-dependent stimuli through different sensory modalities. A growing number of studies highlight that complex and multisensory stimuli produce highly reliable, selective and time-locked activity in many brain regions compared to conventional experimental protocols (for a review, see Hasson et al., 2009 (Hasson, Nusbaum, & Small, 2009)). However, naturalistic stimulation is often questioned because of its uncontrolled nature (Felsen & Dan, 2005). Virtual Reality (VR) experiments can bridge the gap between the control granted by laboratory experiments and the realism needed for a real-world neuroscience approach (Matusz, Dikker, Huth, & Perrodin, 2019). An interesting example is the usage of a VR flanker task with realistic stimuli (Olk, Dinu, Zielinski, & Kopper, 2018). From a methodological perspective, VR allows researchers to maintain a high degree of control on the experiment, while at the same time immersing participants in highly realistic multisensory environments (Blascovich et al., 2002). Furthermore, subjects' reactions correspond very closely to those aroused in a real situation, even being aware they are not (Gonzalez-Franco, Perez-Marcos, Spanlang, & Slater, 2010; Pavone et al., 2016; V. Petkova & Ehrsson, 2008). This phenomenon is explained mainly by the sense of presence (SoP), that is, the illusion that between the user and his experience there is no mediation of a device [Lombard, 1997 #387] (Lombard & Ditton, 1997), he then "feels there”(Sanchez-Vives & Slater, 2005).
18 Given the role of the perceptual load in modulating multisensory stimuli processing and consistently with the multisensory nature of our daily experience, the aim of the present study was to investigate the effects of multisensory cueing on a target detection task under two different conditions of multisensory perceptual load. Here, different multimodal cues (e.g., auditory and vibrotactile) were concurrently presented, alone or in combination, with a visual target and with the perceptually corresponding environmental noises. To do so, we devised a novel naturalistic visual search task in VR, in which participants drove a car on a virtual racetrack with the aim to hit the highest number of spheres (i.e., the targets). During the experiment, we acquired electroencephalography (EEG) signal and galvanic skin response (GSR) along with subjective measures to assess the perceived workload and the sense of presence. The electrodermal response permits to assess the level of arousal; previous studies demonstrated its utility as an objective measure of anxiety under threating situations or to provide physiological evidence of body illusions (Gonzalez-Franco et al., 2010; V. Petkova & Ehrsson, 2008; Mel Slater et al., 2010). Thought EEG measures we extracted the spectral features related to the workload using an already validated algorithm (Arico, Borghini, Di Flumeri, Colosimo, Pozzi, et al., 2016; G. Di Flumeri et al., 2018). For the first time, here we investigate the facilitation effect of multisensory cueing by exploring whether and how auditory and tactile stimuli (alone or combined) presented concurrently with the visual targets in two different conditions of perceptual load (e.g. Low and High) could i) improve the participants’ detection performance, ii) enhance their sense of presence in the virtual environment and iii) modulate their mental workload.
2.3 Materials and methods
2.3.1 Participants
Eighteen healthy male volunteers (mean ± SD, 26.5 ± 3.2 years old) without significant psychiatric or neurologic diseases and with normal or corrected-to-normal visual acuity
19 participated in the study. We chose to involve only male subjects in order to reduce the
inter-subjects’ variability due to putative gender effects associated with the 3D driving task, and consequently, to make the statistical results more reliable. In particular, since video games are played more by males than by females (e.g., Griffiths, 1991b; Kaplan, 1983; Phillips, Rolls, Rouse, & Griffiths, 1995; Wright et al., 2001), and our experimental task resembled very closed the setup of a videogame, we didn't want to risk introducing such a bias in our study. It is worth noting, however, that this phenomenon could be partially explained in terms of accessibility to videogames consoles (Woodard & Gridina, 2000). The experimental protocol was approved by the ethics committee of Sapienza University of Rome and was carried out in accordance with the ethical standards of the Declaration of Helsinki of 1964. All participants gave their written informed consent before the experiment.
2.3.2 Experimental setup
Inspection of Figure 3A depicts the experimental setup. A virtual scenario consisting of a car on a racetrack was designed in 3ds Max 2015 (Autodesk Inc.) and implemented in Unity3d 5.3.1 (https://unity3d.com). Subjects explored the Virtual Reality (VR) environment from the driver’s first-person perspective by means of an Oculus Rift Dk2 head mounted display (HMD) (www.oculus.com). The HMD has a 100° field of view, a resolution of 960 x 1080 per eye and internal sensors to track head movements. To control the car, a Logitech g27 racing wheel with no shifter was used. Participants were instructed to use only the throttle pedal and to maintain it pressed despite the speed of the virtual car was fixed to reduce the performance variability across subjects. The vibrotactile feedback was delivered using two DC vibrating motors applied to a wearable belt, developed by Braintrends (www.braintrends.it) for the experiment purposes. The audio feedback was delivered using headphones. To record skin sweating activity, Galvanic skin response (GSR) was monitored by means of the NeXus-10 MKII system (MindMedia BV, Netherlands,
20
www.mindmedia.com) and its dedicated software BioTrace+. GSR sensors were applied to
the index and middle fingers of the participant's non-dominant hand (Boucsein, 2012). The EEG recordings were carried out using 38 channels. The amplifier adopted in the experiment was the Galileo BEPlus (EBNeuro Spa, Italy, www.EBNeuro.biz).
2.3.3 Experimental procedure
Before the experiment, participants were asked to become familiar with the steering wheel and the pedals. The familiarization procedure was performed in the virtual reality setting during a driving task similar to that employed in the experimental protocol, without any other task to perform. The familiarization procedure was considered as completed when participants were confident with the driving task and the Head Mounted Display (Tieri et al, 2015). Subjects began the experiment with two 1 min runs in which they were instructed to rest, respectively with eyes open and closed. Then, two 2 min baseline conditions were performed while subjects drove in two different conditions of cognitive load (i.e., Low and High). These two conditions were coherent to those ones employed during the experimental tasks. For the Low condition, the virtual scenario consisted in sunny weather and maximum visibility, for the High condition rainy weather and mist were employed, limiting the visibility and providing a high environmental noise due to the presence of rain and thunders (Fig.3B-C). After the baseline tasks, subjects were asked to perform 8 runs, 3-minute long each. All these baseline conditions were necessary to calibrate the EEG-based algorithms (see below for further details). The goal of the virtual task was to drive a car around a racetrack (the same employed during the baselines) and to hit slightly transparent spheres-like objects, spawned randomly on the left or right side of the track. The goal of this task was to achieve the highest possible score by gathering as many targets possible while completing a lap as fastest as possible. The collectible items could arise from the ground or fall from the sky and were fixed
21 in number (i.e., 20 in Low, 40 in High) but not in the position on the horizontal plane (i.e. right or left), which was randomized, to avoid expectations or habituation effects.
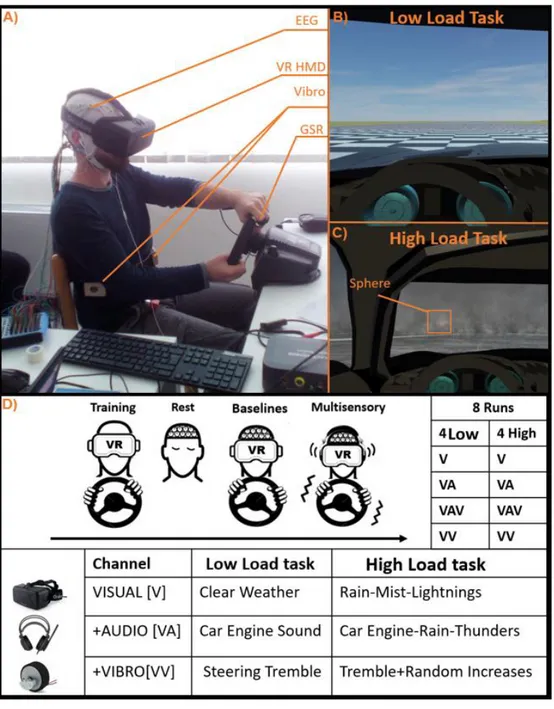
Figure 3 A) Experimental Setup; B) the First-person perspective of Low and C) High Load Conditions. The target object (the sphere) is represented in the insert; D) Summary of the experimental procedure with the detail for each Task.
The perceptual load of the task was increased (i.e. High condition) thanks to a faster-spawning rate of the spheres and to the visual and audio presence of rain, mist, thunders, and lightning. For each Load Condition, each subject performed 4 runs, which differed in terms
22 of sensory channels enabled: V for the only Visual channel, VA for Visual and Acoustical channels, VV for Visual and Vibro-tactile ones, VAV with all of them. In the V task, participants experienced just visual stimuli, and they could not feel any sound or vibration from the surrounding environment. In the VA task, the Acoustic channel provided a cue of the spheres’ appearance through a “beep” in a stereo mode (i.e. providing also information about the side, right or left). Participants could also hear the engine of the car running and, for which concerns the High load task, the sound of the rain and thunders. In the VAV task, subjects guided towards the stimuli also from the stereo vibrotactile feedback provided through a vibrating belt, tied to their abdomen. In this task, also the steering wheel vibrated following the car engine modulation and thunders. The VV task was the same as for the VAV, except for the sound, muted in this case. Figure 3B and C illustrate examples taken from the Low and High Condition, while Figure 3D provides a summary of the employed multimodal perceptual task. At the end of each task, the HMD was removed from subjects’ heads to avoid any possible sense of nausea and to allow them to fill the workload and the 3 items questionnaire on the sense of presence, both described in the next paragraph. Subjects started with the Low or High Load Condition in a counterbalanced order. Both tasks were comprehensive of the 4 sensory input conditions, presented in a counterbalanced way across participants.
2.3.4 Subjective evaluation
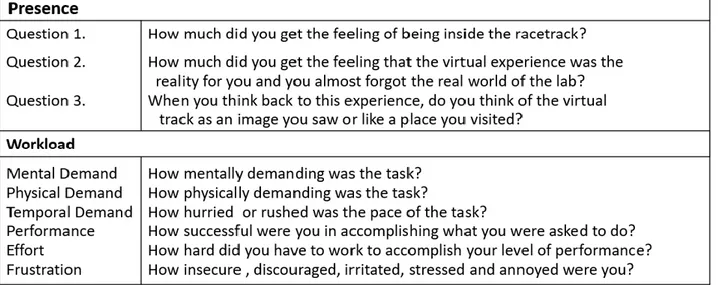
After each experimental run, subjects gave their answers to the presence and workload questionnaires (Table 1). The sense of presence questionnaire was adapted from previous work (Sanchez-Vives & Slater, 2005) and consisted of three questions scored on a scale from 1 to 7. To achieve a final presence score, we averaged the three answers. The Nasa TLX Questionnaire (Hart & Staveland, 1988) assesses workload based on 6 subscales(Mental Demand, Physical Demand, Temporal Demand, Performance, Effort, Frustration). They are rated for each task within a
100-23 points range with 5-point steps. The scoring and the analysis related to the NASA-TLX were carried out using a Digital TLX software that automatically calculated the weighted average index of workload index using the weights and the parameters established by Hart and Staveland’s questionnaire (Hart & Staveland, 1988).
Table 1. Questions assessing the perceived feeling of presence and workload.
2.3.5 Neurophysiological measurements
2.3.5.1 EEG recordingsFor each subject, scalp EEG signals have been recorded by the digital monitoring BEplus system (EBNeuro system, Italy) with a sampling frequency of 256 (Hz) by 38 Ag/AgCl passive wet electrodes covering all the scalp sites (Fp1, Fpz, Fp2, F3, F4, F7, Fz, F8, AF3, AF4, AF7, AF8, FC3, FC4, FCz, C3, Cz, C4, T3, T4, CPz, C5, C6, CP3, CP4, P3, Pz, P4, P7, P8, PO7, PO8, PO3, PO4, O1, Oz, O2, POz) referenced to both the earlobes and grounded to the AFz electrode, according to the 10-20 standard (Jurcak, Tsuzuki, and Dan 2007). In addition, both vertical and horizontal EOG signals have been recorded concurrently with the EEG, and with the same sampling frequency (256 Hz), by two bipolar channels surrounding the right eye, in order to collect the eye-related activity (i.e. eyes blinks and saccades) of the
24 subjects during the execution of the task. Two different analyses have been performed to evaluate the experienced workload of the subject across the different Sensory Tasks and Load Conditions.
2.3.5.2 Time-domain analysis
The first analysis has been performed in the time domain, by using Event-Related Potentials (ERPs) elicited by the hit targets. Since such kind of analysis requires a strong synchronization between the EEG recording system and the target appearance, all the experimental task-related events (i.e. starting and ending time for each condition, the appearance of each target to hit) have been synchronized with the recording systems by using dedicated trigger station (BrainTrends, www.braintrends.it). ERPs represent the EEG voltage fluctuations that are associated in time with some physical or mental occurrences (Picton et al., 2000). Specifically, the event-related potential (ERP) P300 is a positive deflection of the EEG signal elicited at around 300 ms after the occurrence of a stimulus that the user is paying attention to (Fabiani, Gratton, Karis, & Donchin, 1987). The P300 component is normally evaluated in terms of amplitude and latency. Amplitude is defined as the difference between the largest positive-going peak of the ERP waveform within a time window (e.g., 250–500 ms) and the average of the time-epoch voltage chosen for the analysis (e.g. 0-600ms). Latency (in ms) is defined as the time from stimulus onset to the point of maximum positive amplitude within the same time windows. The evoked response is extracted from the EEG as the average of a series of single responses (synchronized averaging) in order to remove the random fluctuations of the EEG. Although P300 amplitude and latency could be affected by several factors (e.g. attention, fatigue, age, gender (Polich & Kok, 1995) it has received much attention as a potential indicator of mental workload. In this regard, recent studies demonstrated a reduced P300 amplitude under higher workload conditions in ecologically valid tasks. Unlike P300 amplitude, the latency of the P300 is often increased if the categorization of the eliciting stimulus becomes more difficult, thus, representing the timing
25 of mental processing (Arico et al., 2014; Kathner, Wriessnegger, Muller-Putz, Kubler, & Halder, 2014). To summarize, for each subject we calculated P300 amplitude and latency values, averaged for all the hit targets, for each condition (2 load conditions and 4 sensory tasks). In the following, the algorithm steps to calculate P300 amplitude and latency starting from recorded EEG signals were reported.
First of all, the EEG and EOG signals have been firstly band-pass filtered with a fifth-order Butterworth filter (low-pass filter cut-off frequency: 30 (Hz), high-pass filter cut-off frequency: 1 (Hz)). Independent Components Analysis (ICA(Lee, Girolami, Bell, & Sejnowski, 2000)) has been performed to remove eye blinks and eye saccades artifact contributions that could affect the morphology of the evoked P300 potentials. After that, the EEG signals have been segmented in epochs of 600 ms starting from the onset of the target appearance. For other sources of artifacts (e.g. bio amplifier saturation, muscular activity) specific procedures of the EEGLAB toolbox have been used (Delorme & Makeig, 2004). In particular, three criteria have been applied. Threshold criterion: if the EEG signal amplitude exceeds ±100 (μV), the corresponding epoch would be marked as an artifact. Trend criterion: each EEG epoch has been interpolated in order to check the slope of the trend within the considered epoch. If such slope was higher than 10 (μV/s) the considered epoch would be marked as an artifact. Sample-to-sample difference criterion: if the amplitude difference between consecutive EEG samples was higher than 25 (μV), it meant that an abrupt variation (no-physiological) happened and the EEG epoch would be marked as artifact. At the end, all the EEG epochs marked as artifact have been rejected from the EE withG dataset with the aim to have an artifact-free EEG signal from which estimate the brain variations along the different conditions (Gianluca Di Flumeri, Borghini, et al., 2019). All the previously mentioned numeric values have been chosen following the guidelines reported in Delorme and Makeig (Delorme & Makeig, 2004).
At this point, the remaining time epochs have been filtered by using a method described in Aricò et al., (Arico et al., 2014) based on the use of wavelet transformation, to increase the signal to noise ratio (SNR) of the P300 potentials recorded during the experimental tasks.
26 Such an algorithm was necessary to compute as accurately as possible amplitude and latency of P300 potentials, starting from a not too high number of stimuli (i.e. 20 targets for the Low tasks and 40 for the High ones). Amplitude and latency studies on P300 potential are normally performed on the Cz electrode, where such component assumes the higher amplitude (Arico et al., 2014), so, just P300 epochs on this electrode have been taken into account for the following analyses. In particular, we decomposed each single target epoch into its time-frequency representation by evaluating the continuous wavelet transform (CWT). We used a complex Morlet mother wavelet, with frequency content ranging from 1 to 20 Hz with a frequency resolution of 0.5 Hz and a time window of 600 ms. We computed the power spectrum (PWT) for each transformed single epoch, defined as the squared magnitude of the CWT. Finally, we computed the average PWT over all epochs, to identify the wavelet coefficients with the highest power. Coefficients below a specified power threshold were filtered out, according to the following procedure: the empirical cumulative distribution function (CDF) of the power spectrum was calculated through the Kaplan–Meier estimation (Lawless, 2003) the filtering model consisted of a matrix (PMask) whose time-frequency elements were set to 1 when the CDF of the corresponding wavelet coefficient was greater than the threshold and set to 0 otherwise. We computed the best threshold value referring to the original method used in a previous study (Arico et al., 2014), aiming to eliminate as much noise as possible while preserving the shape of the P300 potential. A filtered version of the target single epochs was finally obtained by evaluating the inverse CWT (ICWT) of the coefficient of every single epoch, multiplied for the PMask. At this point, filtered epochs have been averaged for each subject, load condition, and sensory modality condition. Finally, as stated before, the amplitude has been estimated as the difference between the largest positive-going peak of the P300 waveform within a time window (e.g., 250–500 ms) and the average of the time-epoch voltage chosen for the analysis (i.e. 0-600ms). Latency (ms) has been calculated as the time from stimulus onset to the point of maximum positive amplitude.
27
2.3.5.3 Frequency-domain analysis
The second kind of analysis has been performed in the EEG frequency domain. With respect to the former analysis (ERPs-based), that was strictly locked to the processing of targets appearance, such analysis in frequency domain was employed to highlight the overall workload experienced by the subjects along the whole running lap, for each experimental condition. In this regard, most of the studies showed that the brain electrical activities mainly involved in the mental workload analysis are the theta and alpha brain rhythms typically gathered from the Pre-Frontal Cortex (PFC) and the Posterior Parietal Cortex (PPC) regions. Previous studies demonstrated as the EEG theta rhythm over the PFC presents a positive correlation with the mental workload (Smit et al. 2005). Moreover, published literature stressed the inverse correlation between the EEG power in the alpha frequency band over the PPC and the mental workload (Jausovec & Jausovec, 2012). Only a few studies have reported significant results about the modulation of the EEG power in other frequency bands, i.e. the delta, beta and gamma (Gevins & Smith, 2005). More specifically, most of the studies are focalized on the EEG power modulation occurring in theta (4 – 8 Hz) and alpha (8 – 12 Hz) frequency bands, usually associated with cognitive processes such as working memory and attention, typically involved in mental workload. Mental workload is also known to suppress EEG alpha rhythm and to increase theta rhythm during the activity of information encoding and retrieval (Vecchiato et al., 2014). Depending on such evidence, theta EEG rhythms over frontal sites, and alpha EEG rhythms over parietal sites have been used for this kind of analysis. As for the time domain analysis, all the processing and artifact removing algorithms have been applied in order to i) avoid eyes blinks and saccades contribution, that could even in this case frequency bands related to workload and introduce a bias, and ii) remove all the other sources of artifacts. The EEG signal has been segmented into epochs of 2 seconds, shifted of 0.125 seconds (Arico, Borghini, Di Flumeri, Colosimo, Pozzi, et al., 2016). The Power Spectral Density (PSD) was calculated for each EEG epoch using a Hanning window of the same length of the considered epoch (2 seconds length (that means
28 0.5 (Hz) of frequency resolution). Then, the EEG frequency bands of interest have been defined for each subject by the estimation of the Individual Alpha Frequency (IAF) value (Klimesch, 1999).
In order to have a precise estimation of the alpha peak and, hence of the IAF, as stated before the subjects have been asked to keep the eyes closed for a minute before starting with the experiments. Finally, a spectral features matrix (EEG channels x Frequency bins) has been obtained in the frequency bands directly correlated to the mental workload. In particular, only the theta rhythm (IAF-6 ÷ IAF-2), over the EEG frontal channels (F3, F4, F7, Fz and F8), and the alpha rhythm (IAF-2 ÷ IAF+2), over the EEG parietal channels (P3, Pz, P4, P7, and P8) have been considered as variables for the mental workload evaluation.
2.3.5.4 Workload assessment: The EEG Workload Index
In order to select the subjective discriminant EEG spectral features related to the workload, a linear classification algorithm (automatic stop Stepwise Linear Discriminant Analysis - asSWLDA, (Arico, Borghini, Di Flumeri, Colosimo, Bonelli, et al., 2016) has been used. This algorithm has been already validated and successfully employed for EEG-based workload assessment in operational environments, such as air traffic management (Arico, Borghini, Di Flumeri, Colosimo, Pozzi, et al., 2016) and car driving (G. Di Flumeri et al., 2018). Once trained with specific “calibration data”, the algorithm can be used to compute a workload index (i.e. WEEG index) on other data by combining the selected EEG features with
specific weights in output from the model itself. In particular, for each Load Condition, the classifier has been calibrated by using the baseline data (i.e. BasLOW or BasHIGH and the respective 1st half of the “V” Task (i.e. V Low or V High). We used just such a task (i.e., V)
to train the algorithm because the baseline data (i.e. BasLOW orBasHIGH) have also been performed without any sensory input except the visual one, like for the V task. In other words, in this way, we were sure to use two conditions which differed just for the workload (in fact in the Baseline condition there were no targets to collect, in the respective V task the “environmental conditions” were the same but the driver had to hit as many targets as
29 possible), and not because of the presence of other sensory modalities. At this point, we calculated the WEEG index for the 2nd half of each condition, for each Load Condition (i.e. V
Low, VA Low, VAV Low, VV Low or V High, VA High, VAV High, VV High), and vice
versa (i.e. calibration on 2nd half and W
EEG evaluation on the 1st half). Of course, the WEEG
index over Low and High related Conditions was not comparable among load conditions, because of the different normalization. In conclusion, z-score transformation (Zhang, Chung, & Oldenburg, 1999), has been used to compute a normalization of WEEG index distribution.
2.3.5.5 Arousal assessment
The signal related to the Skin Conductance named hereafter Galvanic Skin Response (GSR), has been recorded with a sampling frequency of 128 Hz (fs = 64 Hz) through the NeXus-10 MKII device (MindMedia BV, Netherlands), a high-quality device consisting in a wireless amplifier with specific GSR sensors applied at the no-dominant hand: by means of two electrodes on the first phalanx of the index and middle fingers, a constant potential was applied in order to induce a skin electrical current. The variations of such current are functions of the skin conductance variations.
The recorded signal was then entirely processed by using the MATLAB software. First, the signal was downsampled to 32 Hz, in order to reduce the data amount. Secondly, the signal was filtered through a 5th order Butterworth low-pass filter, with the cut-off frequency at 4
Hz, in order to remove all the higher frequency components that are not related to the electrodermal activity. Then, the signal was processed by using the Ledalab suite, a specific open-source toolbox implemented within MATLAB for the GSR processing (please visit the web site for further information): the Continuous Decomposition Analysis (Benedek & Kaernbach, 2010) has been applied in order to separate the Tonic (Skin Conductance Level - SCL) and the Phasic (Skin Conductance Response - SCR) components of the GSR. In this regard, Boucsein (Boucsein, 2012) provided the most exhaustive review about GSR physiological interpretation and GSR analysis techniques. Briefly, there are two major
30 components for GSR analysis: the SCL (tonic component) is a slowly changing part of the GSR signal, mostly related with the global arousal of a subject during a situation, whilst the SCR (phasic component) is the fast-changing part of the GSR signal, which occurs in relation to single stimuli reactions.
In the following analysis, the mean value of the SCL and the mean amplitude of the SCR peaks during the experimental conditions have been investigated.
2.3.6 Performance Assessment
At the end of each run, our software produced a log-file with information related to the number of hit targets (#HitT) and to the total time duration (TimeD). Such information has been collected for each subject and experimental condition. A task performance index has been calculated by combining #HitT and TimeD, normalized respectively to the total number of targets (#TotT) and the minimum time required to run a complete lap (TimeMin, Equation 1). The latter has been calculated by dividing the track length by the maximum car speed.
𝐻𝑖𝑡𝑇 𝑇𝑜𝑡𝑇∗
𝑇𝑖𝑚𝑒𝐷 𝑇𝑖𝑚𝑒𝑀𝑖𝑛
Equation 1. Performance Index
2.4 Results
2.4.1 Statistical analysis
Data analysis was performed with R-studio (Version 1.1.463), a free software programming language and software environment for statistical computing (RStudio Team, 2016). We performed a multilevel mixed linear regression analysis (LMM or “mixed-effects models”; Pinheiro and Bates, 2000) through the package Afex (Singmann, Bolker, Westfall, & Aust,
31 2015). Unlike traditional statistical methods, LMM can deal with grouped, nested or hierarchical structured data (Faraway, 2005). Furthermore, LMM are statistical models that incorporate both fixed-effects parameters and random effects (Bates, Mächler, Bolker, & Walker, 2015) and can separately treat the effects caused by the experimental manipulation (fixed effects) and those that were not (random effects) (Pinheiro & Bates, 2000). Importantly for the present experiment, LMM can handle missing data (Gelman & Hill, 2006). Here we used mixed-effect models to test how our dependent variables are influenced by the experimental manipulations (i.e., V/VA/VAV/VV) and by the load condition (i.e., Low and High). We adopted a different model for each dependent variable. The variables were: (a) performance; (b) subjective ratings of workload (i.e., Nasa-TLX), (c) sense of presence;(d) EEG-based workload (WEEG); (e) skin conductance. As fixed effects, we used the load
conditions (High vs. Low) and the sensory tasks (i.e. V for Visual, VA for Visual-Audio, VAV for Visual-Audio-Vibro, VV for Visual Vibro). The resulting models included the subjects as a random factor (i.e., random intercept) and the random slopes of load condition and sensory tasks over subjects. Type III Wald Anova function from the “car” package in R was used to determine the statistical significance of the fixed effects. Post hoc comparisons using the Tukey test were carried out from the “lsmeans” package in R.
2.4.2 Performance
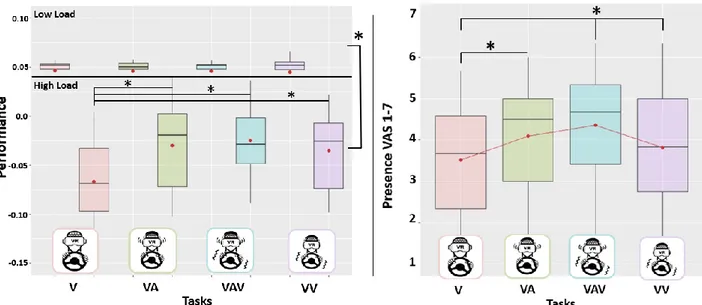
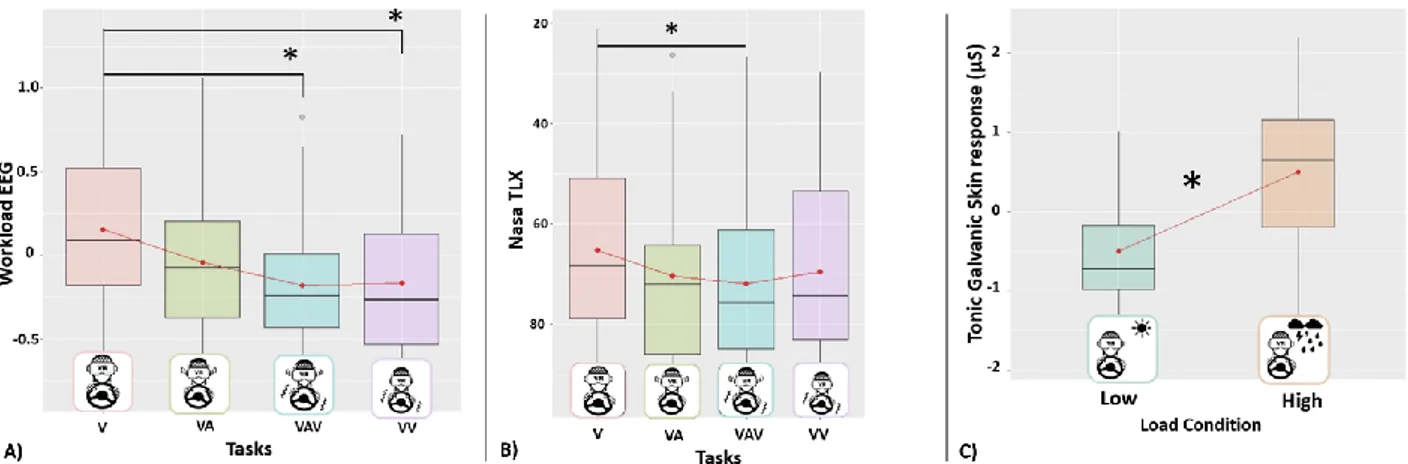
As a first step, we focused on the effects produced by the multimodal integration and the cognitive load on the subject’s performance. We obtained a significant main effect of the Cognitive Load (χ2 (1) < 2.2e-16) explained by reduced performance in the High with respect to Low Load Condition. Also, we found a significant “ConditionXTask” interaction (χ2 (1) < 0.001) explained by the increment of the subject’s performance elicited by both bimodal and trimodal stimulation tasks compared to when only the visual signal is available (all
p-32 values < 0.01), only in the High Load Condition (Figure 4A). No significant differences were obtained in the Low Load Condition (p>0.05).
2.4.3 Sense of Presence
The regression analysis showed the significant main effect of sensory tasks (χ2 (1) =0.0015) explained by higher sense of presence in the task with higher sensory integration (VAV) with respect to when only the visual modality was available (V) (p<0.007) or when the auditory feedback was absent (VV) (p=0.026). The visual and audio integration (i.e., VA) produced a higher sense of presence with respect to the task with the only visual channel (V) was available (p=0.048) (Figure 4B). Also, we found the significance of the Load Condition (χ2(1) =0.0038) explained by a higher sense of presence in the High Condition, which increases the sense of presence by β = 0.559 (p = 0.0118).
Figure 4 Bar graph representing behavioral correlates of the A) Performance Index for the Low Load Condition (top) and High Load Condition (bottom) for each sensory task. Values (y axis) are negative as they result from the normalization of the performance assess.
33
2.4.4 Workload
In terms of the EEG-based workload index (WEEG), the regression analysis showed the
significance of the main effect sensory task (χ2 (1) <0.001. Post-hoc tests revealed decrement of the workload in the multisensory tasks VAV and VV with respect to task in which the only visual channel (V) is available, respectively by β 0.333 (p =0.002) and by β 0.319 (p=0.006) (Figure 5A). No significant effect of the Load Condition neither of the interaction with the Sensory Tasks was found (p>0.05).
Similar effects were found for subjective measures of workload (NASA-TLX) where the regression showed the significant main effects of Sensory Tasks (χ2(1) = 0.015), due again to the reduction of the perceived workload in the task in which the sensory integration is maximal (VAV) with respect to when the visual channel alone is available (V) (p=0.025) (Figure 5B). No other comparisons were significant (p>0.05). Also, we found the significance of the Load Condition (χ2(1) < 0.001), explained by the higher perceived workload in the High with respect to the Low Condition.
Figure 5 Bar graphs representing A) the EEG-based Workload index and B) the workload experienced by the subjects, both across the Sensory Tasks; C) the tonic GSR averaged across sensory tasks for each Load Condition.
34
2.4.5 Skin Conductance
Regarding skin conductance, both tonic and phasic components (i.e., average SCL and SCR peaks amplitude) revealed a significant main effect of the Load Condition (respectively χ2(1) = 0.001 for the tonic and χ2(1) <0.001 for the phasic component). Post-hoc test revealed higher arousal in the High Load Condition with respect to the Low Load Condition (β 0.998, p=0.004 and β 25, p<0.0001, respectively for tonic and phasic component).
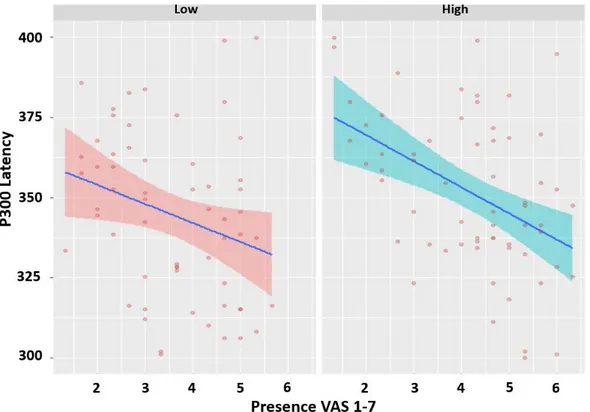
2.4.6 Presence predicted by P300 latency
The previous results show an effect of the multisensory integration on the sense of presence and workload mostly during the Condition of High Cognitive Load. In the next analysis, we tested whether the participants’ sense of presence experienced in the Low or High Cognitive Load Condition was predicted by the interaction between P300 latency and immersivity features, such as the amount and types of sensory stimulation provided to the subjects, and by the task load. To this aim, we ran a multilevel mixed log-linear regression analysis on the model with the participants’ subjective ratings of the sense of presence as our dependent variable and P300 latency, Load condition (Low vs. High) and sensory tasks (i.e. V for Visual, VA for Visual-Audio, VAV for Visual-Audio-Vibro, VV for Visual Vibro) as our fixed effects. The resulting model included the subjects as a random factor (i.e., random intercept), the random slopes of Load condition and sensory tasks over subjects. Type III Wald Anova function from the car package in R was used to determine the statistical significance of the fixed effects.
Results showed a significant main effect of Load (χ2(1) =0.001), pointing that when presence increase, P300 Latency decreases more rapidly in the High condition. Additionally, we found significant interactions between P300 latency and Load condition χ2(1)=0.012 and tasks X
35 condition χ2(3)=0.003049 which were qualified by the significant P300 latency X Load Condition X tasks interaction χ2(3)= 0.003.
No further test using other measures as predictors of presence highlighted any significant behavior.
2.5 Discussion
In this study, we employed a target detection task in immersive virtual reality, neurophysiological and behavioral measures to devise a highly controlled naturalistic paradigm to investigate the facilitation effect of the multisensory cueing with respect to the
Figure 6.How Presence was predicted by P300 latency in the High task was significantly different from the Low task. An increase in the sense of presence in the High task in fact, caused the P300 latency to decrease more rapidly.
36 unimodal visual stimulation, under different conditions of perceptual load (High vs Low). Our results showed an interaction effect between multisensory integration and perceptual load in enhancing the subjects’ performance, which was higher each time the spatiotemporal integration (bimodal or trimodal) between sensory modalities occurred, but only in the condition of high load. As compared to the unimodal stimulation, the sense of presence increased when there was concordance between visual and auditory signals, both when the vibrotactile feedback was or not delivered (VAV and VA, respectively). In general, the illusion of being present in the virtual environment was higher in the condition of high, not low, cognitive load. By contrast, the haptic feedback was beneficial for the workload, as evident through the EEG-based index and subjective measures (NASA TLX).
2.5.1 Multisensory integration boosts performance under load condition
In line with previous reports on the facilitatory orienting effects by multisensory events in different load situations (Lunn et al., 2019; Santangelo & Spence, 2007), we found that the subjects’ performance in the high perceptual load condition, was significantly enhanced by the multimodal cueing, compared to unisensory stimuli. Differently from classical visual search or spatial orienting tasks in which participants have to press a button or a pedal, here we asked participants to hit the perceived targets by steering a car in a virtual scenario. As can be seen from a reduction in performance, the High Load condition makes the task more difficult compared to the Low load condition, causing the subjects to miss more targets. Due to the higher mental load elicited by this condition, both the bimodal (i.e., visual-audio and visual-vibrotactile) and trimodal (VAV) stimulations improve significantly the performance compared to the mere visual condition. Given these results, our results converge with Santangelo and Spence(Santangelo & Spence, 2007) suggestion on the employment of multisensory stimuli in an applied context. As shown by Ho and colleagues in fact(C. Ho, Reed, & Spence, 2007; C. Ho, Santangelo, & Spence, 2009), multisensory stimulation could represent an important feature in the design of driver warning signals. Additionally, our data
37 extend those results to high load conditions resulting from multisensory environmental noise. However, Lunn and colleagues(Lunn et al., 2019) demonstrated rather clearly that multisensory stimuli are not ‘immune’ to perceptual load effects as proposed by Santangelo and Spence (Santangelo & Spence, 2007), (see also Lavie’s work (Nilli Lavie, Ro, & Russell, 2003)on immune stimuli) but they still showed clear evidence of facilitatory attentional capture by multisensory stimuli.
2.5.2 The workload is decreased by vibrotactile cues
An important matter worth investigating is the interplay between multisensory stimulation and mental workload. Only a few studies investigated such relationship employing subjective questionnaires (Hancock, Mercado, Merlo, & Van Erp, 2013; Vitense, Jacko, & Emery, 2003) see (Kahol, French, Panchanathan, Davis, & Berka, 2006) for haptic feedback and EEG based attention peaks). To our knowledge, this is the first study exploring the effects of multimodal stimuli on workload through an EEG based index, especially with virtual reality. The subjective workload measure assessed by the Nasa TLX (Hart & Staveland, 1988) revealed that the trimodal condition was the only one perceived as less demanding compared to the visual one. Conversely, the EEG analysis showed a decrease in workload in both the Visual-Audio-Vibro and the Visual-Vibro condition, regardless of the load (of course, WEEG index over Low and High related conditions was not comparable among load levels, because of the different normalization). The reason for this facilitatory effect on the cognitive system could have multiple interpretations. For which concerns the trimodal solution it can be easily conjectured that signals from both audio and haptic feedback do really make the task more immersive and easier to perform as one could guess looking at participants performances (see also (C. Ho et al., 2007)), workload and presence questionnaires. Instead, it can be speculated that the absence of environmental sounds, while detrimental for the illusion of presence, for
38 the performance it represents a cognitive relief for those subjects engaged in the task. The mental cost of filtering out the engine sounds and rain noise in the high cognitive load condition, in fact, is probably higher or more stressful (Szalma & Hancock, 2011) than the one needed to ignore the steering wheel vibrations, and this could explain why, despite the higher presence and performances scorings in the visual-auditory (i.e., VA) condition compared to the visual-vibrotactile one (i.e., VV), the latter happens to be less cognitive exhausting. However, it is worth considering that the different localization between the environmental vibrotactile source (steering wheel) and the cueing source (abdomen) could have contributed to reducing the cognitive effort by facilitating the discrimination of the cues from the distracting vibrations in the VV condition. Nevertheless, this finding suggests that in the designing of future workstations, solutions could exploit different sensory combinations to achieve different goals, depending on the task difficulty and duration, and taking into consideration whether prioritize performances on one side or user stress and mental fatigue on the other.
2.5.3 Multisensory stimulation and Perceptual Load modulate the sense of Presence
Exploring literature only a paucity of studies demonstrates an enhanced sense of presence concurrent with a multisensory exposition in virtual reality. For example, few studies investigated the effect of environmental sounds instead of silence in a virtual reality scenario (e.g., (Hendrix & Barfield, 1996); (Dinh et al., 1999). A more recent study (Cooper et al., 2018) carried out with projectors and 3d glasses, describes the relationship between the subjective sense of presence and the combination of sensory modalities (visual – audio-tactile) by reporting an increase of presence in the trimodal condition compared to the bimodal and in the latter compared to the unimodal one.
Our study confirms this claim using a modern Head Mounted Display. Through a combination of visual, audio and vibrotactile stimulations, accounting for car vibrations, we