the BioRobotics Institute
PhD Program in BioRobotics
Smart sensing solutions
for applications in biomedical engineering
Supervisor PhD Candidate
Prof. Cecilia Laschi Ilaria Baldoli Tutor
Dr. Matteo Cianchetti
Co-Tutor
Dr. Francesca Cecchi
The measurement of pressure distribution over a defined surface is a matter of paramount importance in many situations regarding industry, robotics and biomedical engineering. Novel and smart sensing solutions are research topics of great concern, since the need for large area sensors with properties of flexibility and stretchability is growing. The emerging class of smart textiles holds great potential for developing new concepts of transducers and sensors, and investigations about their prospects deserve rising attention.
The aim of this research is the study of concepts and applications of textile sensors for touch and pressure detection. An example of matrix textile sensor has been designed and developed, by sandwiching a piezoresistive fabric sheet between two outer fabric layers embedding conductive rows and columns. The location of the applied pressure can be identified by detecting the position where the change of resistances occurs between the external conductive paths. Tests regarding its metrological properties have been carried out to highlight the sensor profits and drawbacks and to establish general guidelines for its use.
The wide selection of advantages exhibited by this class of sensors, e.g. thinness, lightness, flexibility, stretchability and wearability, suggests their exploitation in a huge number of purposes, especially concerning the medical field. In this thesis, matrix sensors obtained with conductive/piezoresistive textiles have been employed to develop interactive interfaces for therapy protocols, to measure the pressure applied at the lower leg in case of compression therapy, to sensorize a neonatal intubation skill trainer able to provide objective feedback of clinicians’ performances, and to develop a pressure sensitive tool for electropalatography. For each application, the suitable sensor design has been studied according to the specific requirements. Development, testing and data analysis phases have been accomplished, confirming the versatility and potentiality of the sensing solutions based on smart textiles.
Introduction 1
1 Interface pressure measurements: state of the art 7
1.1 Introduction to pressure mapping applications . . . 7
1.1.1 Human-machine interfaces . . . 7
1.1.2 Ergonomics and sport . . . 9
1.1.3 Industry . . . 10
1.1.4 Robotics . . . 10
1.1.5 Biomedical engineering . . . 12
1.2 Detecting principles for pressure sensing . . . 16
1.2.1 Mechanical deformation-based sensors . . . 16
1.2.2 Capacitive sensors . . . 18
1.2.3 Piezoelectric sensors . . . 19
1.2.4 Optical sensors . . . 20
1.2.5 Magnetic sensors . . . 20
1.2.6 Chemical reaction-based sensors . . . 21
1.2.7 Piezoresistive sensors . . . 22
1.3 Smart textiles . . . 30
1.3.1 Smart Fabric Transducers and Sensors . . . 35
2 Fabric HMI for clinical practice 39 2.1 Introduction . . . 39
2.2 Interactive prototype for Autism Spectrum Disorders . . . 40
2.2.1 Concept and development . . . 41 i
2.3 Smart Tapestry for elderly people . . . 45
2.3.1 Concept and development . . . 47
3 Multilayer matrix textile sensor 53 3.1 Introduction . . . 53
3.2 Sensor development . . . 53
3.2.1 The three layers structure . . . 53
3.2.2 The powering/reading circuit . . . 55
3.3 Sensor characterization . . . 60
3.3.1 Tests description . . . 60
3.3.2 Results and discussion . . . 66
4 Pressure mapping for compression therapy monitoring 77 4.1 Introduction . . . 77
4.2 Textile sensor development . . . 81
4.2.1 Sensor calibration . . . 83
4.3 Pressure monitoring on healthy volunteers . . . 84
4.3.1 Statistical analysis . . . 86
4.4 Results and discussion . . . 86
4.4.1 Sensor calibration . . . 86
4.4.2 Pressure monitoring on healthy volunteers . . . 88
4.5 Concluding remarks . . . 93
5 Sensorization of a simulator for neonatal intubation 99 5.1 Introduction . . . 99
5.2 Design and development of the skill trainer . . . 101
5.2.1 Sensorization of gingival arches and epiglottis . . . 101
5.2.2 Tongue sensorization . . . 104
5.2.3 Integration of the sensors and testing . . . 108
5.3 Tests results . . . 112
6 A pressure sensitive palatograph for speech analysis 119
6.1 Introduction . . . 119
6.2 Prototype development . . . 124
6.2.1 Design of the single sensing unit . . . 124
6.2.2 Development of the complete device . . . 128
6.3 Concluding remarks . . . 133
Conclusions 135
Appendix: Publications list 141
1.1 The resulting force image on an UnMousePad (warmer colors represent greater pressure) [1] . . . 8 1.2 A car seat with Tekscan, Inc. tactile sensors on the left, a pressure map
of the driver before and during the application of the brakes on the right [2] . . . 10 1.3 a) Picture and design scheme of the SynTouchBioTac tactile sensor; b)
the Barrett, Inc. hand on the left and the Shadow Robot Company Ltd hand on the right, both equipped with SynTouchBioTac tactile sensor [2] 12 1.4 Overview of the system architecture of the pressure-sensitive foot insole
developed at the Scuola Superiore Sant’Anna, b) representation of the sensitive element and its functioning principle, c) components of the de-vice: sensorized insole connected to the electronic board through flat cables, Bluetooth transmitter, Li-Ion battery [3] . . . 14 1.5 a) Seating pressure profile with Tekscan’s CONFORMat System®, b)
full body pressure measurement profile with Tekscan’s Body Pressure Measurement System (BPMS) [4] . . . 15 1.6 a) The silver conductive leads of a Tekscan, Inc. sensor are oriented on
two flexible polyester sheets in a row pattern and a column pattern, with a proprietary pressure-sensitive ink that is applied over these conduc-tors, also in rows and columns [5], and b) the circuital scheme for the powering/reading scanning sequence of the sensor [6] . . . 26
1.7 a) Equipotential lines during a step of current injection-voltage measure-ment in EIT, b) sensitive skin applied on an uneven surface [7], and c) images obtained according to conductivity changes with touches (images are from [8]) . . . 27 1.8 Schematic representations and images of force sensing resistors by
Inter-link [9] and Tekscan [4] . . . 29 1.9 Main fabric structures: (a) woven, (b) knitted, (c) non-woven, (d) nets,
(e) braided and (f) tufted, which can be assembled in layers to form composite systems [10] . . . 31 1.10 Typical interconnection paths of wefts and warps in wovens (a) and of
wales and courses in knits (b) [11] . . . 31 1.11 Techniques to provide conductivity properties to fabrics [10] . . . 33 1.12 The three types of conductive threads: a) extruded wires,b) twisted metal
wires, and c) yarn with metal coating [12] . . . 33 1.13 a) EeonTexTMConductive Textiles by Eeonyx Corp. [13] and b) a set of
conductive textiles (including Electrolycra) by Mindsets Ldt [14] . . . . 34 1.14 Examples of textile wearable sensors for motion detection: a) sensorized
glove made of strain sensing fabric for hand posture and gesture moni-toring [15], and b) an intelligent knee sleeve used to provide feedback on the knee flexion angle for injury prevention programs [16] . . . 35 1.15 The four possible topographies to sense the piezoresistive fabric layer
creating a matrix structure: a) sandwich, b) machine sewn, c) trapped conductor, and d) woven [11] . . . 37 2.1 The element of the game for ASD children: a) an illustrated book, b)
two different models of alien-puppets with sensorized palms . . . 43 2.2 The star-mat involved in the game for ASD children . . . 43 2.3 Puppets touching their palms make their antennas light up, thus
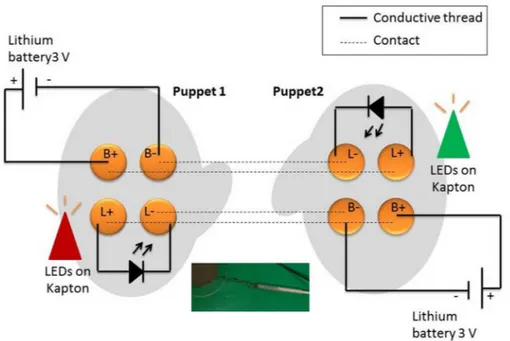
stimu-lating the children interaction . . . 44 2.4 The simple circuit that allows the puppets’ antennas to light up if their
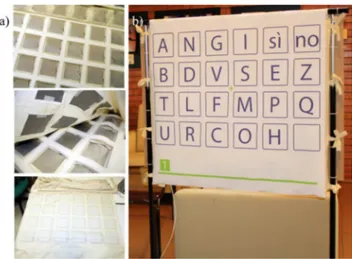
2.5 a) The development of the star-mat, with the sewing of the conductive patches on the tips and the embedding of the acquisition hardware, b) and c) children playing with the puppets and the star, d) images of the star that can be comfortably folded and carried as a light backpack, and e) an illustration of the game elements from the book . . . 46 2.6 Circuital scheme that allows the connection between the conductive patches
on the star tips, the acquisition hardware and the laptop: when the pup-pet’s palm touches the patch on the star, the read out voltage triggers the corresponding audio . . . 47 2.7 Concept of the Smart Tapestry in a smart home . . . 49 2.8 The soft layers composing the sensorized wall mat . . . 50 2.9 a) Development phases of the 24 sensing units in the soft base layer, and
b) the Smart Tapestry . . . 51 2.10 Cognitive test execution with the sensorized wall mat; on the bottom it
is possible to notice the laptop with the LabVIEW graphic user interface for the test administration . . . 51 3.1 a) The three layers of the flexible matrix textile sensor with indicated
soldering points, b) the complete sensor involved in the study and c) the description of the sensels location: the sensitive areas are at the intersection of conductive rows and columns embedded in the fabric and distanced by a piezoresistive layer . . . 55 3.2 Scheme of the powering/reading circuit for the voltage divider circuital
solution: the powering voltage Vcc (provided by the USB connection) is
applied to the rows while the sensel resistance is measured through the acquisition board and the MUX/DEMUX are employed for row/column scanning (Rpd is the pull down resistance that enables the measurement
of the voltage drop that occurs through the textile sensor) . . . 56 3.3 Crosstalk analysis scheme for a portion of the matrix while measuring
Ri,j (right current path: solid arrow, undesired leakage current: dotted
3.4 The powering/reading circuit based on the grounding method: the pow-ering voltage Vcc (5 V ) is applied to the rows while the sensel
resis-tance is measured through the acquisition board at the columns. The MUX/DEMUX are employed for row/column scanning. In particular, every row is driven to Vcc through independent buffers while the others
are switched to ground and the input of the trans-resistance amplifiers acts as a virtual ground so that the columns not active are grounded. The gain of the amplifiers can be tuned to obtain the desired voltage range by varying Rr and additional inverting amplifiers are introduced
for measuring positive voltages with the Arduino Mega Board . . . 59 3.5 Sensor sensels involved in static tests: the 3x3 matrix in the yellow frame
is the area involved for the static calibration, while S3,5, S5,5 and S5,3
(green sensels) were loaded separately for the shear test and all together to prove the grounding efficacy in case of multitouch: if the current leak-age is present, the current path reported with the red arrow would result in the detection of a phantom touch (false output from the red sensel S3,3) 64
3.6 SEM images at the fabric level a) with the knitted structure scheme, at the yarn level b) and the fiber level c); EDS microanalysis results are reported in d) . . . 67 3.7 a) Calibration curves obtained considering the mean voltage outputs for
9 matrix sensels for the four gain resistance values (error bars are due to the three performed trials), b) standard deviations SD (expressed as a percentage) of the single sensels outputs respect to the mean calibration curve vs applied static loads (from 0 to 100 kP a), and c) second order polynomial fittings employed to calculate P from static measurements of Vout . . . 68
3.8 a) Static mean curves for the sensor in case of 20% of stretch in both pla-nar directions vs reference condition (sensor without stretch on a plane), and b) static mean curves for the sensor in case of use on a curved sur-face vs reference condition (error bars refer to the trials performer in triplicate) . . . 69
3.9 Static tests comparing sensels response to just normal load (baseline), normal load with constant shear and normal load with linearly increasing shear; means and SD values were calculated on three sensels stressed separately . . . 70 3.10 a) The mean static stress curves obtained for the three sensels S3,5, S5,5
and S5,3 during the loading of the 3x3 matrix area and the loading of
the three sensels, and b) an image of the 3x3 matrix during the loading of S3,5, S5,5 and S5,3 at 50 kP a, showing the absence of phantom touches 71
3.11 Measured vs applied pressure for loading unloading cycles averaged on three repetitions. Tests were carried out at v1 = 0.1 mm/min, v2 =
1 mm/min, v3 = 10 mm/min, v4= 50 mm/min . . . 72
3.12 Dual exponential fittings and related fitting parameters for the loading a) and unloading b) sections of the stress cycles for three different loading rates (v1= 0.1 mm/min, v2 = 1 mm/min, v3 = 10 mm/min) . . . 74
3.13 a) Applied pressure curves vs measured pressure curves calculated using both the static and the load/unload fittings for v1, v2and v3, b) hysteresis
cycles using the static and the load/unload fittings for the three loading rates) . . . 75 3.14 Measured pressure (averaged on the 9 loaded sensels) during the dynamic
stability analysis: a) the complete 2 h long test, b) a 20 min expanded section of trace a) . . . 76
4.1 a) The three layers of the flexible matrix textile sensor with indicated sol-dering points, b) the sensing area highlighted within the stitched bound-aries, c) description of sensel location (Rpd is the pull-down resistance
that measures the voltage drop occurring through the textile), and d) the powering/reading circuit . . . 82
4.2 a) Textile pressure sensor with the three FSR fixed on its top side, b) standardized points for leg dimension measurements and FSR sensor po-sitioning (the B1 point -red circle- is the common landmark for clinical measurements), c) textile sensor adjusted on the leg of a volunteer, with the three FSRs fixed at points C, B1 and B, and (d) compression bandage applied by a doctor, covering the sensing device . . . 84
4.3 a) Linear relationship between pressure and mean voltage output for the matrix sensels involved in the calibration; b) standard deviation (SD) trend expressed as the percentage of the corresponding mean value for the matrix sensels voltage output vs. the applied static load (from 10 to 100 mmHg) . . . 87
4.4 Calibration curves for the three FSR (R2 > 0.9 for all sample types); a
(mmHg) and b (V−1) are the curve fitting parameters . . . 88
4.5 a) Subject during a standing task, provided with a sensorized elastic bandage (Bandage 1); planar b) and three-dimensional c) distribution maps of pressure acquired for 3 min and averaged over time, according to the 12x6 matrix structure of the sensor (calculated values are represented in correspondence of the vertices of squares forming the map) . . . 89
4.6 2D maps of pressure distributions averaged over time and for the three subjects with the elastic bandage during a) sitting, b) standing, c) lying and with the inelastic bandage during d) sitting, e) standing, f) lying, and g) the colormap reference bar is the same for all the case studies. On the side of each map, FSR measurements are reported (mean value and standard deviation for the three subjects). The red asterisk indicates where the t-test between the FSR measurements and the corresponding matrix sensel values produced a p-value<0.05 . . . 90
4.7 Pressure trends from 30 s of dorsiflexion, tiptoe stance alternation, sitting-standing and walking performed by Subject 3 with a) the elastic bandage (Bandage 1) and b) the inelastic bandage (Bandage 2); data from FSR (thin lines) and the corresponding sensels (thick lines) are comparable (RMSE for C point= 4.16, RMSE for B1 point= 7.54, RMSE for B point= 2.76) . . . 93 4.8 a) Pressure trends during dorsiflexion with the elastic bandage for
Sub-ject 1, the 12 curves represent the time-varying mean values for the 12 columns of the matrix, for which pressure values were averaged along the rows, and b) snap-shots of the dynamical matrix display of pressure distribution during the task . . . 94 4.9 Snap-shots of the dynamical matrix display of the pressure distribution,
with Subject 1 performing a tiptoe task: a) with the elastic bandage (Bandage 1) during standing (on the left) and keeping a tiptoe stance (on the right); b) with the inelastic bandage (Bandage 2) during standing (on the left) and keeping a tiptoe stance (on the right) . . . 94 5.1 Laryngoscope insertion during a neonatal intubation procedure (from
[17]); red segments indicate points sensorized with Force Sensing Resis-tors, while the green one indicates the tongue that has been sensorized with a textile pressure sensors . . . 102 5.2 Calibration curves for the three FSR (R2 > 0.9for all sample types), a,
cin N and b, d in V−1 are the curve fitting parameters . . . 103 5.3 The flexible matrix pressure sensor employed for the tongue sensorization
(measurements are in mm),with sensels positioning at the crossing points of rows and columns of the overlapped diagram . . . 106 5.4 Calibration curves for the matrix textile sensor: a) mean voltage outputs
for 24 matrix sensels vs applied static loads (from 0 to 200 N), and b) standard deviations (SD, expressed as a percentage) of the single sensel outputs with respect to the mean calibration curve vs applied static loads 107
5.5 The sensorized tongue: a) the commercial tongue from Laerdal®
Neona-tal Intubation Trainer (measurements are in mm) employed as a model, b) CAD model for silicone molding, c) part of the epoxy resin custom mold, both internal and external components, and d) the final prototype of the silicone tongue embedding the matrix sensor (including the thin cables of 0.15 mm diameter) . . . 108 5.6 Integration phases of the sensorized mannequin: a) The FSR force sensor
fixed on the epiglottis, by exploiting the external surface of the airway structure, b) the sensorized home-made silicone tongue prototype was fixed into the airway structure and then into the complete mannequin structure, and c) the sensorized Laerdal® Neonatal Intubation Trainer
connected to a laptop. Hardware components for signal conditioning and acquisition were lodged in a proper case that can be placed under the base of the skill trainer . . . 109 5.7 The GUI for data management. The larger top image is the map of the
pressure applied on the tongue, while the three scatter plots are the force vs time trends for the FSR sensors attached on the superior arch, the inferior arch and the epiglottis, respectively; red lines are the pre-defined damage thresholds for the three critical points . . . 110 5.8 Map of the 24 sensels of the sensorized tongue, distributed from the
bottom (the side towards the epiglottis) to the top (the side at the tip of the tongue), obtained from an acquisition frame during an intubation practiced by a trainee; areas within thicker squares are the most stressed ones . . . 113 5.9 Boxplots of parameters under statistical analysis. Results from the 9
subjects are grouped for the three trials . . . 114 6.1 a) The Reading Palate by Rose Medical Solutions Ltd, branded as
Lin-guaGraph [18] and b) the general scheme of the EPG tool placed into the patient’s mouth and then connected to the acquisition circuitry and to the PC for the recording and displaying of palatograms . . . 121
6.2 The three layers structure of the single sensing units: a) a photo and b) schematic representations . . . 125 6.3 Data from the calibration of the single sensing unit. Fitting parameters
in the table are related to Eq. 6.1 (R2∼0.99) . . . 126
6.4 Load/unload curves averaged on ten cycles for the four loading rates . . 127 6.5 Measured pressure during the high loading rate test . . . 128 6.6 CAD scheme a) and images b) of the two parts of the electropalatograph,
with samples of piezoelectric fabric stripes that are sewn on the two sides of the dielectric layers. Holes of the sensing units and anchoring points for the stripes sewing are highlighted . . . 129 6.7 The complete system with the two dielectric parts sewn together and the
three flexible tubes that are sheathing the cables from the fabric stripes 130 6.8 Static calibration curves obtained loading the sensels that are on the
diagonal for both the front and the rear region . . . 131 6.9 Mean calibration curves adopted for the sensels on the front and the
rear region of the electropalatograph and comparison with the calibration curve obtained for the single sensel; fitting parameters are reported in the table . . . 132 6.10 Loads visualization in case of multitouch for the front region . . . 132 6.11 a) The sensor shielded in the latex cover with an overlapped diagram
showing the sensor nodes placement within the prototype, b) the acrylic support obtained from the plaster cast of a volunteer, c) front and d) lat-eral views of the complete prototype with the sensor fixed on the support using a glue-like denture adhesive . . . 133 6.12 a) The volunteer testing the prototype and b) pressures visualization
during the articulation of consonant sounds [t] and [d] compared with corresponding traditional on/off palatograms . . . 133
1.1 Transduction techniques for pressure detection and their relative advan-tages and disadvanadvan-tages, adapted from [19] . . . 17 3.1 Drift errors (in %), averaged over three tests, in correspondence to static
loads (in kP a) applied for 10 min on a 3x3 sensels area of the sensor . . 70 3.2 Hysteresis and accuracy errors (RMSE) for the different loading rates . 73 3.3 Hysteresis and accuracy errors (RMSE) for the different loading rates
obtained with the load/unload fitting . . . 74 4.1 Characteristic dimensions for the three healthy subjects: circumference
values (circ) and location (pos, i.e. distance from the leg axis origin, see Figure 4.2b) of the C, B1, B points and total leg length (from the below knee to the medial malleolus) (all the values are expressed in mm) . . . 85 4.2 Drift errors (in %), averaged over three tests, in relation to static loads
(in mmHg) applied for 5 min on a square area of the sensor (110x110 mm2) . . . 87 4.3 SSI values, calculated as the difference between the interface pressure
when standing and lying (mmHg) divided by 1 cm and measured at the B1 level, for both bandages and for the three volunteers . . . 91 4.4 Maximum and minimum pressure values at the points C, B1 and B, for
the five daily life tasks performed with both bandage types; mean values and SDs are averaged over the three subjects. In square brackets, the corresponding measurements are reported for FSR C, FSR B1 and FSR B 95 4.5 The main devices employed for compression therapy monitoring . . . . 97
5.1 Repeatability, hysteresis and accuracy errors of the three FSR sensors . 104 5.2 Median values and range intervals (RI), expressed in N, of the forces
applied on the superior and inferior gingival arch and on the epiglottis during tests . . . 112 5.3 Forces and areas of the applied pressure on the sensorized tongue,
ex-pressed in terms of median values and range intervals (RI) obtained considering the three trials of the 9 subjects . . . 112 5.4 Intubation times (in s) for the three attempts, with median values and
range intervals (RI) reported for the 9 subjects . . . 113 6.1 Hysteresis and accuracy performances for the single sensing unit . . . 127
Pressure mapping with smart textiles
The study of pressure distribution over a defined surface is a subject matter of great interest in many fields as biomedical measurements, HMI devices and industrial au-tomation [2]. Robotics is one of the domain where this research is more prolific, for assuring a safer interaction between human and robots in a possibly unstructured en-vironment. Robotics actually aims to identify sensors able to provide complete haptic sensing (including texture, shape, temperature, vibration, softness, shear and normal forces information), however pressure is an important feature commonly acquired by the physical touch. In effect, most of sensing solutions presented as tactile or haptic interfaces share principles of pressure transduction. Arrays of force sensors of different configurations have been used also for a wide variety of medical applications as manage-ment of diabetic foot and pressure sores, gait analysis, optimization of the positioning of the neurologically compromised people, breast cancer detection, orthopedic and dental prosthesis research and fitting. Pressure information can also be useful in areas such as ergonomics, biometrics and virtual reality.
A large amount of different types of sensors have already been proposed for the afore-said applications, mainly relying on the capacitive, optical, piezoelectric and piezoresis-tive transduction principle. Piezoresispiezoresis-tive sensors, sometimes referred as force sensing resistors (FSR), are among the most widely used, because of their robustness, ability to measure both static and dynamic loads, low susceptibility to noise, and simplicity of the conditioning circuitry. The basic principle of this type of sensor is the change of electrical resistance with pressure of a material placed between two electrodes. A
ble solution to implement a pressure sensitive resistor is using conductive materials (e.g. polymers or semi-conductive inks) in a grid pattern with the resistance measurements being taken at the point of intersection, called sensel.
Since commonly employed commercial products tend to be expensive and applica-tion specific, it would be worthwhile to develop a thin, versatile and flexible sensing device, free from geometry constraints, stretchable and able to perform multi-touch de-tection. For these reasons numerous recent research studies have been aimed to obtain sensing solutions based on the same working principle, but low-cost and versatile from the point of view both of hardware (e.g. shape and dimension) and software (e.g. di-rect management of data reading and resolution settings). In addition, the increasing need for large area pressure sensors is making their performance requests even more de-manding. They are asked to be not only thin and pliable, as polyester- and PCB-based products are, but also flexible and attachable over curved and narrow surfaces, like robotic joints and fingers. They also have to be customizable, suitable to be embedded in wearable systems and possibly achievable with affordable technologies.
The latest class of smart textiles is a promising candidate to meet the above men-tioned conditions, making the manufacturing of lightweight, soft and low cost sensors possible [10]. Smart textiles are fabrics that can sense and react to mechanical, thermic, chemical, magnetic and electric stimuli, by means of extrinsic and intrinsic modifica-tions. In the last years the development of conductive/piezoresistive fabrics has been a common research topic in the areas of chemistry and smart materials, leading to widespread commercial products. To date, conductive/piezoresistive textiles are em-ployed to develop a wide group of Smart Fabrics Tranducers (SFT), e.g. actuators, energy harvesting solutions and sensors. Specifically, force/pressure sensors can be founded upon different concepts, among which the matrix-based approach inspired by Tekscan products (Tekscan, Inc, MA, USA) is rated.
In this framework, the aim of the present thesis has been an analysis of possible smart solutions for both contact and pressure sensors that can be manufactured with commercial conductive/piezoresistive fabrics. In particular, the study of matrix multi-layer textile sensors has been carried out. The second part of the thesis involved the use of matrix fabric sensors in three different biomedical applications that can actually
benefit from their properties (i.e. flexibility, thinness, lightness, wearability, streatch-ability, customizability of shape, dimension and resolution). For each application, the proper sensor design was studied considering the specific requirements. Development, testing and data analysis phases were carried out.
Chapters organization
This thesis is devoted to the design, development and employment of textile sensors for pressure mapping and it is divided into chapters.
• Chapter one presents a general discussion on the state of the art of interface pressure measurements, it means the detection of the pressure at the contact surface between two bodies. The aim is to highlight the fundamental domains that make use of pressure profiles and the mainly employed detecting principles. A final part is dedicated to the smart fabrics description, focusing on their potentialities for the manufacturing of a wide class of transducers and sensors.
• Chapter two describes the development of two textile interactive devices able to perform touch detection, thus neglecting the pressure information, that can be employed for study and therapy protocols. The former prototype is composed of a mat and a sensorized puppet for the stimulation of social interaction in infants with Autism Spectrum Disorders (ASD), while the latter is a wall mat useful for active aging exercises for elderly people.
• Chapter three is one of the main chapters composing the core part of the the-sis. It describes the design, development and characterization of a rectangular-shaped textile matrix sensor, composed of two external fabric layers with a further piezoresistive fabric layer (EeonTexTMLG-SL-PA, Eeonyx Corp., Pinole, CA, US)
interposed between the former ones. The two external layers consisted of a non-conductive textile on which parallel non-conductive stripes were obtained by sewing multiple copper threads, so that a pattern of alternate conductive and insulating bands was created. The stripes of each layer were oriented at 90° with respect to the stripes of the other layer. Thanks to this arrangement, the sensing units, called
sensels, were placed at each intersection of rows and columns. Thus, the pressure measurements were obtained by evaluating the resistance changes for each sensel: when the fabrics were compressed near the crossing point, the electrical resistance of the interposed piezoresistive layer decreased proportionally to the applied pres-sure values. The electric meapres-surement of the sensels was achieved according to a powering/reading scanning sequence based on possible circuital solutions that are reviewed in the text. The developed sensor was characterized in both static and dynamic conditions and also under stretch and fixed on curved surfaces. This study was accomplished to obtain a complete metrological overview of the sensor, which is fundamental for managing it with a deeper awareness of both its benefits and drawbacks.
• Chapter four is about the measurement of the pressure that is applied at the level of the lower leg in case of compression therapy, that is the cornerstone of treatment for venous leg ulcers. To date, pressure monitoring has been carried out using sensors that present considerable drawbacks, such as single point in-stead of distributed sensing, no shape conformability, bulkiness, and constraints on the patient’s movements. In this thesis, matrix textile sensing technologies were explored in terms of their ability to measure the sub-bandage pressure with a suitable temporal and spatial resolution. A multilayer textile matrix based on a piezoresistive sensing principle was developed, calibrated and tested with human subjects using two different bandage types, with the aim of assessing real-time distributed pressure sensing at the skin/bandage interface.
• Chapter five describes the technical development and the pre-clinical validation of a sensorized neonatal intubation skill trainer able to provide objective feedback for the improvement of clinical competences required for such a delicate proce-dure. The commercial Laerdal® Neonatal Intubation Trainer was modified by
applying pressure sensors on areas that are mainly subject to stress and potential injuries. Punctual Force Sensing Resistors (FSR) were characterized and fixed on the external side of the airway structure on the dental arches and epiglottis of the mannequin. A custom silicone tongue was designed and developed to integrate a
matrix textile sensor for mapping the pressure applied on its whole surface. More-over, the assessment of the developed tool was performed by nine clinical experts who were asked to practice three intubation procedures apiece.
• Chapter six presents the development of a device for electropalatography (EPG), a clinical technique used to monitor contacts between the tongue and hard palate, to promote correct articulation mechanism. Actually employed commercial tools show a good resolution but they are not able to measure the contact pressure. For this reason matrix textile sensing technologies were employed to manufacture an innovative tool able to maintain the proper spatial resolution and perform pressure detection at the same time. For this application the matrix structure was obtained with stripes of piezoresistive textile divided by a thin dielectric layer with a number of holes arranged according to the traditional tools contact points topography. The prototype was embedded in a latex mold and fixed on a hard acrylic palate. The system was tested on one healthy subject, confirming the adequacy of the solution for the aim.
• Last chapter explains the conclusion of the work, reporting the main results ob-tained, a critical discussion of the proposed sensors, the advantages of the approach and the possible drawbacks.
Interface pressure measurements:
state of the art
1.1
Introduction to pressure mapping applications
In many practical situations of modern daily lives, having information regarding the pressure distribution on a defined surface, often denoted as interface pressure, is a matter of paramount importance. Industry, in particular the one associated to car assembly, robotics and biomedical engineering are the main fields that benefit from this type of information [2, 19, 6, 20, 21].
Nowadays a wide number of commercial and research products have been de-veloped as sensitive thin skins that are able to adapt their properties and per-formances according to the specific application. The fundamental domains that make use of force profiles are described in the following sections.
1.1.1 Human-machine interfaces
Touch screens are basic examples of human-machine interfaces that are present in all the smart devices we are using in everyday lives. They are generally quite simple from the point of view of the sensing hardware components, since they usually provide only contact information. However touch screens require a con-troller with processing capability to run the software for determining the point of
contact [2].
The best quality touch screen monitors rely on the surface acoustic waves sensing [22]. Two transducers (one receiving and one sending) are placed along the two axes of the monitor glass surface, together with reflectors of the electrical signal that is sent from one transducer to the other. When the user touches the glass plate, his/her finger absorbs some of the energy of the acoustic wave and therefore the receiving transducer is able to detect and locate the contact point. Since they are made of glass, SAW touch screens are durable and can work even if scratched. However they are not efficient for drawing and dragging and do not allow multitouch detection, i.e. simultaneous detection of touches in different points of the screen.
Capacitive-based sensors using In-Plane Switching (IPS) technology are the more common solutions for TV, tablet computers, and smartphones [23]. IPS is a screen technology for liquid crystal displays (LCD), designed to solve the main limitations of the twisted nematic field effect (TN) matrix LCD in the late 1980s. Recently, also flexible and inexpensive multitouch input devices based on a newly developed pressure-sensing principle called Interpolating Force Sensitive Resistance (IFSR) [1] have been developed and named UnMousePads (Figure 1.1). IFSR sensors can acquire high-quality anti-aliased pressure images at high frame rates. They can be paper-thin, flexible, and transparent and can easily be scaled to fit on a portable device or to cover an entire table, floor or wall. They are able to detect three orders of magnitude of pressure variation, and can be used to distinguish multiple fingertip touches while simultaneously tracking pens.
Figure 1.1: The resulting force image on an UnMousePad (warmer colors represent greater pressure) [1]
Smart skins can also be used to improve the human-computer interaction in virtual reality applications or in computer games [24]. Thanks to pressure map-ping devices it is possible to gather information from multiple users at the same time regarding their direction and dynamics of motion. These solutions provide opportunities for training in dancing, boxing or virtual combating. Pressure in-formation can be useful also in in novel areas such as biometrics and ubiquitous computing in smart floors and objects in smart home environments [24].
1.1.2 Ergonomics and sport
Measuring interface pressure for hand, finger gripping, and seating is a com-mon practice to assess comfort and design in commercial objects [25, 26]. For instance, a widespread challenge faced by companies is the ergonomic grip assess-ment with thin pressure sensors, in order to maximize efficiency and performance of employees while making tasks, jobs, and products compatible with human ca-pabilities and needs. To this aim, interface pressure sensors can be used to identify and examine forces and pressure felt by each finger, the thumb and palm while grasping, moving, lifting, and using objects, for improving product design and/or optimizing employees’ performances [27].
Pressure information can be also helpful to design comfortable fitting head-phones, determine proper sealing pressures between the perimeter of a gas mask and a person’s face, measure dynamic forces acting between a hip protector pad and the user’s hip, evaluate the comfort and design of mattresses and car seats [4, 28].
Furthermore, force sensors enable sports and fitness devices with real-time force feedback resulting in a smart, wearable device or monitoring system: cus-tom sensors are integrated into various sports and fitness products for concussion detection, fitness training and evaluation of the skills of professional athletes. Measurement and analysis of grip force have been studied in a number of sports, including tennis, cricket, baseball, and golf [29].
1.1.3 Industry
Industrial applications of commercial pressure mapping sensors are particularly widespread in the car industry [4, 30, 31]: analysis of the contact pressure between a door and the rubber seal on a vehicle, measurement of the dynamic forces acting between a brake pad and rotor, evaluation of the coil spring pressure distribution, measurement of the pressure distribution of a seat belt against the body, static and dynamic tire footprint pressure profiles and design of automotive seats (Figure 1.2) are just a few of the possible pressure information involvements. Pressure analysis is also evaluated to improve electrical components and semiconductor production and use, as for measuring the contact pressure between a heat sink and a heat source or between a semiconductor wafer and the polishing head.
Other industrial applications are related to printing [32], to the aerospace and civil engineering [33] and to the agriculture and food processing field [19].
Figure 1.2: A car seat with Tekscan, Inc. tactile sensors on the left, a pressure map of the driver before and during the application of the brakes on the right [2]
1.1.4 Robotics
Robotics is one of the domain where interface pressure measurement research is more prolific, for assuring a safer interaction between human and robots in a possibly unstructured environment [20, 21]. Actually, the main challenge of robotic engineers is furnishing manipulators with the complete sense of touch,
using so-called tactile sensors or artificial skins.
Tactile sensors are a class of sensors acquiring the so called haptic informa-tion through physical touch. A tactile sensor may measure one or more of these properties: texture, shape, composition, temperature, vibration, softness, shear and normal forces. Although pressure and torque sensing is often not included in the definition of tactile sensing, pressure and torque are important features typi-cally acquired by physical touch. Actually, most of sensing solutions presented as tactile or haptic interfaces share principles of normal force transduction.
The pressure sensors for robotic applications have special requirements, espe-cially regarding size: the sensing surface has to be small (from 1 m2 to 1 mm2 or
even less), but the number of sensing points (usually called taxels or sensels in analogy to a pixel -picture element- in an image sensing array) in such a small area should be high (from tens to tens of thousand). These requirements point out the need to implement such pressure sensors as arrays of sensors manufac-tured using special techniques. Methods for achieving these and other objectives are explained in [21] where the authors show a detailed robot tactile sensing clas-sification. Two of the main examples obtained using commercial products are the robotic hand from Barrett Technologies, Inc. [34] and the capacitive tactile sensors from Pressure Profile Systems, Inc. (PPS) [35, 36].
Optical sensors, based on the optical waveguide transduction method, have also been used to provide robot arms with tactile and haptic perception. An robot arm equipped with an optical three-axis tactile sensor is reported in [37]. SynTouch, LLC is one of the main companies working on tactile sensors for a complete em-ulation of the fingers sense of touch. Its most impressive result is the so-called biomimetic BioTac sensor that integrates temperature, force and vibration sens-ing capabilities ussens-ing a thermistor, a set of impedance senssens-ing electrodes and a hydrophone, respectively [38, 39]. BioTac sensors are available both as an evalu-ation kit and as kits for the hands by Barrett, Inc. and Shadow Robot Company Ltd [40], showed in Figure 1.3.
Robots provided with haptic information are used in medical surgery and their tactile capabilities can be used both to transmit the surgeon information of the
Figure 1.3: a) Picture and design scheme of the SynTouchBioTac tactile sensor; b) the Barrett, Inc. hand on the left and the Shadow Robot Company Ltd hand on the right, both equipped with SynTouchBioTac tactile sensor [2]
instrument-patient interface and to "feel" organs and tissues, thus replacing the human sense of touch. In addition, service robots furnished with haptic abilities can be employed for fruit picking in the agriculture and food processing field.
1.1.5 Biomedical engineering
Arrays of force sensors of different configurations have been used also for an incredibly wide variety of medical applications [2, 19], from robotic surgery and drug delivery systems to orthopedics and physical therapy devices. There are a lot of patented products on the market and in the research field that have been specifically designed for specific aims.
First of all, minimal invasive surgery (MIS) benefits from an haptic feedback from sensorized tools [41]. Having a complete tactile feedback for the laparoscopic tools would enable the analysis of tissue characteristics and pathological condi-tions, maintaining the same time reduced anatomical openings and also improving remote-control manipulation of instruments. Similarly, force feedback permits
col-lision detection with rigid structures but does not prevent damage to soft tissues or tearing of sutures and it reduces the force applied for suture sewing. Also the Vinci surgical system by Intuitive Surgical, Inc. (the only master-slave MIS sys-tem approved by US Food and Drug Administration), that has been successfully used in the last years for general, urological, gynecological, thoracoscopic, and thoracoscopically assisted cardiotomy procedures, provides force feedback also if it lacks feedback of tactile sensation [42].
Pressure mapping is used also to optimize medical devices functionality and it is employed by engineers and researchers throughout the medical device indus-try to develop innovative tools and assess product quality, ergonomics, and even manufacturing equipment, as for instance laparoscopic surgical gripper tools.
Arrays of tactile sensors have been used for breast cancer detection as an alter-native to ultrasound based systems, mammography, and other complex systems [43]. An example of capacitive-based palpation imaging system for clinical breast examination is device called SureTouch by Medical Tactile Inc. that has demon-strated better sensitivity than the human hand in indicating breast tumors during clinical examination described in [44].
Gait analysis can also benefit from pressure sensors use, in particular employing in-shoe sensor developed for providing information regarding the symmetry in foot function during gait. Asymmetry in foot function during gait can generate undesired torque and stress components that, over-time, place wear and tear on body tissues and can potentially cause symptoms of discomfort and pain [45, 46]. Commercial products like F-Scan and iShoe insoles and MatScan® pressure mat
by Tekscan, Inc. are commonly used by doctors to analyze patients’ gait [4], and in particular the force distribution on their foot, in order to increase their comfort level while walking, decrease lower back and chronic knee pain, prevent falls and assess balance problems.
An interesting pressure-sensitive foot insole for real-time monitoring of plantar pressure distribution during walking based on an optoelectronic technology was developed at Scuola Superiore Sant’Anna [3]. The device consisted of a flexi-ble insole with 64 pressure-sensitive elements and an integrated electronic board
for high-frequency data acquisition, pre-filtering, and wireless transmission to a remote data computing/storing unit. The transduction unit was made of of in-dependent silicone cells that had the shape of a pyramidal frustum with a square basis and an internal central curtain(Figure 1.4). Each cell covered a light emitter and a light receiver diodes, soldered on the PCB. The light emitter was a high-luminosity green LED and the receiver was an ambient-light photodiode equipped with an embedded temperature-compensation circuit. The sensor worked as a force-to-voltage transducer: when a load was applied on the top surface of the cover, the silicone bulk deformed itself and the curtain gradually closed the light path between the emitter and the receiver, and thus the output voltage changed.
Figure 1.4: Overview of the system architecture of the pressure-sensitive foot insole developed at the Scuola Superiore Sant’Anna, b) representation of the sensitive element and its functioning principle, c) components of the device: sensorized insole connected to the electronic board through flat cables, Bluetooth transmitter, Li-Ion battery [3]
Pressure sensing has been commercially introduced to evaluate dental implants and for digital occlusal analysis to create long-lasting restorations, control bite forces during full mouth restorations and protect veneers during orthodontic treat-ment [47]. Force sensitive bed monitoring for the elderly is the cornerstone of methods to prevent bed shores incidence and promote healing, allowing clinicians to screen areas for potential ulcers, display peak pressure profiles and contact area [48]. Main commercial products for the aim are by Tekscan, Inc. (COMFORTMat
System®and Body Pressure Measurement System®, see Figure 1.5) [4], Pressure
Profile Systems, Inc. [35] and Sensor Products, Inc. (Tactilus®Bodyfitter®) [49].
Figure 1.5: a) Seating pressure profile with Tekscan’s CONFORMat System®, b) full
body pressure measurement profile with Tekscan’s Body Pressure Measurement System (BPMS) [4]
Interface pressure sensing is exploited also for the sensorization of medical devices and simulators for clinical training. A commercial example is the Mam-maCare PAD system by Tekscan, Inc. that is a training platform comprised of tactually accurate breast models and instrumented with force sensors. It is em-ployed to teach health professionals to perform effective breast palpation [4].
Mannequins for cardiopulmonary resuscitation training can be provided with pressure sensor on the chest and on the soft tissues of the mouth for avoiding damages caused by excessive forces applied during chest compression and intuba-tion [50]. Pressure distribuintuba-tion provides important informaintuba-tion in case of pressure garments employment, since the application of a correct pressure on skin
por-tions is useful for the treatment of scars, ulcers and muscle pain after training [51, 52, 53]. Orthotic and orthopedic prosthesis research and fitting benefits from determining loading forces, pressures, and contact areas at the joint interfaces, in order to provide data for dynamic and finite stress analysis, study implant design and articulating joints, view and assess the impact of various joint compartment geometries and materials [54, 55, 56]. Pressure mapping finds space also in a variety of different veterinary applications [57].
As a conclusion, the possible applications of pressure interface monitoring are impossible to count in an exhaustive manner, being limited only by imagination.
1.2
Detecting principles for pressure sensing
A large amount of different types of sensors have already been proposed for the aforesaid applications, mainly relying on the capacitive, optical, piezoelectric and piezoresistive detecting principles. According to recent comprehensive reviews [20, 21] main requirements are flexibility and enhanced stretch capabilities. Flexible tactile sensors are currently available based on different transduction methods, but stretch capability is less common. Other requirements include simple mounting or adhesion mechanism, minimal wiring, temperature independence, low cost and well established fabrication techniques.
Typically, pressure sensing solutions are based on a matrix of sensing cells, called taxels or sensels, working according to a particular transduction method. Each of them has its own advantages and disadvantages, which are well established [58] and summarized in Table 1.1 and explained in the following sections. In spite of the variety of technical solutions currently used to implement pressure mapping sensors, we mention here just those that are more common or more promising. 1.2.1 Mechanical deformation-based sensors
Mechanical deformation based sensors, or strain gauges, consist of a structure that elastically deforms when subject to a force which in turn leads to a change in its resistance. To optimise the change in resistance due to applied mechanical
Type Modulated parameter Advantages Disadvantages
resistance
-low cost - hysteresis mechanical -realized as MEMS -non linearity deformation-based -easy to integrate -temperature and
in PDMS layers humidity susceptibility
capacitive capacitance
-excellent sensitivity -hysteresis
-large dynamic range -complex electronics -good spatial resolution -noise susceptibility
piezoelectric stress polarization
-high frequency response -dynamic sensing only -high sensitivity -temperature sensitivity -high dynamic range -poor spatial resolution
optical light intensity/spectrum
-good sensing range -bulkiness
-high spatial resolution -high power consumption -immunity from EMI -fragility
magnetic magnetic field
-high sensing range -sensitivity to EMI -good dynamic range -bulkiness
-physical robustness -high power consumption chemical burst-bubble -large area sensing -difficult to calibrate reaction-based mechanism -based on image analysis -single use
piezoresistive resistance
-good sensitivity -hysteresis -low noise -non linearity -simple electronics -drift
-high spatial resolution -temperature sensitivity
Table 1.1: Transduction techniques for pressure detection and their relative advantages and disadvantages, adapted from [19]
stress, strain gauges are typically long winding snakelike structures. In this way, when deformed, the cross-section of the strain gauge decreases while its conduction length increases. Here, typically, the change in resistance of the strain gauge material itself is secondary to the change due to its mechanical deformation.
Strain gauges can be employed to design pressure sensing units [59]. They are made either from resistive elements or from semiconducting materials and bonded to the stressed material. Since they are very sensitive and highly susceptible to humidity and temperature changes, strain gauges are often used with a
condi-tioning circuit that includes a Wheatstone bridge followed by an amplification stage. Due to their mechanical nature, they have high hysteresis and often are non-linear in response. Strain gauge development is currently optimized through the use of micromachined fabrication techniques, to be directly integrated with readout electronics and other microelectromechanical systems (MEMS) elements. In order to develop flexible strain gauge sensors skins that should be adaptable on curved surfaces, silicon-based or metallic strain gauges can be adapted on flex-ible printed circuit boards [60] or on flexflex-ible polyimide films and covered with polydimethylsiloxane (PDMS) layers [61].
1.2.2 Capacitive sensors
A capacitive sensel is a capacitor whose capacitance changes with the applied force. A capacitive sensor consists of two conductive plates with a dielectric material sandwiched between them. The applied force can cause either the change in the distance between capacitor plates or in its area, modifying the capacitance. To measure the variation, several conditioning circuits can be used depending also on the type of the desired output signal.
Capacitive tactile sensors are considered one of the most sensitive in the field. In addition, they seem to be temperature independent and they generally exhibit a good frequency response, high spatial resolution, shear sensitivity and have a large dynamic range. However, these sensors are more susceptible to noise, es-pecially in a matrix configurations because of crosstalk noise. They suffer from severe hysteresis and require relatively complex electronics to filter out this noise: careful and dedicated conditioning circuitry is required to take advantage of the excellent sensitivity and repeatability achieved by some of their implementations. Another disadvantage of capacitive sensing is its susceptibility to parasitic capac-itance. Several designs have emerged specifically for the robotic skin application, especially relying on MEMS and silicon micromachining [62]. In particular, a capacitive sensor manufactured using photolithography on a flexible substrate is presented in [63, 64, 65]. There are also commercially available capacitive-based touch sensors such as RoboTouch and DigiTacts from Pressure Profile Systems,
Inc. [35]. Commercial products like iPodtouch by Apple, Inc. also use capacitive touch sensing.
1.2.3 Piezoelectric sensors
Piezoelectric sensors are made of crystal materials like quartz, ceramics and polymers showing piezoelectric properties. This means that those materials pro-duce a voltage potential when the crystal lattice is deformed. The sensitivity of the crystal depends on its structure, allowing it to distinguish between transverse, longitudinal and shear forces. The generated voltage is directly proportional to the applied force, pressure or strain. Polymer polyvinylidene fluoride (PVDF) and ceramic lead zirconium titanate (PZT) are the mainly used materials for their me-chanical flexibility, high piezoelectric coefficients, dimensional stability, low weight and chemical inertness.
In tactile sensing applications, the sensel is obtained by applying a thin layer of metallization to both sides of the piezoelectric material, constituting a parallel plate capacitor. Its conditioning circuit is based on ultra-high input impedance amplifiers and the bandwidth of the circuit does not go down to DC, which means that piezoelectric transducers are not adequate for static force transduction but just for detecting dynamic forces. This problem can be overcome by vibrating the sensor and detecting the difference in the vibration frequency due to the applied force [66], however they are preferably employed as switches.
In [67], PVDF film sensors were fabricated separately and embedded into a silicone layer that was moulded onto a robotic fingertip. In [68], the sensor system was further developed into a prototype for tactile skin for flat areas such as the palm of the hand. It showed potential for biomimetic artificial skin, with the ability to sense texture and forces. However, the sensor suffered from several limitations, as the fabrication constraints when moving to larger areas such a full anthropomorphic hand and the pyroelectric effect which required continuous compensation based on the temperature.
1.2.4 Optical sensors
Optical sensors employ a light source, a transduction medium and a photode-tector, the latter often in the form of a camera or a photodiode. Their operating principles include modulation by the applied force of the transmitted light in-tensity, phase, or polarization and interaction of the applied force with the light external to the primary light path. In robotic tactile sensing, the optical sensor is generally based on intensity measurement because of its simplicity of construction, signal conditioning and information processing. Moreover, optical sensors have high spatial resolution and low susceptibility to electromagnetic noise, intrinsi-cally safety and low electrical wire demand. Although they have many benefits, optical sensors do not allow a great spatial sensitivity and are bulky in terms of thickness. Their size and rigidness are the major disadvantages. Camera-based tactile sensors require considerable processing power but give a wide ranging fre-quency response.
Prototypes of optical sensors are often composed of glass or Plastic Optical Fibers (POF) in conjunction with an LED and a Charge Coupled Device (CCD) camera, and forces are detected on the base of a change in the reflective wave-length. In this case optical fibers are not used just for light transmission, but as the sensor itself. The idea is that, when a mechanical bend or perturbation (of the order of few microns) is applied to the outer surface of the fiber, the light is attenuated in the core. The attenuation depends not only on the radius of curvature and spatial wavelength of the bend but also on the fiber parameters. Generally, the main disadvantages that incurred when using optoelectronics are micro-bending and fragility. POF-based microbending optical fiber sensors were presented in [69, 70].
1.2.5 Magnetic sensors
Pressure sensors based on magnetic transduction measure the change in flux density, magnetic induction of an inductor or magnetic coupling between circuits, caused by applied force on a small magnet. The flux measurement can be made
by either a Hall Effect or a magneto resistive device, it means a device whose magnetic properties are force dependent, or a magnetoelastic material [71].
Magnetorestrictive or magnetoelastic based pressure sensors may have some positive characteristics, namely high sensitivity, wide dynamic range, no mea-surable mechanical hysteresis, a linear response and physical robustness. Never-theless, a few tactile sensors that use the magnetic mode of transduction have been reported in literature, since they still are not a valuable alternative to the above-mentioned types of tactile sensors. The major drawback of magnetic based tactile sensors is the fact that they cannot be used in a magnetic medium and they involve complex computations.
1.2.6 Chemical reaction-based sensors
An interesting commercial product for pressure mapping is the Fuji Prescale pressure-sensitive film by Sensor Products, Inc. [49, 72], which is a chemically reactive sheet based on a burst-bubble mechanism.
The Fuji Prescale pressure sensitive film is composed of two parts: an A-film and a C-film, both having an active coating on a polymer substrate. Layers of the two films are cut and placed together, with their active surfaces that are put in contact before the insertion on the interface under test. The active surface of the A-film consists of microscopic bubbles adhered to the substrate, within which is encapsulated a transparent liquid. If a pressure is applied on the two layers a number of bubbles will be burst, depending on the pressure magnitude. The active surface of the C-film contains a medium which reacts with the liquid released from the A-film, producing a characteristic pink stain. The optical density of the stain is related to the amount of dye absorbed at a particular point and therefore to the pressure applied at the point: a higher pressure produces a deeper stain.
The burst-bubble mechanism used by Fuji film results in stains composed of discrete patches of red coloration. Consequently, calibration-stain images consist of a range of pixel values, related to the pressure at which the stain was obtained. The optical density response of the film can be calibrated with respect to the applied pressure, considering that it also depends on temperature, humidity and
loading rate.
The manufacturer provides calibration charts and color samples, which can be used to convert optical-density readings into pressure. These readings are made either visually, or through an optical densitometer. The limitations of this approach are the need for digital imaging techniques, both to calibrate Fuji film response (for temperature, humidity and load-rate effects) and then to convert subsequent test-stains into full-field pressure maps. However, the fundamental and insuperable drawback of this device is the fact that itsf chemical reaction is irreversible.
1.2.7 Piezoresistive sensors
Piezoresistive sensors, sometimes referred as force sensing resistors (FSR), are among the most widely used for pressure mapping. These sensors typically consist of pressure sensitive elements which change their resistance upon the application of forces. In the typical working configuration the current is fixed and a change in resistance is observed by a change in the voltage.
A possible solution to implement a pressure sensitive resistor is using a conduc-tive elastomer or foam or elastomer cords in a grid pattern [73], with the resistance measurements being taken at the point of intersection, called sensel or taxel in analogy to a pixel (picture element) in an image sensing array, as explained in the previous sections.
Piezoresistive sensors take the advantages of robustness, low susceptibility to noise (therefore they are adequate for mesh configurations), ability to measure both static and dynamic loads. In addition, they generally require simple elec-tronics as change in resistance can easily be quantified and therefore they are fairly easy to manufacture and integrate [74, 5].
Resistive tactile sensors suffer from hysteresis and have a lower frequency response when compared to capacitive tactile sensors. Moreover, dedicated strategies have to be applied to reduce crosstalk among sensels in the matrix structures.
Micromachined sensors
Piezoresistors can be obtained using maicromachining techniques, considering that silicon and other semiconductor materials have high piezoresistive responses, also if they are brittle and fragile. Embedding them in an elastomer, as com-monly done with strain gauges, allows for mechanical flexibility even if decreasing sensitivity.
In [75] a silicon-based piezoresistive sensor was embedded directly into a soft fingertip. It was composed of four cross-beams with piezoresistors on its sur-face for detecting longitudinal and shear stresses. After packaging, the sensor chip was moulded into a polyurethane hemisphere representing a fingertip and it demonstrated high accuracy for both pushing (vertical) and sliding (lateral). The direction and magnitude of shear forces were detected by measuring the change in resistance of two perpendicularly placed standing silicon-based cantilevers em-bedded in PDMS. In [76] an emem-bedded tri-axial silicon based piezoresistor sensor was bonded to a flex PCB and then integrated with an optical signal converter forming a flexible optoelectronic system that could be wrapped around a finger. In this way, the amount of wiring and cross-talk could be reduced.
Conductive elastomers and foams
One solution to implement pressure sensitive resistors is using a conductive elastomer or foam or elastomer stripes disposed into a grid pattern, with the resistance measurements considered at the points of intersection. Such sensors have been quite popular because of the simplicity of their design and interface to a robotic system: elastomers are highly stretchable, so they are excellent candidates for application on curved surfaces and moving parts. In addition, the use of a soft material mimics the human skin and increases the grasp quality. On the other side, elastomer-based sensors are affected by a long nonlinear time constant. Moreover, the force-resistance characteristic of elastomer based sensors is highly nonlinear and with severe hysteresis, low dynamic ranges and permanent deformation and fatigue.
when an external force is applied to the sensor deforming the elastomer composite layer, its resistivity changes depending on the type of conductive particles, the re-sulting material stiffness and their volume percentage in the elastomer. Examples are reported in [77, 78].
Conductive fluids
Conductive fluids can be used to develop piezoresistive sensors. An example is reported in [79], where a finger structure mimicking a human finger was presented. The sensor was made of a rigid core with a layer of sensing electrodes on its surface and a weakly conductive fluid was sandwiched between the core and the outer elastomeric skin layer. If the outer layer was pressed, the fluid around the electrodes was deformed, resulting in a change in impedance. The measured impedance provided information about the applied force, the point of contact and object shape.
Conductive polymers
Resistive sensels can also be made of conductive polymers or semi-conductive coatings (inks).
In the first case the polymer is made piezoresistive by adding conductive and non conductive micron particles. Polymer-based sensors are flexible, robust, and can be chemically resistant. They can be manufactured using large area and low cost fabrication techniques such as roll-to-roll fabrication and screen printing [80]. A few conductive polymers and their use in tactile sensing are reviewed in [81]. An example ofpolymeric and mechanically flexible piezoresistive sensor, presented in [82], was made of a porous nylon matrix which is filled with elec-trodeposited polypyrrole. The conductivity of the composite material increased with applied compressive load, and a flexible tactile sensor showed a stable in an applied pressure range of 20 − 600 kP a. In [83] porous polyurethane was turned into conductive and pressure sensitive by polymerisation of pyrrole into the porous matrix. The material showed a linear response to an applied compression force range of 0 − 35 N. In [84] a flexible sensor was developed using a layer of
com-mercially available Velostat by 3M Company [85] that was sandwiched between two polyimide foils provided with electrode patterns.
In [86] Flemion, an ion-polymermetal composite (IPMC), was used as the sens-ing layer of a 3D tactile sensor. The membrane was deposited on a patterned electrode on a PDMS tactile bump. When an external force was applied to the bump, the Flemion layer was deformed causing an internal charge redistribution and hence an output potential. The sensor sensitivity in the normal direction was higher than in the lateral direction.
Ink-based sensors have been developed by Tekscan (Tekscan, Inc, MA, USA) [24, 4], that is the leader in the market of pressure mapping devices. Such sensors consist of two thin and flexible polyester sheets that have electrically conductive electrodes deposited typically in row-column pattern and are sepa-rated by 0 − 35 mm. Before assembly the patented semi-conductive ink is laid by screen-printing technology as an intermediate layer between the electrical con-tacts. Putting the two polyester sheets on the top of each other a grid pattern is formed, creating a sensing location at each intersection (Figure 1.6a). The con-ditioning circuits of resistive-based tactile sensors are fairly simple, which is one of their advantages. This circuitry will be described in detail in the following chapters, since its powering/reading scanning principle has been exploited for the present work . Figure 1.6b shows a 3x3 array of resistive sensels and the circuitry that can be used to implement a matrix pressure transducer.
Piezoresistive materials can be used for pressure mapping measures not only creating a matrix network of sensels that are powered and read according to a defined scheme, but also relying on the principles of the Electrical Impedance Tomography (EIT). This is a non-invasive imaging technique based on inverse problem analysis, used to estimate the internal conductivity distribution of an electrically conductive body by using measurements made only at its boundary. If the conductivity in a region of the body changes, the current distribution also changes and EIT can be used to quantify these differences, providing a tomo-graphic conductivity image of a subject from boundary current-voltage data. EIT techniques can be applied to both 2- dimensional and 3-dimensional bodies to
Figure 1.6: a) The silver conductive leads of a Tekscan, Inc. sensor are oriented on two flexible polyester sheets in a row pattern and a column pattern, with a proprietary pressure-sensitive ink that is applied over these conductors, also in rows and columns [5], and b) the circuital scheme for the powering/reading scanning sequence of the sensor [6]
estimate their internal resistance distribution. They were originally studied for biomedical applications [87], but in the last years they have been finding space in the robotic field [7, 8].
Time difference EIT technique can be used to image conductivity changes in a conductive sheet (it can be both a polymeric layer and a fabric). When pressure is applied to the layer (the boundary is kept in a frame to maintain a fixed boundary and electrode position), the conductivity of the proposed conductive fabric changes with increasing pressure or deformation of the fabric. Pressure induced shape changes over the sensor area produce changes to the conductivity distribution. This leads to the change in current-voltage data in EIT system, which displays the image of the conductivity changes from current-voltage data measured at the boundary of fabric patch. Finally, the pressure distribution could be estimated from the conductivity images (Figure 1.7).
Since most of the sensing area used in an EIT-based sensitive skin is made of a homogeneous thin material without any wiring, a large, flexible and stretch-able skin suitstretch-able to cover small and large areas of varistretch-able three dimensionally contoured bodies can be developed.
However, the technique is incredibly expensive from the point of view of data processing, making real-time imaging very difficult to be obtained. Moreover,
![Table 1.1: Transduction techniques for pressure detection and their relative advantages and disadvantages, adapted from [19]](https://thumb-eu.123doks.com/thumbv2/123dokorg/2927559.18801/41.892.143.783.186.771/transduction-techniques-pressure-detection-relative-advantages-disadvantages-adapted.webp)

![Figure 1.7: a) Equipotential lines during a step of current injection-voltage measurement in EIT, b) sensitive skin applied on an uneven surface [7], and c) images obtained according to conductivity changes with touches (images are from [8])](https://thumb-eu.123doks.com/thumbv2/123dokorg/2927559.18801/51.892.180.737.200.416/figure-equipotential-injection-measurement-sensitive-obtained-according-conductivity.webp)
![Figure 1.8: Schematic representations and images of force sensing resistors by Interlink [9] and Tekscan [4]](https://thumb-eu.123doks.com/thumbv2/123dokorg/2927559.18801/53.892.226.670.183.582/figure-schematic-representations-images-sensing-resistors-interlink-tekscan.webp)
![Figure 1.10: Typical interconnection paths of wefts and warps in wovens (a) and of wales and courses in knits (b) [11]](https://thumb-eu.123doks.com/thumbv2/123dokorg/2927559.18801/55.892.266.642.723.882/figure-typical-interconnection-paths-wefts-warps-wovens-courses.webp)
![Figure 1.12: The three types of conductive threads: a) extruded wires,b) twisted metal wires, and c) yarn with metal coating [12]](https://thumb-eu.123doks.com/thumbv2/123dokorg/2927559.18801/57.892.200.711.479.606/figure-types-conductive-threads-extruded-wires-twisted-coating.webp)