Adjusting the US Current Account Deficit: What role
for the Dollar, Euro and Yen?
Professor S. Collignon,
Harvard University and London School of Economics
Adjusting the US Current Account Deficit: What role for
the Dollar, Euro and Yen?
Stefan Collignon*
Prior to the creation of the euro in 1999, policy-makers frequently expressed their expectation that the new currency would contribute to more stability in the international monetary relations, while some academics warned that the attractiveness of the Euro as an international currency might lead to a massive overvaluation (Portes and Rey, 1998). The experience with the euro exchange rate since its inception has not validated either of these views. The nominal effective exchange rate has become more stable for Japan, unchanged for Euroland and more flexible for the US. The focus of much public debate has been on the bilateral dollar-euro rate, while the yen-euro rate has received less attention. The preoccupation with bilateral dollar rates is understandable, given the US’s dominating position in the world economy. It may also reflect, at least in part, the growing imbalances between the US and the rest of the world and the potential role of the exchange rate in the adjustment process. Avoiding a hard landing for the world economy may require reviewing forms of monetary cooperation in a tri-polar world.
While the strong dollar in 2000 has attenuated the exuberance in the US economy and stimulated Euroland’s economy, its weakness had the opposite effect in recent years. At the same time Asia and, to a lesser extend, Europe supply the savings to the United States that American residents do not generate domestically. While this development
* Harvard University and London School of Economics. An earlier version has been published in
may be a reflex of sluggish growth and consumption in Europe and Japan, it is also caused by current account surpluses and the exchange rate regime on which China and South East Asia have based their development strategy. This strategy has focussed on competitive exchange rates for the integration of their economies into the world market and the related development of domestic productive capacities. Furthermore, by accumulating current account surpluses and financial claims on the rest of the world, these policies are increasing the wealth of net exporting countries. This model has proven successful for Europe and Japan after the second World War, for South East Asian countries in the late eighties and nineties, and more recently for the People 's Republic of China. But it also raises questions with respect to the efficient management of the international economy. Over the last 25 years the US economy has built up excessive liabilities against the rest of the world, with net foreign liabilities amounting to nearly a quarter of GDP. This development may continue as long as non-US residents are willing to invest their wealth in US denominated assets, but it is not likely to last, as investors will diversify their wealth portfolio. The recent weakness of the US dollar with respect to the euro and the yen is sometimes seen as a necessary adjustment process and it may continue in the future. Obstfeld and Rogoff (2004) estimated that the trade-weighted US dollar may require a devaluation of 20% in order to re-establish external equilibrium, but it may overshoot to up to 40%. Furthermore, the main impact on the dollar would come from the global rebalancing of demand. Such adjustment could seriously destabilize the world economy and particularly the Eurozone, where the recent moderate upturn in growth has been heavily dependent on external demand (IMF, 2004). There is therefore a need to find alternative solutions how America could go through the necessary economic adjustment without pushing the rest of the world into a deep economic crisis.
In this paper, I will first look at some structural features of the world economy, namely its three-polar character, the fundamental disequilibrium between the poles and the tensions in the exchange market. I will then turn to policy issues, related to exchange rate regimes, international trade and will conclude with some ideas, which would facilitate the adjustment in the world economy.
I. Structural Features
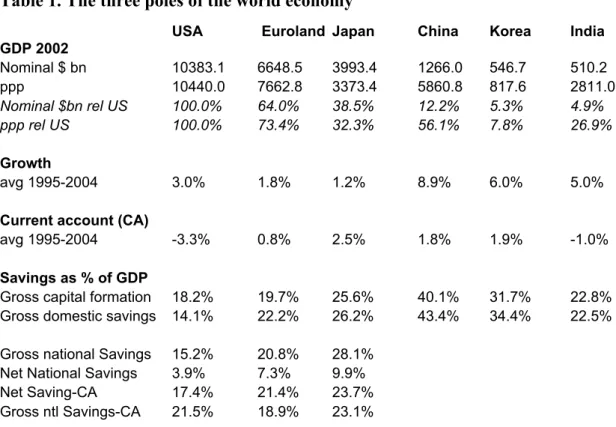
The three polar world economyThe world economy is dominated by three major poles. The Unites States is still the largest economy, closely followed by the European Union and with some distance by Asia. In 2004 US GDP amounted to USD 10383 billion at market exchange rates, while the European Union’s GDP was USD 6648 billion. However, Euroland’s GDP was roughly only two thirds of the United States, while Japan’s USD 3993 billion represented only 38.5% of the US economy. In terms of purchasing power, the European Union was 26% behind the US, and Japan only one third of the US economy. The Chinese economy with USD 1266 billion is equivalent in size to Italy, and Korea with USD 545 billion is comparable to Belgium, Austria and Estonia together. Despite its large population, India’s economy counts for less than Korea. In terms of purchasing power, China represents more than half the US economy and twice the importance of India.
From 1994 to 2004, economic growth in the US did significantly better than in Europe and Japan, while emerging Asia is catching up fast. India’s economy grew by 5%, Korea by 6% per annum, and China even over 8%.
The US, Europe and Asia also dominate international trade. In 2003, the EU’s foreign trade (excluding intra-Europe trade) represented 19% of world trade, the US 17.2% and Japan, China and ASEAN (excluding intra-regional trade) each 5.7%. Korea had an average world market share of 2.5%, and India less than 1%. Thus, emerging Asia has an importance for international trade that is roughly equivalent to Europe and the USA; together these three regions represent nearly 56 percent of world trade.
Table 1. The three poles of the world economy
USA Euroland Japan China Korea India
GDP 2002 Nominal $ bn 10383.1 6648.5 3993.4 1266.0 546.7 510.2 ppp 10440.0 7662.8 3373.4 5860.8 817.6 2811.0 Nominal $bn rel US 100.0% 64.0% 38.5% 12.2% 5.3% 4.9% ppp rel US 100.0% 73.4% 32.3% 56.1% 7.8% 26.9% Growth avg 1995-2004 3.0% 1.8% 1.2% 8.9% 6.0% 5.0%
Current account (CA)
avg 1995-2004 -3.3% 0.8% 2.5% 1.8% 1.9% -1.0%
Savings as % of GDP
Gross capital formation 18.2% 19.7% 25.6% 40.1% 31.7% 22.8% Gross domestic savings 14.1% 22.2% 26.2% 43.4% 34.4% 22.5% Gross national Savings 15.2% 20.8% 28.1%
Net National Savings 3.9% 7.3% 9.9%
Net Saving-CA 17.4% 21.4% 23.7%
Gross ntl Savings-CA 21.5% 18.9% 23.1% Source: World development indicators; AMECO
Financial markets are more developed in the USA and Europe than in Japan or the rest of Asia. The interbank market size is roughly equal in Europe and America, the bond market significantly bigger in euro, but stock market capitalisation is nearly four times higher in the USA. A third of all foreign exchange market transactions take place in the euro-dollar rate.
Table 2. Financial market size
US dollar Euro Yen
Cross border interbank claims
- stock end-March 2004 (bn USD) 6881.7 6333.8 785.2
Bonds and Notes
- stock end-March 2004 (bn USD) 3200.3 5306 283.1
Stock market capitalisation
- bn USD 2003 11,052.4 3,485.1 2,126.1
- percent of GDP 106.4 52.4 53.2
Foreign exchange markets USD/euro USD/ other currencies
- daily turn over 2001 (bn USD) 354 706
- in percent 33% 67%
Thus, to summarise, we find that the world economy is dominated by three major poles of roughly equal size, though America is slightly in the lead and Asia catching up fast. Cooperation between any of these three poles is likely to improve stability in the world economy – or not, if it fails.
The Disequilibrium in the World Economy
Rapid economic growth is financed by high domestic savings or an inflow of foreign savings. Not surprisingly, the high growth performance in China, Korea and other Asian emerging economies is correlated with high domestic savings and investment rates. Yet interestingly, many of these countries also have positive current account balances, i.e. they export domestic savings to acquire assets abroad. Although capital outflow slows down the build-up of the domestic capital stock (which may, however, avoid overheating of domestic demand), by accumulating claims on foreign economies these countries increase their wealth. On the other hand, the United States show very low net domestic savings, but the inflow of foreign savings has financed the high rates of investment and economic growth at least from the mid 1990s until the end of 1999. In 2000 private investment collapsed, and the government budget moved heavily into deficit; again this was largely financed by foreign investors, mainly by central banks. Obstfeld and Rogoff (2004) have calculated that at the end of 2003, foreigners owned 37% of all US Treasuries and during the late 2003/2004, foreign central bank acquisition of Treasuries nearly equalled the entire US current account deficit.
Looking at the medium term performance we notice that these imbalances reflect a deeper structure of the economic world system. The American current account deficit has accumulated a sum of USD 2568 billion from 1990 to 2002 or nearly a third of average US-GDP. Japanese claims on foreign assets over the same time represent USD 1242, (i.e. 30% of Japan’s average GDP). This is half of the US current account and twice the amount of wealth owned by citizens in Euroland. China has accumulated claims worth USD 183.5 billion since 1990, 22% of average GDP. At the same time we notice that the net national savings rate in United States has been less than 4% over the period, although it fell in individual years to less than 1%. Euroland and Japan have been saving more than twice as much. Yet, the sum of net
national savings and foreign savings (the inverse of the current account balance) is remarkably similar in Europe, Japan and US (see Table 1).
Adding national and foreign savings shows that net capital formation is higher in the US than in Europe, but roughly equal to Japan. But nearly half of it is financed by foreign savings, while a third of Japanese net savings are used to accumulate capital abroad. In a rapidly aging society, it may be a reasonable choice to build up foreign assets, but the low level of domestic savings in the US implies that Americans live above their means because foreigners are willing to lend them their savings. As this situation is not sustainable, adjustment will come sooner or later. The question is whether it will throw the world economy into a crisis when US savings go up and demand slows down and the value of the dollar weakens. The answer depends largely on the relation between Europe and Asia, and the exchange rate regime they adopt. Exchange rate volatility in the World
Washington consensus orthodoxy claims that more flexible exchange rate regimes are a good thing. They can mitigate the risk from currency crises that have often characterized pegged exchange rate regimes and thereby improve macroeconomic performance (provided the domestic policy framework is appropriate). Flexibility is a corollary of capital account convertibility and the benefits from floating increase as economies develop and integrate into global financial markets (IMF, 2004). However, many successful emerging market economies have exhibited a “fear of floating” (Calvo and Reinhart, 2002), as they perceive the costs of exchange rate volatility. Although public authorities say they allow their currency to float, mostly they behave differently.
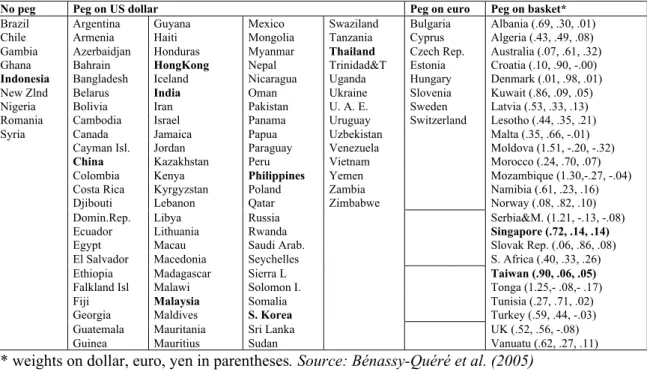
Exchange rate management is not a one-dimensional choice between fixed and flexible rates. The currencies of developed countries with full capital mobility usually show high exchange rate flexibility between each other, while secondary currencies peg against these anchor currencies and reduce bilateral exchange rate volatility. I have called this regime “bloc floating” (Collignon 1999, 2002). In a comprehensive study, Bénassy-Quéré et al. (2005) found that most currencies in the world are de facto pegged to one of the three key currencies (dollar, euro, yen) or to a basket of these currencies. At the daily and weekly horizon, most de facto pegs appear to be against the US dollar, whereas at the monthly horizon, the majority of pegs are against
baskets, although the dollar is generally prominent in basket pegs. Table 3 reproduces their results.
Table 3: Exchange rate pegging, 1999-2004 period (weekly frequency)
No peg Peg on US dollar Peg on euro Peg on basket*
Brazil Argentina Guyana Mexico Swaziland Bulgaria Albania (.69, .30, .01) Chile Armenia Haiti Mongolia Tanzania Cyprus Algeria (.43, .49, .08) Gambia Azerbaidjan Honduras Myanmar Thailand Czech Rep. Australia (.07, .61, .32) Ghana Bahrain HongKong Nepal Trinidad&T Estonia Croatia (.10, .90, -.00) Indonesia Bangladesh Iceland Nicaragua Uganda Hungary Denmark (.01, .98, .01) New Zlnd Belarus India Oman Ukraine Slovenia Kuwait (.86, .09, .05) Nigeria Bolivia Iran Pakistan U. A. E. Sweden Latvia (.53, .33, .13) Romania Cambodia Israel Panama Uruguay Switzerland Lesotho (.44, .35, .21) Syria Canada Jamaica Papua Uzbekistan Malta(.35, .66, -.01)
Cayman Isl. Jordan Paraguay Venezuela Moldova (1.51, -.20, -.32) China Kazakhstan Peru Vietnam Morocco (.24, .70, .07) Colombia Kenya Philippines Yemen Mozambique (1.30,-.27, -.04) Costa Rica Kyrgyzstan Poland Zambia Namibia (.61, .23, .16) Djibouti Lebanon Qatar Zimbabwe Norway (.08, .82, .10) Domin.Rep. Libya Russia Serbia&M. (1.21, -.13, -.08) Ecuador Lithuania Rwanda Singapore (.72, .14, .14) Egypt Macau Saudi Arab. Slovak Rep. (.06, .86, .08) El Salvador Macedonia Seychelles S. Africa (.40, .33, .26) Ethiopia Madagascar Sierra L Taiwan (.90, .06, .05) Falkland Isl Malawi Solomon I. Tonga (1.25,- .08,- .17)
Fiji Malaysia Somalia Tunisia (.27, .71, .02)
Georgia Maldives S. Korea Turkey (.59, .44, -.03) Guatemala Mauritania Sri Lanka UK (.52, .56, -.08)
Guinea Mauritius Sudan Vanuatu (.62, .27, .11)
* weights on dollar, euro, yen in parentheses. Source: Bénassy-Quéré et al. (2005)
Despite occasional interventions, like in 2000, key currencies float freely against each other. Figure 1 shows the rate of change in bilateral exchange rates to the Japanese yen over monthly, yearly, 2 years and 5 years horizons. It is clear that the fluctuations get larger, as the time span increases.
Figure 1: Rates of change in key currencies
100 200 300 100 200 1980 1985 1990 1995 2000 USD euro annual change 1980 1985 1990 1995 2000 -0.1 0.0 0.1 monthly change 1980 1985 1990 1995 2000 -0.25 0.00 0.25 1980 1985 1990 1995 2000 -0.5 0.0 0.5 Yen-dollar exchange rates
change over 2 years
Green = USD Blue = euro 1980 1985 1990 1995 2000
-0.5 0.0
A frequently used measure of volatility is the standard deviation of the monthly change in the exchange rate (Table 4). The mean of this time series indicates the average trend appreciation of the currency. We find that for the 25-year period since 1979, the Japanese yen had a tendency to appreciate 0.22 percent per month against the euro1 and 0.19 percent against the dollar,2 while the euro weakened against the dollar by 0.03 percent per month. Bilateral exchange rate volatility in the short term was highest for the yen-dollar exchange rate and more stable across the Atlantic. This pattern has changed after the start of European monetary union. While the strength of the yen relative to the dollar has remained, the euro has appreciated relative to the dollar by an average 0.12 percent a month over the full 1999 to 2004 period. Yet, while the dollar-euro volatility has hardly changed, volatility between the yen and the euro has risen significantly, but fallen across the Pacific. At the same time the positive correlation between the dollar-euro and the yen-euro exchange rate has become much stronger (the correlation coefficient has risen for the 12-month period from 0.376 to 0.608), indicating greater stability between the yen and the dollar, and more flexibility of both currencies with respect to the euro.
Over the longer time horizon, volatility increases, with greater variances between the three currencies. But this tendency has sharpened for the volatility in the yen-euro exchange rate since the beginning of European monetary union, and has fallen for the yen-dollar rate. Thus, we must conclude that the introduction of the euro has not stabilized key exchange rates for Euroland, but greater stability has prevailed between Asia and the USA.
Table 4. Exchange rate volatility
1979-2004 1991-1997 1999-2004
Mean appreciation (minus sign)
monthly USD/euro -0.03% -0.25% 0.12% Yen/euro -0.22% -0.28% -0.03% Yen/dollar -0.20% -0.04% -0.15% quarterly USD/euro -0.05% -0.48% 0.25% Yen/euro -0.46% -0.55% -0.10% Yen/dollar -0.40% -0.07% -0.35% 6mth USD/euro -0.13% -0.91% 0.32% Yen/euro -0.96% -1.23% -0.55%
1 We use the virtual exchange rate provided by the ECB before 1999.
Yen/dollar -0.83% -0.32% -0.87% 12mth USD/euro -0.43% -1.55% 0.62% Yen/euro -2.33% -3.38% -1.68% Yen/dollar -1.91% -1.83% -2.30% 24 mth USD/euro -1.77% -0.09% -0.87% Yen/euro -6.59% -5.33% -3.55% Yen/dollar -4.82% -5.24% -2.68%
Volatility Standard deviation
monthly USD/euro 0.0260 0.0249 0.0261 Yen/euro 0.0262 0.0278 0.0288 Yen/dollar 0.0291 0.0274 0.0243 quarterly USD/euro 0.0424 0.0411 0.0426 Yen/euro 0.0430 0.0455 0.0463 Yen/dollar 0.0477 0.0451 0.0249 6mth USD/euro 0.0648 0.0608 0.0633 Yen/euro 0.0668 0.0696 0.0720 Yen/dollar 0.0730 0.0696 0.0627 12mth USD/euro 0.1049 0.0823 0.0979 Yen/euro 0.1109 0.1035 0.1220 Yen/dollar 0.1092 0.0972 0.0538 24 mth USD/euro 0.1808 0.1065 0.1766 Yen/euro 0.1669 0.1638 0.2143 Yen/dollar 0.1773 0.1585 0.1400
This development may be less surprising when we consider that most emerging Asian economies are pegging their exchange rate to the dollar, while Japan is a major import and export market and an important investor in the region. The relative increase in the yen-dollar exchange rate would then reflect an interest to stabilize Japan’s relations with its regional partners.
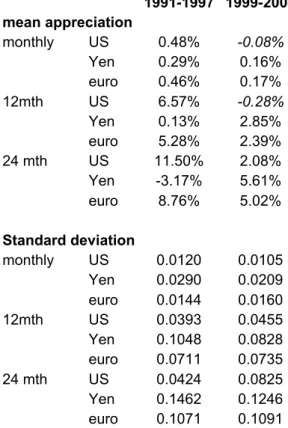
This feature is also apparent, when looking at the mean, standard deviation and correlations between the nominal effective exchange rates of the Big 3 countries (Table 5).3 Since 1999, NEER-volatility has come down over all time horizons for Japan; it has remained stable for the Eurozone, but it has fallen for the short term and increased on the long horizon for the USA. The increased flexibility in the US effective exchange rate is essentially due to the variation of the dollar-euro exchange rate: the negative correlation between the dollar-NEER and the euro-NEER has become significantly stronger after the creation of the euro across all time horizons. Thus, Europe is taking the brunt of the American adjustment.
3
Table 5. Nominal effective exchange rate volatility 1991-1997 1999-2004 mean appreciation monthly US 0.48% -0.08% Yen 0.29% 0.16% euro 0.46% 0.17% 12mth US 6.57% -0.28% Yen 0.13% 2.85% euro 5.28% 2.39% 24 mth US 11.50% 2.08% Yen -3.17% 5.61% euro 8.76% 5.02% Standard deviation monthly US 0.0120 0.0105 Yen 0.0290 0.0209 euro 0.0144 0.0160 12mth US 0.0393 0.0455 Yen 0.1048 0.0828 euro 0.0711 0.0735 24 mth US 0.0424 0.0825 Yen 0.1462 0.1246 euro 0.1071 0.1091 Source: IMF, own calculations
In fact, the dollar peg by Asian countries stabilizes the NEER for the USA. I have estimated the standard equation used to identify implicit basket pegs (see Bénassy-Quéré, 1999; 2005): t Ykt Ekt kt ikt a a e a e a e u e = + Δ + Δ + Δ + Δ 0 1 $ 2 3
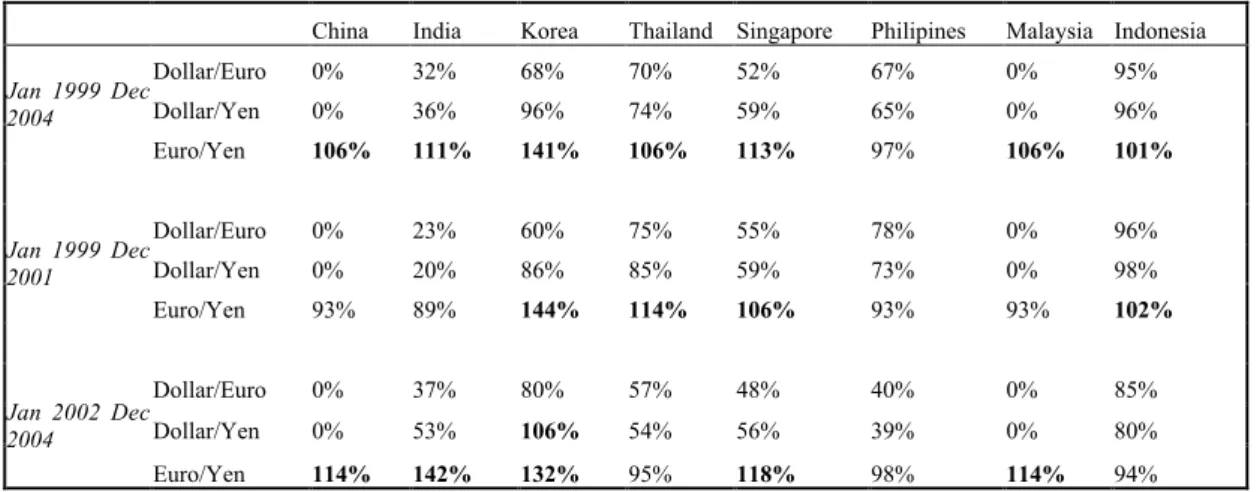
where the coefficients a1,a2,a3 indicate the weight given to changes in local currency exchange rates relative to dollar, euro and yen. Based on these coefficients, we can show the relative volatility for a given pair of currencies. A coefficient of 0 indicates a fixed exchange rate between the local Asian currency and the denominator of the volatility ratio of dollar/euro, dollar/yen, euro/yen. A value of 1 indicates that the volatility over the estimation period was the same for the two currencies. It appears that for most Asian currencies volatility was significantly lower for the US-dollar than for the euro or yen, and that it is usually lower for the yen than for the euro, especially during periods of euro strength.
Table 6. Volatility of local currencies relative to key currencies
China India Korea Thailand Singapore Philipines Malaysia Indonesia
Dollar/Euro 0% 32% 68% 70% 52% 67% 0% 95% Dollar/Yen 0% 36% 96% 74% 59% 65% 0% 96% Jan 1999 Dec 2004 Euro/Yen 106% 111% 141% 106% 113% 97% 106% 101% Dollar/Euro 0% 23% 60% 75% 55% 78% 0% 96% Dollar/Yen 0% 20% 86% 85% 59% 73% 0% 98% Jan 1999 Dec 2001 Euro/Yen 93% 89% 144% 114% 106% 93% 93% 102% Dollar/Euro 0% 37% 80% 57% 48% 40% 0% 85% Dollar/Yen 0% 53% 106% 54% 56% 39% 0% 80% Jan 2002 Dec 2004 Euro/Yen 114% 142% 132% 95% 118% 98% 114% 94% Relative Volatility: Ratio of the standard deviation of the differences of the logs of the nominal exchange rate
(given in the two different currencies)
Summarising we find that most Asian currencies de facto peg to the US-dollar and that even the yen has moved in this direction since the euro started in 1999. As a consequence, the exchange rate is losing its role as an efficient adjustment instrument for the US economy. Only two transmission channels remain viable for a return to a balanced world economy: lower consumption in the USA and therefore a drop in world demand, or excessive exchange rate swings between the dollar and euro. Both options would harm the world economy and particularly Europe and Asia. Before we can look at possible solutions for this dilemma, we need to understand, why small emerging countries peg to key currencies.
II. Policy Issues
The rationale of bloc floating
Why do smaller countries peg to anchor currencies, rather than have flexible exchange rates? In the 1980s the generally accepted argument was to use exchange rates as a commitment device for disinflation policies. However, in the 1990s price stability was achieved in many countries and the issue of adjusting to shocks became predominant. Optimum currency area (OCA) theory (Mundell, 1961; McKinnon, 1963; Kenen, 1969) emphasised that incentives to fix exchange rates rise with the bilateral intensity of trade, the mobility of production factors (labour and capital) and
with the proportion of common shocks. Eichengreen and Bayoumi (1996:364) found that East Asia “satisfies the standard optimum currency area criteria for the adoption of a common monetary policy about as well as Western Europe”. This was not surprising, given that the region followed de facto a common policy by pegging to the dollar – just as Western Europe did under the Bretton Woods system. However, Bénassy-Quéré (1999) has shown that the behaviour of Asian currencies with respect to the three international key currencies contradicts the OCA literature: Asian currencies are “excessively pegged to the USD”, because the higher the asymmetry in shocks between Asia and the US, the lower is the exchange rate variability against the US-dollar. In other words, Asian authorities do not wish to hedge against shocks. A demand shock in the USA has stronger effects on Asian than on European economies. This may have been an attractive feature when American news was mainly positive as it was the case in the 1990s. But if the US were hit by a negative shock, say due to higher savings, Asia would suffer more than necessary.
This result is puzzling. One explanation is that policy objectives of Asian countries, other than Japan, do not fit OCA theory. This theory assumes that public authorities aim to stabilize output. But in emerging economies they give priority to increasing output and wealth, i.e. to development. In order to lessen the external budget constraint they focus monetary policies on maintaining external competitiveness. At a stable undervalued exchange rate export-led growth develops domestic productive capacities and human capital.4 The economic miracles of Japan and Western Europe under Bretton Woods are an example for such a strategy. Figure 2 shows the level of unit labour costs (ULC) for the two economies relative to the US-level. Thus, for nearly two decades ULC remained at 50-60% of American levels. After the breakdown of the fixed rate system, unit labour costs rapidly floated up and even overshot US-costs and the Golden Age came to an end.
Figure 2. Unit labour costs relative to USA 20.0% 40.0% 60.0% 80.0% 100.0% 120.0% 140.0% 1960 1963 1966 1969 1972 1975 1978 1981 1984 1987 1990 1993 1996 1999 2002 2005
Euro area (incl. West Germany) Germany United Kingdom Japan United States
Bretton Woods
Plaza Agreement
EMS ERM crisis Euro
Asian crisis
source: AMECO
The sustainability of the undervaluation strategy depends partly on the exchange rate regime, partly on the level of competitiveness. In a floating regime, undervaluations are transitory in the short term, as financial markets reassess potential returns and adjust the value of the currency. If capital flows are liberalised, expectations may even exaggerate exchange rate fluctuations and lead to overshooting (Dornbusch, 1976). If nominal rates are fixed, the question is, how the current account surplus is managed. If the private sector holds foreign assets, (a reasonable assumption when financial assets are not perfect substitutes and capital control exist), a current account surplus simply increases local citizens’ wealth. If foreign assets are converted into domestic currency, central banks accumulate reserves and this could ultimately lead to inflation. The undervaluation would turn into overvaluation when inflation in the periphery exceeds durably inflation in the anchor country. The current account deficit will then draw on foreign exchange reserves and the peg becomes unsustainable. The Asian crisis in 1997 was a mix of all these factors, with exchange market liberalisation triggering the crisis off. But after the crisis, macroeconomic policies became again compatible with exchange rate stability. Table 6 shows countries with a stable dollar link reducing their inflation differential after the Asian crisis in 1997. Interestingly, when the GDP-deflator, rather than the consumer price index, is used as an inflation measure, a peg to the euro would be more easily sustainable than a dollar peg, but not the yen.
Table 6. Inflation differentials to USA GDP deflator 1990-1996 1998-2003 1999-2003 Japan -1.7 -3.2 -3.6 Singapore 0.2 -2.4 -2.2 China 7.9 -1.8 -1.4 Thailand 2.2 0.2 -1.3 Malaysia 0.9 1.2 0.0 Korea 5.5 0.8 0.1 Euro 0.5 0.1 0.2 India 7.1 2.6 1.8 Phillipines 7.3 4.9 4.1 Indonesia 5.5 18.9 7.9
However, a competitive (real) exchange rate is not the only policy variable to stimulate high investment and growth. For risk-avers investors the volatility of the exchange rates matters. Especially for the longer time horizons, which determine investment into real assets, it is costly if not impossible to hedge against exchange risk. The cost of uncertainty can be significant in reducing investment (Dixit and Pindyck, 1994). Bénassy-Quéré (2001) has estimated the effect on foreign direct investment (FDI), showing that a 1 percent reduction in volatility increases FDI by 0.60%, while the appreciation in the real exchange rate reduces the FDI stock by 0.22%. Subsequent to Rose (2000) significant evidence for trade effects from exchange rate stability has emerged: at least 34 studies have revealed that bilateral currency unions increased trade between 30% and 90% (Rose 2004). These results are coherent with the theory of bloc-floating. This phenomenon was explained in Collignon (1999, 2002), using an optimum portfolio approach to explain the performance of investment and trade. Governments aiming to maximize growth and welfare will therefore seek stability in exchange rates with major trade partners. However, the wide-spread pegging of exchange rates has unintended consequences for the world economy.5 As currencies blocs get larger, the volatility of the equilibrium exchange rate between the key countries increases. The reason is that as the effective exchange rate is increasingly sticky, the flexible component in the currency basket has to make larger adjustments to return to equilibrium after shocks.
5 In Collignon, 2002, I have shown that in a 3-country world of bloc floating there are unintended
consequences which are not obvious in 2-country models: (1) the fundamental exchange rate between key currencies is becoming more volatile as currency blocs are becoming larger. (2) excess inflation in the periphery of a bloc appreciates the anchor currency and leads to the break-up of currency blocs.
Thus, as long as many emerging Asian countries, and specially China, are pegging to the dollar, the variation required to rebalance the US-current account deficit is significantly higher for the dollar–euro and dollar-yen rates, than if these currencies floated. Given that the bilateral deficit between the US and emerging Asia is similar in size to the transatlantic deficit, the dollar-euro exchange rate would have to appreciate twice as much as if Asian exchange rates were flexible against the dollar. If the yen-dollar rate has also become more stable, the euro is the only key currency available for adjustment, with serious consequences for economic growth in Europe. The dominant trade partner
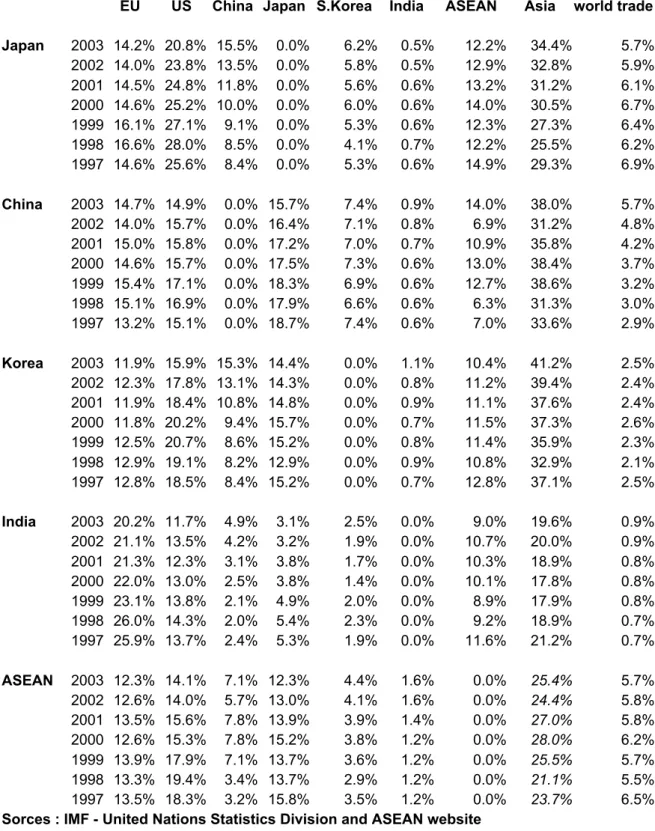
More flexibility between Asia and the dollar would make the US-adjustment less costly for the world economy, but it would come at the price of less investment and growth in Asian economies. Their governments have therefore little incentives to change their unilateral pegs, even if this would Pareto-improve world welfare. However, by keeping their dollar peg rigid, Asian countries are not necessarily serving their own interests, because the argument for fixed exchange rates hinges on dominant trade partners. Fixing exchange rates is often justified by export-led development strategies. Reducing bilateral exchange rate volatility relative to a large trade partner increases the potential for trade and investment. It could be argued that by pegging to the US-dollar, Asian countries supported trade integration with a dominant partner. Yet, the United States is not always the main market for most of Asian countries (Table 7). The attractiveness of the dollar peg consists in the fact that the dollar-zone is large, and in particular that most of the neighbouring trade partners are also pegged to the dollar. However, the same argument could be made for Europe, if all Asian countries would peg to the euro.
Table 7. Total Trade Shares of Asian countries
share of
EU US China Japan S.Korea India ASEAN Asia world trade
Japan 2003 14.2% 20.8% 15.5% 0.0% 6.2% 0.5% 12.2% 34.4% 5.7% 2002 14.0% 23.8% 13.5% 0.0% 5.8% 0.5% 12.9% 32.8% 5.9% 2001 14.5% 24.8% 11.8% 0.0% 5.6% 0.6% 13.2% 31.2% 6.1% 2000 14.6% 25.2% 10.0% 0.0% 6.0% 0.6% 14.0% 30.5% 6.7% 1999 16.1% 27.1% 9.1% 0.0% 5.3% 0.6% 12.3% 27.3% 6.4% 1998 16.6% 28.0% 8.5% 0.0% 4.1% 0.7% 12.2% 25.5% 6.2% 1997 14.6% 25.6% 8.4% 0.0% 5.3% 0.6% 14.9% 29.3% 6.9% China 2003 14.7% 14.9% 0.0% 15.7% 7.4% 0.9% 14.0% 38.0% 5.7% 2002 14.0% 15.7% 0.0% 16.4% 7.1% 0.8% 6.9% 31.2% 4.8% 2001 15.0% 15.8% 0.0% 17.2% 7.0% 0.7% 10.9% 35.8% 4.2% 2000 14.6% 15.7% 0.0% 17.5% 7.3% 0.6% 13.0% 38.4% 3.7% 1999 15.4% 17.1% 0.0% 18.3% 6.9% 0.6% 12.7% 38.6% 3.2% 1998 15.1% 16.9% 0.0% 17.9% 6.6% 0.6% 6.3% 31.3% 3.0% 1997 13.2% 15.1% 0.0% 18.7% 7.4% 0.6% 7.0% 33.6% 2.9% Korea 2003 11.9% 15.9% 15.3% 14.4% 0.0% 1.1% 10.4% 41.2% 2.5% 2002 12.3% 17.8% 13.1% 14.3% 0.0% 0.8% 11.2% 39.4% 2.4% 2001 11.9% 18.4% 10.8% 14.8% 0.0% 0.9% 11.1% 37.6% 2.4% 2000 11.8% 20.2% 9.4% 15.7% 0.0% 0.7% 11.5% 37.3% 2.6% 1999 12.5% 20.7% 8.6% 15.2% 0.0% 0.8% 11.4% 35.9% 2.3% 1998 12.9% 19.1% 8.2% 12.9% 0.0% 0.9% 10.8% 32.9% 2.1% 1997 12.8% 18.5% 8.4% 15.2% 0.0% 0.7% 12.8% 37.1% 2.5% India 2003 20.2% 11.7% 4.9% 3.1% 2.5% 0.0% 9.0% 19.6% 0.9% 2002 21.1% 13.5% 4.2% 3.2% 1.9% 0.0% 10.7% 20.0% 0.9% 2001 21.3% 12.3% 3.1% 3.8% 1.7% 0.0% 10.3% 18.9% 0.8% 2000 22.0% 13.0% 2.5% 3.8% 1.4% 0.0% 10.1% 17.8% 0.8% 1999 23.1% 13.8% 2.1% 4.9% 2.0% 0.0% 8.9% 17.9% 0.8% 1998 26.0% 14.3% 2.0% 5.4% 2.3% 0.0% 9.2% 18.9% 0.7% 1997 25.9% 13.7% 2.4% 5.3% 1.9% 0.0% 11.6% 21.2% 0.7% ASEAN 2003 12.3% 14.1% 7.1% 12.3% 4.4% 1.6% 0.0% 25.4% 5.7% 2002 12.6% 14.0% 5.7% 13.0% 4.1% 1.6% 0.0% 24.4% 5.8% 2001 13.5% 15.6% 7.8% 13.9% 3.9% 1.4% 0.0% 27.0% 5.8% 2000 12.6% 15.3% 7.8% 15.2% 3.8% 1.2% 0.0% 28.0% 6.2% 1999 13.9% 17.9% 7.1% 13.7% 3.6% 1.2% 0.0% 25.5% 5.7% 1998 13.3% 19.4% 3.4% 13.7% 2.9% 1.2% 0.0% 21.1% 5.5% 1997 13.5% 18.3% 3.2% 15.8% 3.5% 1.2% 0.0% 23.7% 6.5%
Sorces : IMF - United Nations Statistics Division and ASEAN website
Table 7 gives the volume of a country’s imports and exports as a percentage of that country’s total trade. The last column shows the country’s trade weight relative to total world trade. The US dominates as a trade partner for Japan, Korea and possibly
ASEAN, although the relative importance is diminishing. Europe is the privileged partner for India. Chinese trade is nearly evenly distributed between Europe and US. The EU’s share as a trade partner for Asia has remained largely constant, while the US share has fallen over the recent years. However, with the exception of India, trade with the rest of Asia (Japan, China, Korea, India and ASEAN) is significantly more important than either of the two other continents; this is also true for exports. In most cases intra-Asian trade matches the volumes of both US and the EU together. Frankel (1997) has explained these strong trading links by the importance of geographical and cultural proximity and the dynamics resulting from rapid growth. But in the context of bloc floating (Collignon, 1999; 2002) these factors are strengthened by pegging to the dollar: if most other Asian trade partners are also pegged to the dollar, exchange rates for the whole region are stable, and given the dollar-zone, more than half of the exports benefit from low volatility.
However, here is the problem: if the adjustment of the US economy requires more exchange rate flexibility, and all Asian countries would move to floating, as recommended by the Washington consensus, they would lose more than only stability with the USA. Flexible rates would also affect intra-Asia trade and local investment negatively, particularly for small countries.
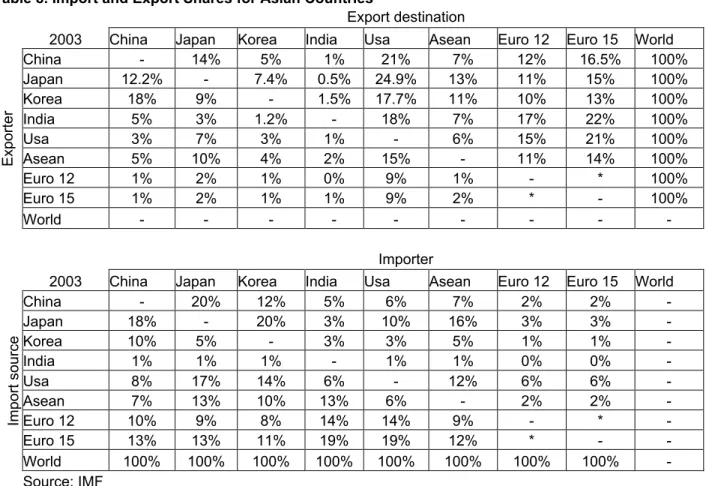
In addition, export and import markets are not equally distributed (see Table 8). For example, 21 % of China’s exports go to the US and more than 16% to the EU, but only 8% of her imports are originating in the USA, while 13% come from the European Union. Because of this mismatch, high volatility in the dollar-euro exchange rate will disturb the focus for optimal trade specialisation given that foreign trade requires country-specific investment. If the dollar weakens relative to the euro, exports to Europe from the dollar-pegged country become more competitive, but imports increase inflationary pressures, which reduce competitiveness in the US market. The opposite happens when the dollar strengthens. Now, if the fundamental equilibrium exchange rate between key currencies becomes more volatile with large and increasing currency blocs (as shown in Collignon, 2002), then the noise from the transatlantic exchange rate will disturb investment, trade and growth in Asia. The required return for profitable investment will increase by incorporating a risk premium for uncertainty and the imported inflation will make macroeconomic policies more restrictive.
Table 8. Import and Export Shares for Asian Countries
Export destination
2003 China Japan Korea India Usa Asean Euro 12 Euro 15 World
China - 14% 5% 1% 21% 7% 12% 16.5% 100% Japan 12.2% - 7.4% 0.5% 24.9% 13% 11% 15% 100% Korea 18% 9% - 1.5% 17.7% 11% 10% 13% 100% India 5% 3% 1.2% - 18% 7% 17% 22% 100% Usa 3% 7% 3% 1% - 6% 15% 21% 100% Asean 5% 10% 4% 2% 15% - 11% 14% 100% Euro 12 1% 2% 1% 0% 9% 1% - * 100% Euro 15 1% 2% 1% 1% 9% 2% * - 100% Exporter World - - - -Importer
2003 China Japan Korea India Usa Asean Euro 12 Euro 15 World
China - 20% 12% 5% 6% 7% 2% 2% -Japan 18% - 20% 3% 10% 16% 3% 3% -Korea 10% 5% - 3% 3% 5% 1% 1% -India 1% 1% 1% - 1% 1% 0% 0% -Usa 8% 17% 14% 6% - 12% 6% 6% -Asean 7% 13% 10% 13% 6% - 2% 2% -Euro 12 10% 9% 8% 14% 14% 9% - * -Euro 15 13% 13% 11% 19% 19% 12% * - -Import source World 100% 100% 100% 100% 100% 100% 100% 100% -Source: IMF
Pegging the Euro and the Yen
There are three options to avoid this dilemma: Asia could develop a regional monetary system like Europe did after the break down of the Bretton Woods fixed exchange rate system. Alternatively, it could peg to the Euro. In this case the exchange rate stability would be preserved for a trade volume that is as important as the dollar zone today. Finally it could peg to a basket of currencies.
While the idea of an Asian Monetary System seemed far-fetched until the late 1990s, monetary cooperation in the region has made progress since the Asian currency crisis in 1997 (Henning, 2002). However, we are still far from the political commitment to cooperation that supported the creation of the European Monetary System. Moreover, the question which currency should be the anchor for a regional system is not clear.
One particularity of Asian currency relations is the fact that the yen is a key currency like the dollar and euro in terms of financial markets, but it has never became an anchor currency for the region. Politically, this may be explained by past socio-political historic developments. Eichengreen and Bayoumi (1999) have argued that in Asia neither initial conditions nor subsequent events have been conducive to the political cohesion necessary to sustain a common peg to an Asian currency. However, the Asian crisis in 1997 and the emergence of China as a major trade partner in the world may have changed the incentive structure for the region, so that monetary cooperation is becoming more feasible today (Dieter and Higgott, 2002). From an optimum currency area point of view, it could be argued that China is naturally growing into the role of a regional anchor: it is an important trade partner in the region, has a large potential domestic market and labour mobility with neighbours is higher than for Japan. However, despite its recent revaluation of 2%, the Chinese currency is still underdeveloped. Given the fragility of the Chinese banking system, restrictions on capital mobility and the undervaluation strategy seem justified for sustaining China’s rapid growth.
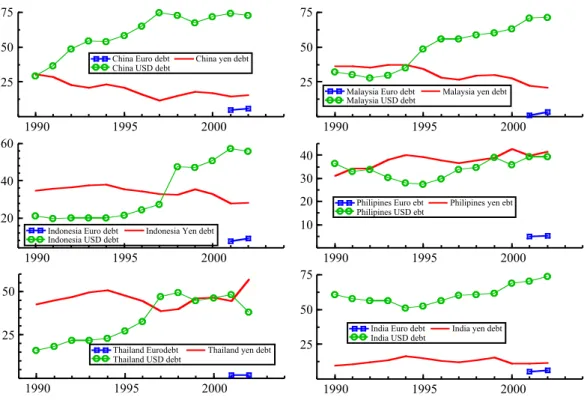
This is different for the Japanese yen. Most of the objections against the formation of a Yen-bloc voiced in the late 1990s, notably the “incompetence risk” of Japanese policy-makers (Dornbusch and Park, 1999), seem to belong to a different epoch. Contrary to the renminbi, the yen is fully convertible, the Japanese banking crisis on the way of being resolved and, most important, Japan is already an important lender to the region. Figure 3 shows the share of currency composition in Asian foreign long-term debt. Although the dollar is predominant in most countries, the yen - and not the euro – occupies an important role for those countries. From this point of view, a depreciation of the dollar relative to local currencies would be advantageous for Asia, but an appreciation of the (“ever-rising”) yen would increase the burden of the debt service. Thus, stability against the yen is a desirable feature.
Figure 3. The Currency Composition of Asian Long-term Foreign Debt
1990 1995 2000
25 50 75
China Euro debt
China USD debt China yen debt
1990 1995 2000
25 50 75
Malaysia Euro debt
Malaysia USD debt Malaysia yen debt
1990 1995 2000
20 40 60
Indonesia Euro debt
Indonesia USD debt Indonesia Yen debt
1990 1995 2000
10 20 30 40
Philipines Euro ebt
Philipines USD ebt Philipines yen ebt
1990 1995 2000
25 50
Thailand Eurodebt
Thailand USD debt Thailand yen debt
1990 1995 2000
25 50 75
India Euro debt
India USD debt India yen debt
This advantage would not be obtained by pegging to the Euro. Such a strategy would simply replace the dollar peg. It has the advantage of maintaining stability for a trade area of roughly equal size, while allowing the dollar the flexibility needed to go through the external adjustment process. Hence, the costs of returning to a more balanced global economy would be lower than if Asia kept its dollar peg and this benefits certainly Europe and Asia, but also America. However, it does not deal with the important role of the Japanese yen for trade, foreign direct investment and finance in the region.
This handicap could be overcome by putting both the yen and the euro into a basket to which other Asian currencies and especially the Chinese currencies (renminbi, Hongkong dollar, Taiwanese dollar) would peg. Yet, a simple basket peg is not optimal; an additional condition is improved stability between the euro and the yen. Basket pegs were frequently proposed as alternatives to Asia’s dollar peg after the Asian crisis (Williamson, 1999; Rajan, 1999; Bénassy-Quéré, A. 1999). But it can be shown (Collignon, 1999) that basket pegs create suboptimal incentives for regional investment, trade and integration. Furthermore, if the yen and the Euro were the principal components on the baskets of other Asian countries, but the yen-euro rate is
volatile, which is what we have observed since 1999, then the same mismatch argument would apply as for the dollar-euro rate.
The solution requires therefore a two-step strategy: first, European and Japanese authorities should cooperate to stabilise their bilateral exchange rate, while allowing the dollar to depreciate in order to support the global adjustment. Second, China and the other East Asian countries should peg to a basket, which consists essentially of euros and yen. The transition may be smoothed by having the dollar in initially in the basket and then gradually phasing it out. Once the basket contains only two major components with reasonable stability among each other, all the benefits of stable exchange rate pegs would work in favour of Asia.
Of course the stability of this arrangement requires that Asian currencies remain undervalued relative to the euro and the yen. Given the weak economic growth and latent social tension related to high unemployment, this idea may seem politically problematic. Could Europe and Japan really afford more competition from emerging economies? The problem is that in today’s world, both Europe and Japan suffer from insufficient domestic demand and the growth impulse comes nearly exclusively from external demand. But the consequences of the system suggested here would actually support economic growth in Europe and Japan by stimulating domestic demand. In fact, as Asian countries become net exporters to Europe and Japan, they start accumulating financial assets in these two anchor countries, as they did previously in the United States. To the degree that the ECB and the Bank of Japan need to intervene in foreign exchange markets in order to keep their rates stable, this might create liquidity and keep interest rates low. However, the two currencies are large enough for their central banks to sterilise these interventions if inflationary pressures appeared. On the other hand, if Asian exporters kept their foreign assets in euro or yen – rather as presently in dollar – this behaviour would stimulate financial markets in the anchor economies and create a wealth effect as it did in the USA during the 1990. this effect would reduce European savings and stimulate domestic consumption. Therefore, creating a new monetary regime in the world would not only avoid a crash landing of the world economy when the American imbalances are corrected, but it would positively contribute to a stronger world economy.
Bibliography
Bénassy-Quéré, A. 1999. Optimal Pegs for East Asian Currencies ; Journal of the Japanese and International Economies 13, 44-60 (1999)
Bénassy-Quéré, A. 2001. Exchange-Rate Strategies in the Competition for Attracting Foreign Direct Investment; Journal of the Japanese and International Economies 15, 178–198 (2001)
Bénassy-Quéré, A., B. Cœuré and V. Mignon, 2005. On the identification of de facto currency pegs. Journal of the Japanese and International Economies, 20, in press
Calvo, G. and C. Reinhard, 2000. Fear of floating; NBER. WP 7993
Collignon, S. 1999. Bloc floating and exchange rate volatility: the causes and consequences of currency blocs; in: S. Collignon, J. Pisani-Ferry, Yung Chul Park, Exchange Rate Policies in Emerging Asian Countries; Routledge, London and New York
Collignon, S. 2002. Monetary Stability in Europe; Routledge, London and New York
Dieter, H. and R. Higgott, 2002. Exploring alternative theories of economic regionalism: From trade to finance in Asian co-operation; Centre for the Study of Globalisation and Regionalisation, Working paper No. 89/02; Warwick University
Dixit, A. and R. Pindyck, 1996. Investment under Uncertainty. Princeton University Press, Princeton, New Jersey
Dornbusch, R. 1976. Expectations and exchange rate dynamics; Journal of Political Economy, 84
Dornbusch, R. and Y. Ch. Park. 1999. Flexibility or Nominal Anchors? In: S. Collignon, J. Pisani-Ferry, Yung Chul Park, Exchange Rate Policies in Emerging Asian Countries; Routledge, London and New York
Dooley, M., M. Folkerta-Landau, P. Garber, 2003. An Essay on the Revived Bretton Woods System; NBER Working Paper 9971
Eichengreen and Bayoumi, 1999. Is Asia an Optimum Currency Area? Can it become One? Regional, global and historic perspectives on Asian monetary
relations. In: S. Collignon, J. Pisani-Ferry, Yung Chul Park, Exchange Rate Policies in Emerging Asian Countries; Routledge, London and New York Frankel, J. 1997. Regional Trading Blocs in the World Economic System;
Institute for International Economics, Washington, DC
Henning, C. R. 2002. East Asian Financial Cooperation; Institute for International Economics, Washington, DC
IMF (2004): World Economic Outlook.
Kenen, P. B. (1969). The theory of optimum currency areas: An eclectic view; in: R. Mundell and A. K. Swoboda, (Eds.) Monetary Problems of the International Economy, Univ. of Chicago Press, Chicago.
McKinnon, R. (1963). Optimum currency areas, Amer. Econ. Rev. 53.
McKinnon, R. and K. Ohno, 1997. Dollar and yen: resolving economic conflict between the United States and Japan; Cambridge, Mass.; London: MIT
Mundell, R. A. (1961). A Theory of Optimum Currency Areas, Amer. Econ. Rev. 51, 657–665.
Obstfeld, M and K. Rogoff (2004): The Unsustainable US Current Account Position Revisited, October 14, 2004 NBER
Portes, R. and H. Rey, 1998. The emergence of the euro as an international currency; Economic Policy, vol. 13, issue 26
Rose, A. 2000. One money, one market. The effect of common currencies on trade, Economic Policy, April
Rose, A. 2004. A Meta – analysis of the effect of common currencies on international trade, March 2004, NBER
Williamson, J. 1999. The case for a Common Basket Peg for East Asian Currencies; in: S. Collignon, J. Pisani-Ferry, Yung Chul Park, Exchange Rate Policies in Emerging Asian Countries; Routledge, London and New York