RESEARCH
Assessment and validation of miniaturized
technology for the remote tracking of critically
endangered Galápagos pink land iguana
(Conolophus marthae)
Pierpaolo Loreti
1, Lorenzo Bracciale
1, Giuliano Colosimo
2,3*, Carlos Vera
4, Glenn P. Gerber
3,
Massimiliano De Luca
5and Gabriele Gentile
2Abstract
Background: Gathering ecological data for species of conservation concern inhabiting remote regions can be
daunting and, sometimes, logistically infeasible. We built a custom-made GPS tracking device that allows to remotely and accurately collect animal position, environmental, and ecological data, including animal temperature and UVB radiation. We designed the device to track the critically endangered Galápagos pink land iguana, Conolophus marthae. Here we illustrate some technical solutions adopted to respond to challenges associated with such task and present some preliminary results from controlled trial experiments and field implementation.
Results: Our tests show that estimates of temperature and UVB radiation are affected by the design of our device,
in particular by its casing. The introduced bias, though, is systematic and can be corrected using linear and quadratic regressions on collected values. Our data show that GPS accuracy loss, although introduced by vegetation and orien-tation of the devices when attached to the animals, is acceptable, leading to an average error gap of less than 15 m in more than 50% of the cases.
Conclusions: We address some technical challenges related to the design, construction, and operation of a
custom-made GPS tracking device to collect data on animals in the wild. Systematic bias introduced by the technological implementation of the device exists. Understanding the nature of the bias is crucial to provide correction models. Although designed to track land iguanas, our device could be used in other circumstances and is particularly use-ful to track organisms inhabiting locations that are difficult to reach or for which classic telemetry approaches are unattainable.
Keywords: Conservation technology, Galápagos, GPS-tracking device, Land iguanas, Pink iguanas
© The Author(s) 2020. This article is licensed under a Creative Commons Attribution 4.0 International License, which permits use, sharing, adaptation, distribution and reproduction in any medium or format, as long as you give appropriate credit to the original author(s) and the source, provide a link to the Creative Commons licence, and indicate if changes were made. The images or other third party material in this article are included in the article’s Creative Commons licence, unless indicated otherwise in a credit line to the material. If material is not included in the article’s Creative Commons licence and your intended use is not permitted by statutory regulation or exceeds the permitted use, you will need to obtain permission directly from the copyright holder. To view a copy of this licence, visit http://creat iveco mmons .org/licen ses/by/4.0/. The Creative Commons Public Domain Dedication waiver (http://creat iveco mmons .org/publi cdoma in/ zero/1.0/) applies to the data made available in this article, unless otherwise stated in a credit line to the data.
Background
Species on the brink of extinction may need urgent actions that aim at preserving both habitat and popula-tion viability by, for example, protecting feeding areas,
nesting grounds, and hatchlings. For this to occur, it is important to understand the intimate relationships between a species and its habitat.
In recent years, technological advancements greatly boosted wildlife in situ conservation (see [1]). The use of bio-logging and bio-telemetry has helped to uncover the use of unpredicted habitats [2], to investigate the social dynamics of reintroduced species [3], and to reveal unknown life history traits of threatened species [4]. In
Open Access
*Correspondence: [email protected]
3 Institute for Conservation Research, San Diego Zoo Global, 15600 San Pasqual Valley Road, Escondido 92027, CA, USA
other words, technology can provide crucial information for the design of effective conservation strategies.
Challenging environmental constraints and/or strict ecological species requirements call for a continuous interaction between conservationists and engineers to produce sound technological solutions that best fit case studies, yet maintaining the potential for a wide spec-trum of applications [5]. A compelling example in this regard is represented by the Galápagos pink land iguana,
Conolophus marthae. This species, described in 2009, is
listed as Critically Endangered in the IUCN Red List of Threatened Species [6, 7]. Despite its recent discovery, the pink iguana rapidly became a flagship and one of the most iconic species of the Galápagos archipelago [8]. Pink iguanas can only be found along the slopes and at the top of Wolf Volcano on Isabela Island, Galápagos (Ecua-dor). Threats include very small population size (200 <
N < 300), extremely limited distribution (the area where
the iguanas can be found is currently estimated at ca. 25 km2), lack of recruitment (no hatchlings have been seen
since 2005), and introduced predators such as cats and rats. In addition to this, pink iguanas are syntopic with C.
subcristatus, another land iguana species endemic to the
Galápagos archipelago, with a much wider distribution. Although the two species currently do not hybridize [9], they are likely to compete for resources and habitat.
Unfortunately, monitoring C. marthae, and the syn-topic population of C. subcristatus, on Wolf Volcano is a very challenging task for logistical, biological, and envi-ronmental reasons. The location where these two species occur is one of the most remote in the Galápagos archi-pelago. Wolf Volcano is approximately 150 km far from the closest village. The remoteness of this site and the absence of any kind of facility and infrastructure make reaching the area very complex logistically and expensive. Field work longer than 2–3 weeks is, basically, unattain-able. The volcano area is not covered by cellular network, which is available only in areas with human settlements on the islands. At present, communications from Wolf Volcano are possible only by ultra-high-frequency radio (UHF) and satellite connections.
To guide appropriate conservation actions for
Conolo-phus marthae, such as a head-start program or animals’
translocation, crucial information is needed to under-stand how this species uses its environment and interacts with C. subcristatus. Accurate measurements of position, temperature, humidity, solar radiation, and ultravio-let (UV) radiation are very important in this regard [8]. These parameters need to be estimated by sensors that, along with a GPS receiver, must be located in a small-sized device that can be harmlessly attached on iguanas for a long time. Iguanas shelter under bushes and recover in burrows where they also spend the night. For these
reasons, an adequate protection of the device is also needed. In addition, a device must not jeopardize the sur-vival of monitored individuals, alter their normal behav-ior, affect intra- and/or inter-specific social relationships or diminish regular access to resources. Thus, the combi-nation of biological and environmental constraints calls for a device capable not only of collecting data and stor-ing them, but also allowstor-ing remote data retrieval.
Here we present a new remote tracking device designed to monitor movements of elusive terrestrial ani-mals inhabiting isolated and remote environments. We illustrate some technical solutions adopted to respond to challenges associated with such task. The device and its associated satellite-network infrastructure here described are currently being used in a long-term inves-tigation aimed at the construction of species distribution models and habitat suitability maps for C. marthae.
Methods Study system
Conolophus marthae is only found on the top of Wolf
Volcano (WV, lat. 0.044432; long. − 91.352189), on Isabela Island [7]. Only one population of this species is currently known to exist and it is syntopic with the congeneric C. subcristatus (Fig. 1). The volcano reaches 1700 m above sea level and supports iguanas along the northwest slope from 600 m to the caldera. At lower to mid altitudes, the habitat is dominated by the lush endemic Scalesia forest. At higher altitudes, the environ-ment shifts from forest to grassland with a general lack of trees and a variety of sedges and grasses. Conolophus
subcristatus inhabits both the core area of C. marthae
and surrounding areas. The two species could use the environment in different ways. For example, whereas the population of C. subcristatus on Wolf Volcano is known to actively use the internal area of the caldera for nest-ing and retreats (Gentile, personal communication), pink iguanas were never observed inside the caldera. This sug-gests that ecological requirements for the two species may be distinct. For researchers, reaching the caldera of Wolf Volcano is very difficult. In the absence of a helicop-ter, which may cost as much as $3000 US per hour, hiking is the only alternative option. This latter approach drasti-cally limits the amount of equipment that can be trans-ported because all the supplies, including water, food, gasoline, generator, batteries, and other field equipment, must be hand-carried.
It is clear that the use of remote tracking devices to uncover the relationship between the two species within their area of distribution, their habitat characteristics, and usage will allow to efficiently guide appropriate con-servation actions for C. marthae. In fact, these devices
will provide crucial data while bypassing a number of logistical challenges.
Device and satellite gateway Wireless sensor node
We developed a new “Wireless Sensor Node” (WSN) able to collect several environmental data. The archi-tecture of the node has been described elsewhere [5, 10]. The device integrates solar panels and super-capacitors as key components to allow its continuous
functioning (Fig. 2). Here we briefly report a list of the most relevant components of the device:
• a CC1310 wireless controller [11] with an ultra-low-power active RF and MCU electric consump-tion, and flexible low-power modes. This controller provides excellent battery life and allows long-range operation. It integrates a powerful 48-MHz Arm Cortex-M3 micro controller, a dedicated radio con-troller, and a ultra-low-power Cortex M0 sensor controller;
• an ADXL345 accelerometer [12];
• a digital HDC1008 humidity sensor with integrated temperature sensor [13]);
• a VEML6070 UV light sensor [14];
• a Global TOP PA6C GPS receiver based on Medi-aTek MT3329 chip-set and an integrated ceramic antenna. It is characterized by a larger receiver sensitivity (-165 dBm thanks to the TCXO Design) resulting in high position accuracy;
• a NOR flash memory storage with 1 GB capacity (serial number: MT25QL01GBBB8E12);
• the high-performance RF front-end module Sky-works SE2435L [15]. It operates in the 860-930 MHz frequency band that includes a power ampli-fier for transmission and a low-noise ampliampli-fier for reception.
Fig. 1 Iguanas’ distribution. Distribution of sympatric pink and yellow iguanas as observed during the field work conducted between 2012 and
2015. The red polygon, along the northern slopes of Wolf Volcano, encompasses the geographic area where all records of C. marthae and C.
subcristatus were detected. Inset map shows the entire Galápagos archipelago with the relative position of Isabela Island and Wolf Volcano
Fig. 2 WSN device. Shape and dimension of WSNs with and without
the PVC casing. The 1 Euro coin in the pictures is used as scale reference
All the functions are coordinated by the CC1310 con-troller implementing the node logic. The GPS receiver provides the position of the node; it communicates with the controller via a UART interface. Sensors deliver data to the controller by a I 2
C interface. Finally, a SPI inter-face accesses the flash storage memory. The CC1310 integrates a wireless modem that directly generates and receives RF signals. To improve the node communication range, all the signals go through the Skyworks RF front-end module and a band-pass filter.
Satellite gateway
To transfer the information collected by the nodes to an internet server we built a satellite gateway relay sta-tion. The gateway has been designed to be energetically autonomous, have a good radio coverage range, and be mechanically resistant for deployment in the field. At the same time the gateway infrastructure must not repre-sent a threat to local species and be easy to transport and assemble in situ.
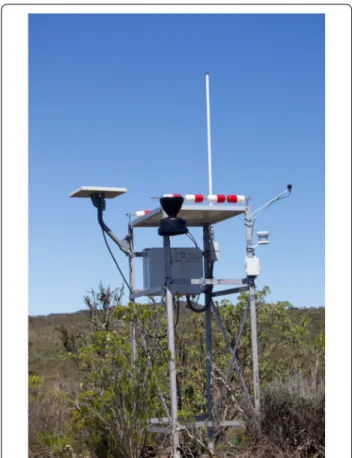
Figure 3 shows the gateway station as it currently stands assembled on the top of WV. The bottom 40 cm of the metal poles are anchored to the ground with concrete, to ensure its stability. The stainless steel infra-structure holds a 102.87 × 67.8 cm solar panel with a maximum power of 100 W, a 12 dBi satellite antenna and an 8 dBi terrestrial antenna. A waterproof junction box (the grey box in Fig. 3) has been used to accommodate
• a low-power satellite transponder (connected to the satellite antenna);
• a voltage regulator and a 40 Ah deep-cycle AGM bat-tery;
• a low-power computing device based on ARM11 processor (Raspberry Pi Zero);
• a receiver, connected with the terrestrial antenna, and controlled by the computer.
On the computer, we run a custom software that periodi-cally scans the surroundings for WSNs and downloads the data collected from them. Then it uploads the data synchronously on our internet server through the satel-lite communication. Given that this real-time communi-cation is not 100% reliable, a periodic script synchronizes the data from the server to the computer to prevent losses.
Casing and attachment procedure
To protect the devices against environmental impacts (scratches, bumps, breakages, and moisture), WSNs were encased in a custom-made PVC (Polycinyl chloride) package (Fig. 2). Besides offering efficient protection to the hardware and to provide an easy and safe attachment
on animal skin, the packaging was designed to have mini-mum effect on sensors and on the energy-harvesting system. The case is transparent, furniture grade PVC, treated to be UV and impact resistant. This means that the box does not get brittle or brownish under prolonged sun exposure.
Special attention has been devoted to the attachment of the devices to the animal. A previous experiment showed that an attachment procedure using epoxy glue guarantees the device to stay attached on land iguanas for approximately 1 year (Gentile, personal communication). We are aware that shedding skin could in theory cause the earlier detachment of the device. However, we pre-ferred to accept such a potential risk rather than increase the risk of harming iguanas using more invasive meth-ods. In that first experiment, though, the PVC casing had not been designed yet. For this reason, in November 2018, we tested the attaching procedure one more time comparing epoxy and non-epoxy glues. Furthermore, during field work on WV conducted in September 2019 we also tested a combination of gluing and superficial, non permanent, suturing. The suturing was performed by a professional veterinary after properly disinfecting the
Fig. 3 Gateway relay station. The metal structure was assembled at
the Galápagos National Park station to conduct final tests, prior to its deployment in the field
skin and providing the animal with local anesthesia (lido-caine), according to a protocol approved by the Galápa-gos National Park Directorate (Fig. 4). Other methods based on fastened jackets were not considered as they proved unsafe to iguanas in long-term studies [16].
Data collection and testing
We measured the precision and the performance of the WSN sensors in the target environment. Our primary goals were to
1. test the sensors accuracy, in particular related to tem-perature, and the attenuation/error introduced by the PVC case;
2. test the effects of the vegetation on the precision of the sensed GPS position.
Among the sensors to be installed on the device, the thermometer is particularly challenging. One of the problems arising from using external thermometers is represented by the uncertainty of the measurement.
More than one question must be answered: (i) what does a non-internal (but still incorporated in the device) thermometer exactly measure? (ii) Does tem-perature measured in such a way sufficiently correlate with animal’s body temperature? (iii) Is there a meas-urement bias generated by the PVC casing? (iv) Is this bias systematic, so that it can be modelled and cor-rected? To answer these questions, we synchronously collected data from two identical digital thermom-eters Objecta mod.7264 (T1 and T2 hereafter) each of which equipped with two independent sensors: one inside the case (indoor: IND), and one external (out-door: OUT) located at the end of a 1-mlong wire. We exposed the two thermometers to the same outdoor solar conditions. The external sensor of T1 (T1-OUT) was attached to the ground, whereas T2-OUT was kept permanently operating at approximately 5 cm from the ground. Two WSNs (WSN-1 and WSN-59) were placed next to T1 and T2. While WSN-1 was protected by the PCV case, WSN-59 was not. All devices were always exposed to the same external conditions while
Fig. 4 Attaching experiments. The use of epoxy glue produced better results since it never completely crystallizes, conferring more elasticity and
durability to the attached device. When paired with superficial suturing, epoxy glue ensures the device to stay in place
Fig. 5 Experimental design. The external sensor of T1 (T1-OUT) was attached to the ground whereas T2-OUT was kept permanently operating
at approximately 5 cm from the ground. The two WSNs (WSN-1, with PVC case, and WSN-59 w/o PVC case) were located close to the two thermometers
operating (see Fig. 5). Data reading was synchronic and data collected were later used for statistical analysis.
To asses the impact of Galápagos vegetation on the GPS accuracy, we acquired 450 positions under sparse canopy cover in Puerto Ayora (Galápagos), and we com-pared these GPS fixes with those collected under an open sky condition in Rome, on the roof of our University.
We further wanted to gather information on the poten-tial loss of GPS accuracy due to the attachment position of WSNs on the animals. As previously described, the devices are attached on the animals’ tail and thus are nat-urally tilted. This inclination can cause a decrease in the location accuracy of the GPS fix. Since the real position of the animal is unknown, to evaluate this potential accu-racy loss, we compared the HDoP statistics of the GPS fixes of WSNs attached to iguanas in the field on Wolf Vulcano, with data obtained during testing conditions in Rome and Puerto Ayora.
Results and discussion
Effects of plastic packaging on sensors: temperature (T)
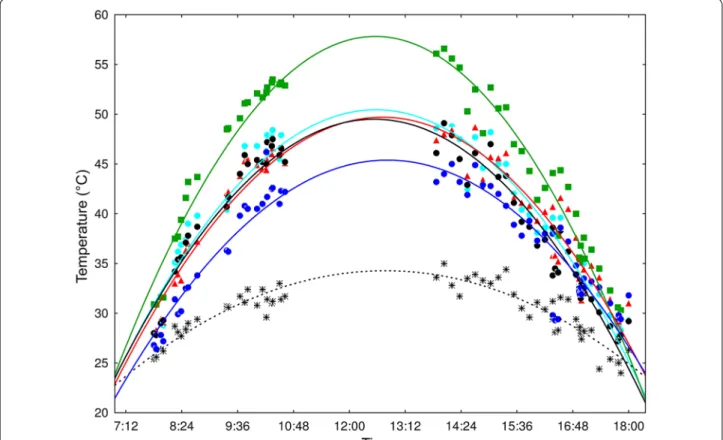
Figures 6 and 7 show temperature trends over time as measured during the experiment described in “Methods” section. Table 1 shows square regression
coefficients of each parabolic curve, along with their probability values. Quadratic regression equations for each dependent variable (T estimates provided by dif-ferent sensors) are also reported.
Although a 3-h-long segment of data (10:30 a.m.– 1:30 p.m.) is missing, because of lack of data from T1 and T2 thermometers, quadratic regressions provided very strong and statistically significant fit. Clearly, T1-IND and T2-IND and WSN-1 provided very simi-lar temperature estimates (regression parables simi-largely overlap). As expected, the T1-OUT and T2-OUT sen-sors returned very different values, with T2-OUT (taped onto the ground) providing estimates closer to those given by T1-IND, T2-IND, and WSN-1. T1-OUT provided much lower values. This is a very important outcome as it demonstrates that WSN-59 actually measures the temperature of the substrate where it is located. It is not affected by heat dispersion as T2-OUT and (particularly) T1-OUT are.
WSN-1 provided much higher temperature records. This was also expected, as these values testify for the “green house” effect caused by the PVC casing. How-ever, the very high fit of the regression curves of all
Fig. 6 Temperature trends (°C). Temperature was measured in full sun-light conditions. Green: WSN-1; cyan: T1-IND; black: T2-IND; red: WSN-59;
models allows the precise correction of the systematic bias introduced by the PVC case.
In fact, once that we confirmed that WSN-59 (w/o PVC) measures the temperature of the background where it is attached, it became necessary to correct for the bias introduced by the PVC casing. For this rea-son, we used 16, 372 temperature values collected syn-chronously by WSNs-1 and 59 every 2 s during a whole day under almost full sun-light condition. Data were
fitted to a quadratic model. In an attempt to increase the amount of explained variance, a cubic polynomial equa-tion (y = a + bx + cx2
+dx3) was also tested for regres-sion. However, such equation was not used because the introduction of a fourth parameter in the model did not increase the coefficient of determination (R2). Table 2
reports the quadratic and cubic equations for WSN-1 and 59, along with their R2
and associated p value of regression parameters. The T between WSN-1 and 59 was estimated from the quadratic regression equations (Fig. 7) as follows:
Consequently, a conversion of T estimates from devices in PVC case into the correct T reading that would be obtained without PVC casing can be obtained by the fol-lowing equation:
Clearly, T increases with increasing T. Despite Tconverted
estimated in this way being precisely defined, it is still formally dependent on time. We observed that the combined effects of stochasticity of weather conditions
�T = (−98.125 + 582.541x − 536.552)
−(−73.693 + 453.708x − 409.542)2.731 + 0.823x.
Tconverted=(−98.125 + 582.541x − 536.55 2
) − �T .
Fig. 7 Temperature trends (°C). Temperature was measured in almost full sun-light conditions. Red: WSN-1; blue: WSN-59; black dotted: T
Table 1 Quadratic regression
Square regression coefficient is estimated as SSR/SST, corrected for the mean. The dependent variable (y) is temperature as estimated by each different sensor. The independent variable (x) is time. Statistical significance (p) is shown in the last column
Dependent
variable Quadratic regression equation R
2 p T1-IND y = − 85.26 + 518.15 − 494.61x2 0.913 ≪ 0.001 T1-OUT y = − 21.40 + 209.32x − 196.74x2 0.845 ≪ 0.001 T2-IND y = − 82.15 + 504.34x − 483.01x2 0.932 ≪ 0.001 T2-OUT y = − 69.27 + 429.41x − 402.05x2 0.846 ≪ 0.001 WSN-1 y = − 113.22 + 653.66x − 624.54x2 0.935 ≪ 0.001 WSN-59 y = − 81.54 + 495.78x − 468.19x2 0.912 ≪ 0.001
during which measurements were carried out, latency in the response of devices, and buffering generated by PVC casing caused only a negligible offset between parabolic curves of WSNs 1 and 59, which remain well centered on the same axis of symmetry. Thus, we could provide an estimate of T independent of time by performing a quadratic regression between T values of WSNs 1 and 59. Given that T quadratically increases with increasing T (Fig. 7), a quadratic regression seems more appropriate than a simple linear regression. However, a linear regres-sion fits equally well the data and would provide very similar results (see Fig. 8). Thus, the equations in Fig. 7
can be used to convert T estimates from devices in PVC case into the correct T reading without PVC casing.
Effects of plastic packaging on sensors: UVB
The UVB radiation power measured with and without the enclosure is reported in Fig. 9 together with the related standard deviation. As we can see, the enclo-sure remarkably affects the sensed UV radiation (both UVB and UVI) although a strong correlation of the measurement suggests that measurement can be scaled and tuned. Because of a scattering effect introduced by the PVC casing, the measured level of UV radiation
presents a remarkable error both in terms of mean and variance. As for the mean, a systematic error correction similar to the one previously described can be adopted. The variance instead can be reduced by averaging on multiple points. This is a viable solution since one UV sensing lasts about 50 ms.
Fig. 8 Regressions. Quadratic (cyan) and linear (red) regression between 16,372 temperature values collected synchronously by WSNs 1 and 59
every 2 s during a whole day under almost full sun-light condition
Table 2 Quadratic (above), and cubic (below) regressions
Square regression coefficient is estimated as SSR/SST, corrected for the mean. The dependent variable (y) is temperature as estimated by each different sensor. The independent variable (x) is time. Statistical significance (p val) is shown in the last column
Dependent
variable Regression equations R
2 p WSN-1 y = − 98.12 + 582.54x − 536.552 0.973 ≪ 0.001 y = − 67.96 + 399.72x − 177.64x2 − 2 28.70x3 0.974 ≪ 0.001 WSN-59 y = − 73.69 + 453.70x − 409.54x2 0.950 ≪ 0.001 y = − 57.09 + 353.10x − 212.03x2 − 1 25.853 0.950 ≪ 0.001
Effects of environment on GPS fixes accuracy
In Fig. 10, we compare the counter-cumulative distri-bution function (CCDF) of the error of GPS positions acquired in Rome (red line) and Puerto Ayora (blue line). As expected, it is possible to note that the vegeta-tion introduces a decrease of achieved accuracy. This reduction is, however, acceptable, leading to an average error gap of less than 15 m over the 50% of the cases.
Evaluation of accuracy from WSN devices deployed in the field
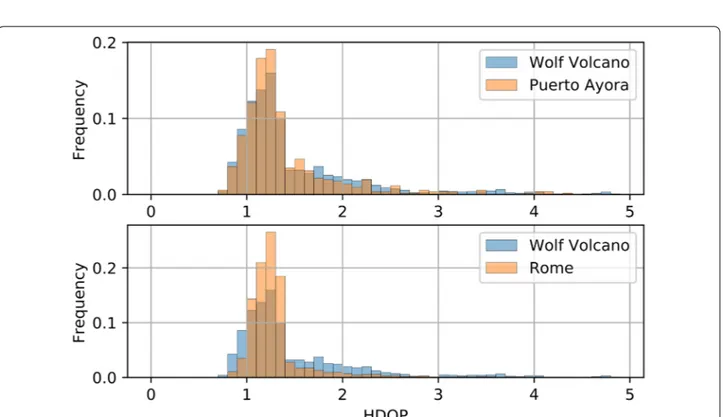
In Fig. 11, we show the GPS fixes of a WSN device attached to a yellow iguana on Wolf Volcano. Due to the high value of these iguanas in the illegal pet trade, we prefer not to georeference the points in the map. Additionally, although the relative geographic dis-tances between points are real, the characteristics of the landscape are not provided in the map. Green dots represent GPS fixes with HDoP values ≤ 1.4 , while orange dots represent values 1.4 < HDoP ≤ 2 , and red dots represent GPS fixes with HDoP values ≥ 2 . We used a cut-off value of 1.4 based on the distribution of HDoP values compared between Wolf Volcano and Puerto Ayora (Fig. 12, top) and Wolf Volcano and Rome (Fig. 12, bottom). Despite being slightly greater than the median value of HDoP distributions (see later), such threshold well discriminates points grouped together from those more geographically dispersed, as shown in Fig. 11. For this reason, we conclude that geographic locations indicated by points with HDoP > 1.4 must be regarded as unreliable.
We further estimated and compared the medians of such distributions, after rejecting normality (WShapiro– Wilk = 0.126, 0.066, 0.119; p ≪ 0.001 , for Rome, Puerto
Ayora, and Wolf Volcano, respectively). Medians resulted very similar (1.24 for Rome and Puerto Ayora and 1.26 in Wolf Volcano), yet statistically different (HKruskal–Wallis = 15.72; p ≪ 0.001 ). When the Mann–
Whitney test was applied (Table 3), Wolf Volcano was statistically different from Rome, whereas it was not from Puerto Ayora, although in this case, statistical sig-nificance was marginal.
These data indicate that despite a decrease in the qual-ity of data received from Wolf Volcano, such an effect is not severe. In fact, it was almost negligible.
Conclusions
In conclusion, we illustrated some of the technical chal-lenges related to the design, construction and operation of devices to track animals in the wild, with particular focus on iguanas. Problems related to the collection of data from sensors installed on the same device may be successfully tackled by comparing data collected under different environmental conditions. Systematic bias may exist, in some cases, they are idiosyncratic (collection of GPS positions), in other cases, they are introduced by the technological implementation of the device (in our case, temperature and UVB measurements). Understand-ing the nature of the bias is crucial to provide models for their effective correction.
Fig. 9 UV radiation. With and without PVC enclosure. The red line is
the UVB radiation sensed by a device without the enclosure, the blue line is with the enclosure and the area behind is the error (standard deviation)
Fig. 10 Counter cumulative distribution function for GPS accuracy.
Data collected in Rome (red line) and data collected in Puerto Ayora (blue line)
Fig. 11 GPS fixes of a yellow iguana. The above map shows data collected from a WSN device attached to a yellow iguana on Wolf Volcano. Green
dots represent GPS fixes with HDoP values ≤ 1.4 , while orange dots represent values 1.4 < HDoP ≤ 2 , and red dots represent GPS fixes with HDoP values ≥ 2
Fig. 12 HDoP value distribution comparison. Distribution of HDoP values compared between Wolf Volcano vs Puerto Ayora (top), and Wolf Volcano
Abbreviations
CCDF: Counter-cumulative distribution function; GPS: Global positioning system; HDoP: Horizontal dilution of precision; PVC: Polyvinyl chloride; UVB: Ultraviolet light, type B; WSN: Wireless sensor node; WV: Wolf volcano.
Acknowledgements
Data presented here result from a long-term program in collaboration between the Galápagos National Park and the University of Rome Tor Vergata, aimed at the conservation of Galápagos land iguanas. We thank the Interna-tional Iguana Foundation, the Swiss Association of Friends of the Galápagos Islands, the Mohamed bin Zayed Species Conservation Fund and the San Diego Zoo Global for funding. We are indebted to the Galápagos National Park rangers for their incommensurably valuable participation in this project and friendship. We also thank Dr. Greg Lewbart from North Carolina State Univer-sity for performing the suturing surgery and teaching us the process.
Authors’ contributions
PL and LB, contributed with software design, data collection and analysis, and writing the manuscript. MDL contributed with software designing and devices’ casing design. GC and GG contributed with experimental design, col-lection and analysis of data, and writing the manuscript. CV contributed with field work and data collection. GPG contributed with technical reviews and writing the manuscript. All authors read and approved the final manuscript.
Funding
Not applicable.
Availability of data and materials
The datasets used and/or analyzed during the current study are available from the corresponding author on reasonable request.
Ethics approval and consent to participate
Not applicable.
Consent for publication
Not applicable.
Competing interests
The authors declare that they have no competing interests.
Author details
1 Department of Electronic Engineering, University of Rome Tor Vergata, Via del Politecnico, 1, 00133 Rome, Italy. 2 Department of Biology, University of Rome Tor Vergata, Via della Ricerca Scientifica, 1, 00133 Rome, Italy. 3 Insti-tute for Conservation Research, San Diego Zoo Global, 15600 San Pasqual Valley Road, Escondido 92027, CA, USA. 4 Galápagos National Park Directorate, Avenida Charles Darwin, 200350 Puerto Ayora, Isla Santa Cruz, Galápagos, Ecuador. 5 CNR, Italian National Council of Research, Via del Fosso del Cavaliere, 1, 00133 Rome, Italy.
Received: 22 December 2019 Accepted: 13 January 2020
References
1. Pacheco XP. How technology can transform wildlife conservation. In: Pacheco M, editor. Green technologies to improve the environment on earth. London: IntechOpen; 2018. p. 1–9.
2. Raymond B, Lea M-A, Patterson T, Andrews-Goff V, Sharples R, Char-rassin J-B, Cottin M, Emmerson L, Gales N, Gales R, Goldsworthy SD, Harcourt R, Kato A, Kirkwood R, Lawton K, Ropert-Coudert Y, Southwell C, van den Hoff J, Wienecke B, Woehler EJ, Wotherspoon S, Hindell MA. Important marine habitat off east Antarctica revealed by two decades of multi-species predator tracking. Ecography. 2015;38(2):121–9. https ://doi. org/10.1111/ecog.01021 .
3. Fritts SH, Bangs EE, Fontaine JA, Johnson MR, Phillips MK, Koch ED, Gunson JR. Planning and implementing a reintroduction of wolves to yellowstone National Park and Central Idaho. Restor Ecol. 1997;5(1):7–27. https ://doi.org/10.1046/j.1526-100X.1997.09702 .x.
4. Davidson-Watts I, Walls S, Jones G. Differential habitat selection by
Pipistrellus pipistrellus and Pipistrellus pygmaeus identifies distinct
con-servation needs for cryptic species of echolocating bats. Biol Conserv. 2006;133(1):118–27. https ://doi.org/10.1016/j.bioco n.2006.05.027. 5. Loreti P, Catini A, De Luca M, Bracciale L, Gentile G, Di Natale C. The design
of an energy harvesting wireless sensor node for tracking pink iguanas. Sensors. 2019;19(5):985. https ://doi.org/10.3390/s1905 0985.
6. Gentile G (2012) Conolophus marthae. The IUCN Red List of threatened species 2012: e.T174472A1414375. Technical report, International Union for Conservation of Nature and Natural Resources. https ://doi. org/10.2305/IUCN.UK.2012-1.RLTS.T1744 72A14 14375 .en
7. Gentile G, Fabiani A, Marquez C, Snell HL, Snell HM, Tapia W, Sbordoni V. An overlooked pink species of land iguana in the Galapagos. Proc Natl Acad Sci. 2009;106(2):507–11. https ://doi.org/10.1073/pnas.08063 39106 . 8. Gentile G, Marquez C, Snell HL, Tapia W, Izurieta A. Conservation of a new
flagship species: the Galápagos pink land iguana (Conolophus marthae Gentile and Snell, 2009). In: Angelici FM, editor. Problematic wildlife: a cross-disciplinary approach. Switzerland: Springer; 2016. p. 107–8. https :// doi.org/10.1007/978-3-319-22246 -2.
9. Di Giambattista L, Fulvo A, Fabiani A, Bonanni J, Carrión JE, Gentile G. Molecular data exclude current hybridization between iguanas
Conolo-phus marthae and C. subcristatus on Wolf Volcano (Galápagos Islands).
Conserv Genet. 2018;19(6):1461–9. https ://doi.org/10.1007/s1059 2-018-1114-3.
10. Bracciale L, Catini A, Gentile G, Loreti P. Delay tolerant wireless sensor net-work for animal monitoring: the pink iguana case. In: De Gloria A, editor. Applications in electronics pervading industry, environment and society APPLEPIES 2016. Switzerland: Springer; 2017. p. 18–26.
11. Instruments T (2018) CC1310 SimpleLink™ ultra-low-power sub-1 GHz wireless MCU. Data Sheet and Documentation
12. Devices A (2019) ADXL345 Digital Accelerometer Data Sheet. https :// www.analo g.com/media /en/techn ical-docum entat ion/data-sheet s/ ADXL3 45.pdf. Accessed Sept 2019.
13. Instruments T (2015) HDC1000 low power, high accuracy digital humidity sensor with temperature sensor PACKAGE. Data Sheet and Documenta-tion. http://www.ti.com/lit/ds/symli nk/hdc10 08.pdf. Accessed Sept 2019. 14. Vishay Semiconductors (2017) Vishay semiconductors UV light sensor
with I 2 C interface. https ://www.visha y.com/docs/84366 /veml6 030.pdf. Accessed Sept 2019.
15. Skyworks (2016) SE2435L: 860 to 930 MHz high-power RF front-end module. Data Sheet and Documentation. http://www.skywo rksin c.com/ uploa ds/docum ents/SE243 5L_20241 2J.pdf. Accessed Sept 2019. 16. Goodman R, Bradley K, Alberts A, Knapp C, Gerber G. Review of radio
transmitter attachment methods for West Indian rock iguanas (genus Cyclura). Appl Herpetol. 2009;6(2):151–70. https ://doi.org/10.1163/15707 5408X 38616 9.
Publisher’s Note
Springer Nature remains neutral with regard to jurisdictional claims in pub-lished maps and institutional affiliations.
Table 3 Mann–Whitney U statistic is below the diagonal
Probability values (p), after Bonferroni correction, are above the diagonal
Rome Purto Ayora Wolf volcano
Rome – 0.474 ≪ 0.001
Purto Ayora 1165294 – 0.069