2021-02-22T15:23:30Z
Acceptance in OA@INAF
A 3D view of the Hyades stellar and sub-stellar population
Title
Lodieu, N.; SMART, Richard Laurence; Perez-Garrido, A.; SILVOTTI, Roberto
Authors
10.1051/0004-6361/201834045
DOI
http://hdl.handle.net/20.500.12386/30522
Handle
ASTRONOMY & ASTROPHYSICS
Journal
623
https://doi.org/10.1051/0004-6361/201834045 c ESO 2019
Astronomy
&
Astrophysics
A 3D view of the Hyades stellar and sub-stellar population
?
N. Lodieu
1,2,3, R. L. Smart
3, A. Pérez-Garrido
4, and R. Silvotti
3 1 Instituto de Astrofísica de Canarias (IAC), Calle Vía Láctea s/n, 38200 La Laguna, Tenerife, Spaine-mail: [email protected]
2 Departamento de Astrofísica, Universidad de La Laguna (ULL), 38206 La Laguna, Tenerife, Spain
3 Istituto Nazionale di Astrofisica, Osservatorio Astrofisico di Torino,Strada Osservatorio 20, 10025 Pino Torinese, Italy 4 Dpto. Física Aplicada, Universidad Politécnica de Cartagena, 30202 Cartagena, Murcia, Spain
Received 8 August 2018/ Accepted 14 January 2019
ABSTRACT
Aims. Our scientific goal is to provide a 3D map of the nearest open cluster to the Sun, the Hyades, combining the recent release of Gaia astrometric data, ground-based parallaxes of sub-stellar member candidates and photometric data from surveys which cover large areas of the cluster.
Methods. We combined the second Gaia release with ground-based H-band parallaxes obtained with the infrared camera on the 2 m robotic Liverpool telescope to astrometrically identify stellar and sub-stellar members of the Hyades, the nearest open cluster to the Sun.
Results. We find 1764 objects within 70◦
radius from the cluster centre from the Gaia second data release, whose kinematic properties are consistent with the Hyades. We limit our study to 30 pc from the cluster centre (47.03 ± 0.20 pc) where we identify 710 candidate members, including 85 and 385 in the core and tidal radius, respectively. We determine proper motions and parallaxes of eight candidate brown dwarf members and confirm their membership. Using the 3D positions and a model-based mass-luminosity relation we derive a luminosity and mass function in the 0.04–2.5 M range. We confirm evidence for mass segregation in the Hyades and find
a dearth of brown dwarfs in the core of the cluster. From the white dwarf members we estimate an age of 640+67−49Myr.
Conclusions. We identify a list of members in the Hyades cluster from the most massive stars down to the brown dwarfs. We produce for the first time a 3D map of the Hyades cluster in the stellar and sub-stellar regimes and make available the list of candidate members.
Key words. stars: low-mass – brown dwarfs – surveys – open clusters and associations: individual: Hyades – astrometry
1. Introduction
The large majority of stars are born in groups, clusters, and/or associations rather than in isolation (Lada & Lada 2003). Inves-tigating the dynamics of clusters is key to understanding their formation and subsequent evolution. Up to now, ground-based surveys mainly provided proper motion information as well as partial radial velocity measurements offering a two-dimensional map of the sky and, in particular for this work, of nearby open clusters. Using accurate astrometric observations of the Hipparcos satellite (High precision parallax collecting satel-lite; Perryman et al. 1997), a catalogue of about 120 000 stars brighter than visual magnitude V= 12.4 mag with a complete-ness limit of V ∼ 8 mag was generated. Later, the Tycho-2 cata-logue was created containing 2.5 million stars down to V= 11.5 and 99% complete to V ∼ 10.5 mag over the full sky (Høg et al. 2000). The advent of Gaia (Gaia Collaboration 2016) is open-ing an unprecedented window with accurate proper motions and parallaxes for more than one billion stars down to G ∼ 20.7 mag, allowing a spatial investigation of our Galaxy at large radii never before investigated to that level of precision. In particular, Gaia provides accurate 3D space motions for the nearest and youngest open clusters to the Sun, including the Hyades.
The Hyades cluster (M25, Collinder 50, Caldwell 41) is the closest stellar cluster to the Sun. Using the Hipparcos
?
Full Table C.1 is only available at the CDS via anonymous ftp tocdsarc.u-strasbg.fr(130.79.128.5) or viahttp://cdsarc. u-strasbg.fr/viz-bin/qcat?J/A+A/623/A35
catalogue Perryman et al. (1998) derived a mean distance of 46.34 ± 0.27 pc and a proper motion in the 74–140 mas yr−1 range. The core radius of the cluster is approximately 2.5–3.0 pc while its tidal radius is about 10 pc (Perryman et al. 1998; Röser et al. 2011). The reddening towards the cluster is negligible (E(B − V) ≤ 0.001 mag;Taylor 2006a).
The age of the cluster has been estimated with dif-ferent methods, yielding a canonical age of 650 ± 100 Myr. Comparison of the observed cluster sequence with model isochrones which include convective overshooting suggests 625 ± 50 Myr while evolutionary models (Maeder & Mermilliod 1981;Mazzei & Pigatto 1988;Mermilliod 1981) with enhanced convective overshooting give much older ages up to 1.2 Gyr (Mazzei & Pigatto 1988) that cannot be discarded (Eggen 1998; Tremblay et al. 2012). The ages determined from the cooling age of white dwarf members is 648 ± 45 Myr (De Gennaro et al. 2009) while stellar binaries suggest ∼650 Myr (Lebreton et al. 2001). The role of rotation at such ages leads to an age of 750 ± 100 Myr (Brandt & Huang 2015). Recently, the method using the lithium depletion boundary at the stellar to sub-stellar limit prompted an age of 650 ± 70 Myr consistent with the canonical age of the cluster (Lodieu et al. 2018; Martín et al. 2018). The metallicity has been subject to debate with discrepant estimates suggesting a mean metallicity close to solar (Fe/H = 0.05 ± 0.05; Gebran et al. 2010) or slightly super-solar between 0.127 ± 0.022 dex and 0.14 ± 0.10 dex (Boesgaard & Friel 1990;Cayrel de Strobel et al. 1997;Grenon 2000).
The surveys targeting the Hyades can be divided up into two main groups: the large-scale studies looking for a complete census of the cluster members over very large areas of the sky (Gizis et al. 1999; Goldman et al. 2013; Hanson 1975; Hogan et al. 2008; Reid 1992; Röser et al. 2011) or deeper surveys on small(er) patches in the cluster centre to iden-tify new members (Bouvier et al. 2008; Dobbie et al. 2002; Hanson 1975; Leggett et al. 1994; Melnikov & Eislöffel 2018; Reid & Gizis 1997; Reid et al. 1999; Reid 1993; Stauffer et al. 1995,1994). Subsequent spectroscopic follow-up has been con-ducted for many sources to confirm their membership via spectral typing, radial velocity and/or lithium content (Bryja et al. 1994; Leggett & Hawkins 1989; Mermilliod et al. 2009; Reid & Hawley 1999; Reid & Mahoney 2000; Soderblom et al. 1995;Stauffer et al.1995,1994;Tabernero et al. 2012;White et al. 2007). The current census down to approximately 0.1 M is
summarised inRöser et al.(2011) using the Positions and Proper Motion Extra Large catalogue (PPMXL;Röser et al. 2010) and the Panoramic Survey Telescope and Rapid Response System first data release (Pan-STARRS DR1; Chambers et al. 2016; Goldman et al. 2013;Kaiser et al. 2002) complemented by the L and T dwarf member candidates analysed byHogan et al.(2008) and Bouvier et al. (2008), respectively. The coolest members have been confirmed spectroscopically with masses below the hydrogen-burning limit (Bouvier et al. 2008; Casewell et al. 2014;Lodieu et al. 2014a,2018;Martín et al. 2018).
In this manuscript, we present an astrometric selection of Hyades cluster member candidates from the second Gaia data release (Gaia Collaboration 2018b) yielding a revised census and a 3D map with positions in the sky. In Sect. 2we present the input catalogue used for our study of the Hyades cluster and compile a list of previously-known members in Sect. 3. In Sect.4we describe complementary ground-based parallaxes from a dedicated programme carried out with the Liverpool telescope for the coolest member candidates of the cluster. In Sect. 5 we identify member candidates in the Hyades from Gaia DR2 and compare with previous studies to address the completeness and contamination of our sample. We dedicate Sect. 6 to the analysis of white dwarf members and their implication on the age of the cluster that we compare with other estimates. In Sect.7 we derive the luminosity and mass functions in the stellar and sub-stellar regimes. In Sect. 8 we discuss the spatial distribution of the highest probabil-ity member candidates and present the first 3D map of the Hyades from the most massive members down to the sub-stellar regime.
2. The Gaia DR2 sample
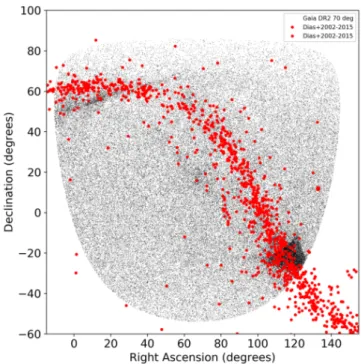
We made use of the Gaia DR2 data (Gaia Collaboration 2016, 2018b) released world-wide on April 25th 2018. Our objective was to start as inclusive as possible and to be more selective later in the process. Initially we started with all Gaia DR2 objects that were within 70◦of the nominal cluster centre at α= 67.0◦, δ = +16.0◦and had a parallax greater the 10 mas, that is within
100 pc, which results in 126 144 objects (Fig.1). We believe that the Hyades cluster has a on sky dimension of less than 30 pc (Röser et al. 2011). By extending the search from 30 to 70◦, our analysis shall include all possible members with measured par-allaxes but we will restrain our analysis to an volume of 30 pc from the cluster centre.
We cross-matched this catalogue with a series of well-known large-scale surveys to provide photometry over a wide wavelength range, keeping all Gaia DR2 sources without any
Fig. 1.Distribution of all sources in a radius of 70◦
from the cluster centre (small black dots) along with open clusters close to galactic plane (Dias et al. 2002,2006,2014,2018).
counterpart in those surveys either due to coverage or brightness-faintness reasons. The most precise match was obtained with a maximum distance of 1000. We did not use the official Gaia
DR2 cross-match tables but our own script with stilts (Taylor 2006b) because not all public large-scale catalogues are avail-able with the online archive. All the unresolved sources in the large-scale surveys that were resolved in Gaia were matched to the closest Gaia source which is normally the brighter of the two possible matches. All matches were made at the epoch of the target catalogues by applying the Gaia proper motions to possible counterparts. The number of matches within 1000 are 103 317 objects from the Two Micron All-Sky Survey (here-after 2MASS; Cutri et al. 2003; Skrutskie et al. 2006), 38 889 from the Sloan Digital Sky Survey data release 12 (SDSS DR12; Abolfathi et al. 2018); 6775 from the UKIRT Infrared Deep Sky Survey Galactic Clusters Survey (UKIDSS GCS; Lawrence et al. 2007); 107 009 from the Wide-field Infrared Sur-vey Explorer (AllWISE; Wright et al. 2010; Cutri et al. 2014); and 118 144 from the first data release of the Pan-STARRS DR1 (PS1; Kaiser et al. 2002; Chambers et al. 2016). All surveys completely covered the total region apart from UKIDSS which only covered ∼20 square degres centred on the Hyades nominal centre.
3. Previously known members
3.1. Compilation of known members
We compiled a list of known members from different surveys published over the past decade which represent the most com-plete surveys in the Hyades. We started with the following sub-samples: 724 stars fromRöser et al.(2011), 773 stars from Goldman et al.(2013) as well as 20 candidates fromDobbie et al. (2002). We also included ten confirmed L dwarfs fromHogan et al. (2008) confirmed spectroscopically byCasewell et al.(2014) and Lodieu et al. (2014b), two mid-L dwarfs from Schneider et al. (2017), one L5 from Pérez-Garrido et al. (2017), and the two
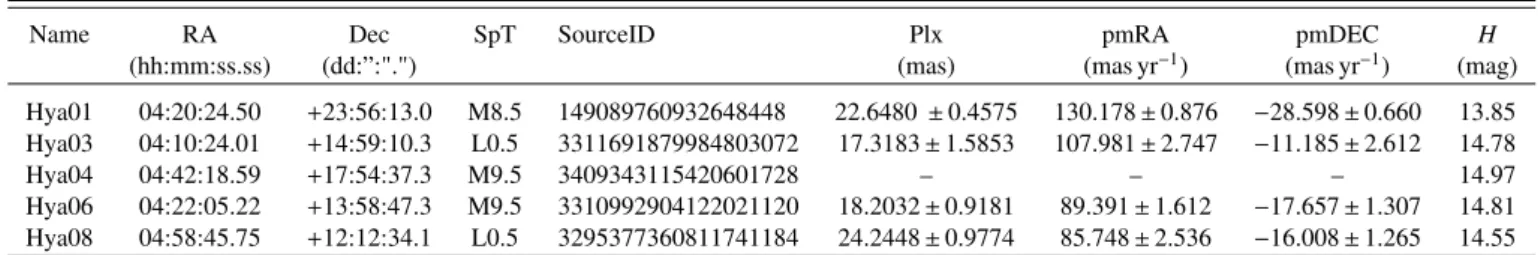
Table 1. Hyades late-M and early-L confirmed spectroscopically with Gaia proper motions and distances.
Name RA Dec SpT SourceID Plx pmRA pmDEC H
(hh:mm:ss.ss) (dd:”:".") (mas) (mas yr−1) (mas yr−1) (mag) Hya01 04:20:24.50 +23:56:13.0 M8.5 149089760932648448 22.6480 ± 0.4575 130.178 ± 0.876 −28.598 ± 0.660 13.85 Hya03 04:10:24.01 +14:59:10.3 L0.5 3311691879984803072 17.3183 ± 1.5853 107.981 ± 2.747 −11.185 ± 2.612 14.78
Hya04 04:42:18.59 +17:54:37.3 M9.5 3409343115420601728 – – – 14.97
Hya06 04:22:05.22 +13:58:47.3 M9.5 3310992904122021120 18.2032 ± 0.9181 89.391 ± 1.612 −17.657 ± 1.307 14.81 Hya08 04:58:45.75 +12:12:34.1 L0.5 3295377360811741184 24.2448 ± 0.9774 85.748 ± 2.536 −16.008 ± 1.265 14.55
Notes. Hya05 (M3) and Hya07 (M5) are not listed below because they were rejected as spectroscopic members of the Hyades based on their optical spectra (Lodieu et al. 2014b). The other L dwarfs are not in Gaia but listed in Table2with ground-based parallaxes.
T dwarfs from Bouvier et al. (2008). After removing common sources from these catalogues, we are left with 837 high-probability candidates with proper motion and photometry con-sistent with membership to the Hyades.
3.2. Cross-correlation with Gaia DR2
We cross-matched this list with Gaia DR2 with a matching radius of 300, returning 825 sources equivalent to a
recov-ery rate of 99%. The sources not recovered are mainly sub-stellar, including HyaL5 (Pérez-Garrido et al. 2017), the two mid-L dwarfs from Schneider et al.(2017), the two T dwarfs fromBouvier et al.(2008), Hya09 and Hya12 fromHogan et al. (2008), as well as four sources (ID= 30, 324, 651, 671) from Goldman et al. (2013) and one (h7334b) from Dobbie et al. (2002). The ten brightest Hyades members are also recorded in the Gaia DR2 catalogue. We conclude that Gaia is com-plete down to the hydrogen-burning limit but incomcom-plete in the sub-stellar regime in the Hyades cluster because it is miss-ing the seven aforementioned brown dwarfs. We do not know why the five targets above from Goldman et al. (2013) and Dobbie et al.(2002) are missing from DR2 (less than 1%). We checked that those objects are real on the Digital Sky Survey and 2MASS images although one of them (h7334b) appears faint, which may explain why it has no entry in Gaia. Three of them have proper motions quoted in Simbad and two of them (Goldman30, Goldman324) have entries in the Gaia DR2 cat-alogue without astrometry but effective temperature estimates and 2-parameter solutions. We also note that Goldman30 is classified as a M5 at 22 pc by Newton et al.(2015) and Gold-man671 might belong to a young moving group (Gagné et al. 2015a).
We cross-correlated these 837 pre-Gaia members with our catalogue within 70◦from the Hyades centre and recovered 749 of these previously-known sources. The objects not recovered in our catalogue (837 − 749) have parallaxes less than 10 mas, which is our lower limit to create the 70◦catalogue.
We have also cross-correlated this list of 749 pre-Gaia members with the catalogue of 515 Hyades sources published by Gaia Collaboration (2018a), yielding 415 objects in com-mon. We used the SourceID parameter for the cross-correlation to avoid any mis-matching based on coordinates. Therefore, we conclude that earlier surveys of the Hyades may have excluded about 20% of known members if the new candidates from Gaia Collaboration (2018a) are confirmed as members. We note that Röser et al. (2011) estimated a level of con-tamination of the order of ∼9% with 65 field stars in their sample of 724 Hyades candidates based on a control sam-ple of stars with Hipparcos parallaxes and/or published radial velocities.
4. Ground-based parallaxes of Hyades L/T dwarfs
4.1. Targets
We selected the faintest Hyades members confirmed spectro-scopically from three surveys. First, ten of the 12 ultracool dwarf candidates from Hogan et al. (2008), confirmed spectroscopi-cally as late-M and early-L dwarfs byCasewell et al.(2014) and Lodieu et al. (2014b). Second, the recent L5 dwarf discovered by Pérez-Garrido et al. (2017) and confirmed as a sub-stellar member by Lodieu et al.(2018). Third, the two early-T dwarf members reported byBouvier et al.(2008), the coolest members known to date.
We estimated the Gaia G-band magnitude of these sources with the equation G − J ∼ 0.244 × SpT − 12.633, where SpT is the numerical counterpart of the spectral type with L0≡70 and T2≡82 as examples (Smart et al. 2017a). We discarded the confirmed late-M and L dwarfs brighter than G= 20.7 mag because we predicted they would have Gaia astrometry. We pro-grammed the remaining eight sources for astrometric follow-up with the infrared camera on the Liverpool telescope. This strategy has been proven to be effective because all the sources not included in our parallax programme have Gaia dis-tances (Table1), except Hya04 (2MASS J04421859+1754373; Hogan et al. 2008) which has been included in the Gaia DR2 (ID= 3409343115420601728) with just positions; we expect it to have full astrometry in the next release.
4.2. Observations
We targeted the eight Hyades L and T dwarf member candi-dates with the infrared camera IO:I (Barnsley et al. 2016) on the 2-m robotic Liverpool telescope (Steele et al. 2004) over three semesters between August 2015 and January 2018 (CL15B06, CL16B03, CL17B01; PI Lodieu). We requested a seeing better than 1.500and an elevation on the sky higher than 30◦. We also
asked for a sky brightness better than the “dark+4 magnitudes” definition of the Liverpool telescope, which means that our pro-gramme could be observed with bright moon and astronomical twilight in the worst case.
The IO:I instrument was installed on the Liverpool telescope in August 2015. It uses a 2048 × 2048 pixel Hawaii 2RG offering a field of view of 6.3 arcmin and a pixel scale of 0.1800. It is
currently solely equipped with a H-band filter. The blue and red cut-offs at 1.4 and 1.8 microns are set by the detector and the filter, respectively.
To optimise the determination of the parallax from the ground, we designed the following strategy. We requested seven observations per semester for each target, distributed as follows: three points during morning and evening twilights spread over 1.5 months and separated by about two weeks to maximise the
Fig. 2.Root-mean-square of the error of the mean between the first IO:I epoch and the remaining epochs as a function of instrumental H-band magnitude for three of the eight targets (Hya02, Hya09, and HyaL5 from left to right) for which we determined ground-based distances. The circled objects are the targets.
parallax factors and an additional point in the middle of the night to improve the proper motion solution. We repeated this strat-egy for three semesters over three years. However, the past two winter semesters have suffered from significantly poor weather, yielding a small number of points during the past two years. Nonetheless, we were able to collect between ten and 17 points per object (TableA.1–A.8).
We employed the same dithering procedure for all targets: we used individual on-source integrations of 10 s with a 9-point dither pattern to optimise the sky subtraction in the H-band. We repeated this sequence seven times for all objects, yielding a total on-source exposure time of 630 s, except for the two faintest tar-gets: the L5 dwarf (Pérez-Garrido et al. 2017) and CFHT-Hy-20 (Bouvier et al. 2008), which we repeated ten times for a total time of 900 s.
4.3. Data reduction
We downloaded directly from the archive the reduced images from the automatic pipeline designed for IO:I (Barnsley et al. 2016). We refer the reader to that paper for more detailed infor-mation. To summarise, the pipeline includes bias subtraction, non-linearity correction, flat fielding, bad pixel masking, and sky subtraction for each of the 9-point dither position resulting in seven or ten repeated images with a world coordinate system incorporated.
In a second step, we combined the seven or ten repeated posi-tions with the imcombine task under IRAF (Tody 1986,1993) to create a final image for each target equivalent to the total on-source integrations quoted in Sect. 4.2. The stacking and o ff-setting of the individual repeats were performed within the task imcombine using the offsets from the header. We verified that the full-width-half-maximum on the final image was consistent with the range of seeing measured on individual repeats. We used the combined images to proceed with the centroiding procedure to derive trigonometric parallaxes (Fig.2). We carried out the centroiding of all objects in the combined images using the Cam-bridge Astronomy Survey Unit’s imcore maximum likelihood barycentre (CASUTOOLS; v 1.0.211). We also tried other
pack-ages but the centroiding from this package was the most robust and provided the most consistent floor to the precision as shown in Fig.2.
1 casu.ast.cam.ac.uk
4.4. Astrometric parameter determination
The astrometric reduction was carried out using the Torino Observatory Parallax programme pipeline procedures and the reader is referred to Smart et al. (2003) for details and Smart et al. (2010) for some results. Here we just outline the main steps of the procedure. A base frame, observed on a night with good seeing, was selected and the measured x,y positions of all objects were transformed to a standard coordinate ξ, η system determined from a gnomic projection of the Gaia DR2 objects in the frame. All subsequent frames were transformed to this standard coordinate system with a simple six constant linear astrometric fit using all common objects except the tar-get. We then removed any frames that had an average reference star error larger than three times the mean error for all frames in either coordinate, or, had less than 12 stars in common with the base frame. This cleaning resulted in one frame being removed in the solutions of Hya10/Hya12/HyaL5 out of 12/17/12 frames, respectively, and two frames from the 15 in the Hya19 sequence.
Since the target is not used in the fit, its positional change is a reflection of its parallax and proper motion. We fit a simple five parameter model to this positional change, and that of all the other objects in the field, to find their astrometric param-eters implicitly assuming that all objects are single. We then iterate this procedure where, in addition to removing frames as described above, we also remove objects with large errors over the sequence from the sub-set used to astrometrically align frames. Finally, for the target we removed any observations where the combined residuals of the two coordinates is greater than three times the sigma of the whole solution. No attempt was made to improve the astrometric fit by assuming a binary system because the length of the observational sequence and small num-ber of observations would not support such a fit.
The solutions were tested for robustness using bootstrap-like testing where we iterate through the sequence selecting di ffer-ent frames as the base frame thus computing many solutions that incorporate varied sets of reference stars and starting from di ffer-ent dates. We create the sub-set of all solutions with: (i) a paral-lax within 1σ of the median solution; (ii) the number of included observations in the top 10%; and (iii) at least 12 reference stars in common to all frames. From this sub-set, for this publication, we have selected the one with the smallest error. More than 90% of the solutions were within 1σ of the published solution.
To the relative parallaxes we add a correction to find astrophys-ically useful absolute parallaxes. This correction is estimated from
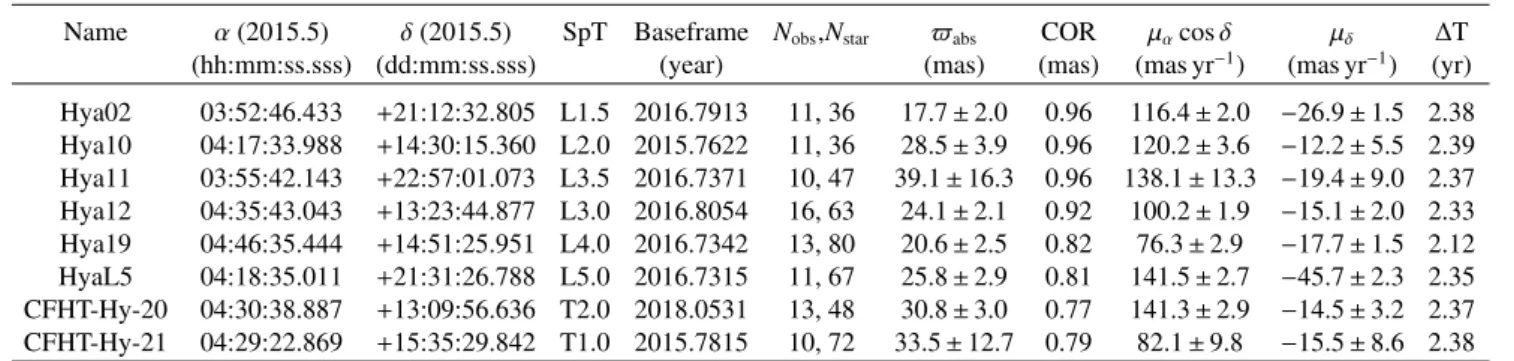
Table 2. Hyades L/T members with ground-based parallaxes from the Liverpool telescope.
Name α (2015.5) δ (2015.5) SpT Baseframe Nobs,Nstar $abs COR µαcos δ µδ ∆T
(hh:mm:ss.sss) (dd:mm:ss.sss) (year) (mas) (mas) (mas yr−1) (mas yr−1) (yr)
Hya02 03:52:46.433 +21:12:32.805 L1.5 2016.7913 11, 36 17.7 ± 2.0 0.96 116.4 ± 2.0 −26.9 ± 1.5 2.38 Hya10 04:17:33.988 +14:30:15.360 L2.0 2015.7622 11, 36 28.5 ± 3.9 0.96 120.2 ± 3.6 −12.2 ± 5.5 2.39 Hya11 03:55:42.143 +22:57:01.073 L3.5 2016.7371 10, 47 39.1 ± 16.3 0.96 138.1 ± 13.3 −19.4 ± 9.0 2.37 Hya12 04:35:43.043 +13:23:44.877 L3.0 2016.8054 16, 63 24.1 ± 2.1 0.92 100.2 ± 1.9 −15.1 ± 2.0 2.33 Hya19 04:46:35.444 +14:51:25.951 L4.0 2016.7342 13, 80 20.6 ± 2.5 0.82 76.3 ± 2.9 −17.7 ± 1.5 2.12 HyaL5 04:18:35.011 +21:31:26.788 L5.0 2016.7315 11, 67 25.8 ± 2.9 0.81 141.5 ± 2.7 −45.7 ± 2.3 2.35 CFHT-Hy-20 04:30:38.887 +13:09:56.636 T2.0 2018.0531 13, 48 30.8 ± 3.0 0.77 141.3 ± 2.9 −14.5 ± 3.2 2.37 CFHT-Hy-21 04:29:22.869 +15:35:29.842 T1.0 2015.7815 10, 72 33.5 ± 12.7 0.79 82.1 ± 9.8 −15.5 ± 8.6 2.38 Notes. We give the names, coordinates at epoch 2015.5 to be consistent with Gaia DR2 (Table1), optical spectral types (Lodieu et al. 2014b; Martín et al. 2018), epochs of the base frame, the number of observations used in the solutions (Nobs) with the numbers of reference stars entering
the fit (Nstar), the corrections from relative to absolute parallax (COR), the proper motions, the baselines of the observational sequence (∆T).
Fig. 3.Left panels: residuals in mas as a function of epoch for right ascension (bottom) and declination (top). Right panel: solution for the parallax determination. We show the example of CFHT-Hy-20, the other objects are plotted in AppendixA. The circled dot highlights the reference frame used for the determination of the parallax.
the difference of the median Gaia DR2 parallaxes of the common reference stars to the measured median parallax calculated from the observations. As can be seen from Table2, this correction is always less than 1 mas and we added 20% of the correction to the formal parallax uncertainty in quadrature to obtain the quoted errors. The results are summarised in Tables1–2and in Fig.3we show the on-sky motion and the residuals for target CFHT-Hy-20 along with the solution. The epochs of observations and plots of the solution and residuals for the other targets are included in TablesA.1–A.8and Figs.A.1–A.4.
This is the first time that parallaxes have been determined with IO:I on the Liverpool robotic telescope and demonstrates that it is possible to derive useful ground-based parallaxes up to ∼50 pc. There remains an important sample of very cool nearby objects that are too faint for Gaia but possible on this telescope-and-instrument combination.
5. Selection of Hyades member candidates
In this section, we implemented the kinematic procedure described byPerryman et al.(1998), whose technique was
orig-inally described in Jones (1971). This method determines the barycentre of the cluster and identifies potential members based on their velocities in space (Sect.5.1).
We decided to use this method because it was specifically developed for the Hipparcos satellite, whose astrometry offers much higher accuracy than ground-based surveys. The advent of Gaiaprovides even more accurate parallaxes and proper motions for a significantly larger number of stars in the Galaxy.
5.1. The kinematic method
We applied the kinematic procedure ofPerryman et al. (1998) to the sample of 126 144 objects located within a radius of 70◦from the cluster centre at (RA,Dec)= (67,16)◦. This method has been successfully applied to the Hyades using Hipparcos (Perryman et al. 1998; de Bruijne et al. 2001) and Gaia DR1 (Reino et al. 2018).
We implemented the Bayesian method using equations 17 and 18 ofLuri et al.(2018) to transform Gaia parallaxes into dis-tances. To determine the membership probability of all objects in the 70◦area, we calculated the space velocity of the Hyades
Table 3. Positional and kinematics data of the Hyades cluster.
Selection N bc(pc) uc(km s−1) Distance Velocity
bx by bz vx vy vz pc km s−1
Pre 154 −44.49 ± 0.16 0.18 ± 0.10 −17.10 ± 0.08 −42.23 ± 0.09 −19.23 ± 0.03 −1.18 ± 0.05 47.66 ± 0.18 46.42 ± 0.10 r< 10 pc 122 −43.83 ± 0.18 0.42 ± 0.11 −17.05 ± 0.09 −42.14 ± 0.11 −19.26 ± 0.04 −1.12 ± 0.05 47.03 ± 0.20 46.34 ± 0.12 r< 20 pc 168 −44.45 ± 0.15 0.26 ± 0.10 −17.16 ± 0.08 −42.19 ± 0.10 −19.25 ± 0.03 −1.14 ± 0.05 47.65 ± 0.17 46.39 ± 0.11
Notes. First row shows the data obtained with the preliminary list of 154 Hyades members. Second (third) row display the results after recalculating cluster centre and velocity with objects from the final list closer than 10 pc (20 pc) to the cluster centre.
Table 4. Summary of numbers of members in our work and from the various cross-matches with catalogues from previous studies (Sect.5.2).
Method Members Comments
This paper 85, 381, 568, 710 within 3.1, 9, 18, 30 pc
Recovered inPerryman et al.(1998) 129 out of 192 Memb= 1 from Perryman; 127 within 30 pc Recovered inPerryman et al.(1998) None Memb= ? or 0 from Perryman
Recovered inGaia Collaboration(2018a) 503 out of 515 all within 20 pc
Recovered inReino et al.(2018) 169 out of 187 GaiaDR1; 159 within 30 pc Recovered among pre-Gaia known members 70, 306, 443, 518 within 3.1, 9, 18, 30 pc from 749
Recovered in BANYAN 85, 376, 469, 484 within 3.1, 9, 18, 30 pc (568 candidates using BANYAN)
cluster followingPerryman et al.(1998). For the sake of clarity we sketch this method below. The Gaia mission provides high quality parallax measurements (π), proper motions (µαcos δ, µδ), and radial velocities (VR); the latter only for the brightest
sources (G ∼ 5–13 mag). In a first step we calculate the cluster barycentre (bc) and space velocity (uc= vx, vy, vz) using a
pre-liminary set of Hyades members selected byGaia Collaboration (2018a). We calculated these quantities using the standard expressions: bc= P mibi P mi , uc= P miui P mi , (1)
where bi = (dicos αicos δi, disin αicos δi, disin δi) is the
posi-tional vector for object i, with equatorial coordinates αi and δi
and located at a distance di (measured in pc). The mass mi is
estimated using predicted magnitudes and G − J colours from the Padova and BT-Settl models (see Sect.7.2for more details). The mass is used in the calculation of the barycentre but as a weight. Assuming that binaries are distributed isotropically with respect to the centre then the barycentre should not change. We checked that this is the case assuming that all stars have a mass of 1 M , which would largely account for binaries. This fact agrees
with the conclusions of Perryman et al.(1998) andReino et al. (2018) who concluded that “these results are rather insensi-tive to the weighting scheme adopted”. In conclusion, binaries do impact on the total mass and the mass function (Sect.7.2) but not the barycentre. The velocity vectors (ui) are
calcu-lated using the object transverse and radial velocities with the equation: vix viy viz = Ri Viα∗ Viδ ViR , (2)
where Viα∗= µiα∗Av/πi, Viδ= µiδAv/πi, and ViRare the observed
transverse and radial velocities, with Av= 4.74047 km yr s−1.
The matrix Riis given by:
Ri=
− sin αi − sin δicos αi cos δicos αi
cos α − sin δisin αi cos δisin αi
0 cos δi sin δi , (3)
In a second step, we use uc to select objects in the Gaia
database with motions consistent with the cluster. To carry out this task, we estimate the expected transverse and radial veloci-ties at the position of each object:
Ve iα∗ Viδe Ve iR = R −1 i vx vy vz , (4)
where R−1i is actually the transpose matrix of Rifrom Eq. (3). We
define the vector zias the difference vector between the observed
and expected transverse and radial velocities. We need to calcu-late two covariance matrices, one associated with the observed transverse or radial velocities and the other associated with the expected ones (see detailed explanation inPerryman et al. 1998). Assuming that these velocities are statistically independent, the sum of their two covariance matricesΣ describes the combined confidence region and the parameter:
c= zTΣ−1z, (5)
is a χ2 statistical test with three degrees of freedom (DOF). As not all the objects in Gaia have radial velocities we adapted the method to work also with transverse velocities only. For sources without radial velocity the test has only two d.o.f. We selected as good candidates those objects with velocities within 4.4171σ of common cluster motion, which correspond to a p value of 0.99999. Thus for three d.o.f. (objects with radial velocity mea-sured), all sources with c < 25.9 are considered as Hyades mem-bers, while for objects without radial velocity in Gaia data, that is two DOF statistic, the threshold is 23.03.
From the preliminary list of Hyades members from Gaia Collaboration(2018a) we calculated bcand uc, as explained
above, and checked whether all sources in that list can be con-sidered as good members of the cluster using the value of the cparameter (Eq. (5)). Discarding those with values of c larger than the chosen threshold and then recalculating new values for bcand uc. This procedure is repeated until no further objects are
discarded. At the end of this process we have 154 objects and the final values of ucare employed to assess which objects from
Fig. 4.Left panel: parallax as a function of the G-band magnitudes from Gaia DR2 for candidates within radii of 3.1 pc (yellow), 9 pc (blue), 18 pc (green), and 30 pc (red) from the cluster centre. Right panel: parallax as a function of the total proper motion from Gaia DR2. We added as small grey dots the full Gaia catalogue over the 70◦
radius.
Gaiacatalogue can be considered as bona-fide Hyades members. In Table3we list the barycentre and cluster velocity in Galactic coordinates. We applied this procedure to the list of 126 motions to the cluster. This final list is then used to re-estimate bcand
uc(Table3). The cluster centre velocity obtained when we use
objects located in a radius of 10 pc from the cluster centre is employed to carry out a second iteration with the final list of 1764 objects checking that all of them continue to be considered as good Hyades members.
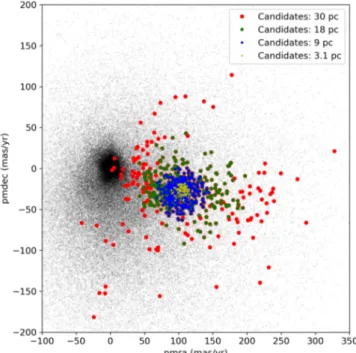
As discussed at length in Röser et al. (2011), most of the members of the cluster lie within its tidal radius. In the case of the Hyades, all objects within 9 pc are most likely bound while the candidates up to 18 pc most likely belong to its halo. Kine-matic candidates in the 18–30 pc might belong to the Hyades moving group (Boss 1908; Eggen 1958; Zuckerman & Song 2004; Famaey et al. 2007) but we expect a significant level of contamination. We do not consider the candidates beyond the 30 pc limit in this work (710 sources). We limit our analysis to the core (3.1 pc), tidal radius (9 pc), halo (18 pc), and up to 30 pc from the cluster centre in 3D space to allow for direct compar-ison with the work of Röser et al.(2011). The kinematic pro-cedure returned 85, 381, 568, and 710 sources within 3.1, 9, 18, and 30 pc, respectively (Figs.4–5). The large area at around RA= 90–100◦ and declinations around zero containing
candi-dates further than 30 pc from the centre of the Hyades corre-sponds to clusters in the galactic plane, and possibly to Platais 6, whose extension on the sky is estimated to be 250 arcmin (Dias et al. 2002,2006,2014,2018).
We display several colour–magnitude diagrams in Appendix B, showing combinations of Gaia magnitudes with other large-scale surveys (Figs. B.1–B.3). We display all candidates identified in this work as black dots and highlight the members located within 3.1, 9, 18, and 30 pc with yellow, blue, green, and red symbols, respectively. The sequences drawn in those colour–magnitude diagram represent benchmark sequences at an age of 650 Myr, which are key to compare with other clusters and members of moving groups.
Fig. 5.Vector point diagram with proper motions in right ascension and declination for all sources in the full 70◦
catalogue (grey). We over-plot kinematic candidate members belonging to the Hyades and located within radii of 3.1 pc (yellow), 9 pc (blue), 18 pc (green), and 30 pc (red).
5.2. Comparison with previous Hyades surveys 5.2.1. Hipparcos catalogue fromPerryman et al.(1998) We cross-correlated our sample of Hyades candidate members with the Hipparcos catalogue (Perryman et al. 1998), which is divided up into three groups: 192 members (Memb= 1), 20 prob-able members (Memb= ?), and 60 non-members (Memb = 0). The Gaia DR2 catalogue contains 183 of the 192 members (>95% completeness) but only 13 of the 69 probable members
(18.8%) and 31 of the 60 non-members (51.7%). We recov-ered 129 sources of the 192 objects classified as members (Memb= 1 in their table), see Table4in our full list, including 127 being within 30 pc. The remaining 63 sources do not sat-isfy the criteria of the kinematic method because they have “c” indices larger than 25.9 or 23.03 depending on the availability of Gaia radial velocity. None of the other candidates reported by Perryman et al.(1998) as probable members or likely non-members in their table have counterparts in our catalogue of can-didates within 70◦from the cluster centre.
We expect some difference because the cluster parame-ters derived from Gaia DR2 are slightly different from those inferred by Hipparcos: from our 10 pc sample, we find that a mean distance and velocity of the cluster is 47.03 ± 0.20 pc and 46.38 ± 0.12 km s−1, respectively, compared to 46.34 ± 0.27 pc and 45.93 ± 0.23 km s−1for the Hipparcos 10 pc sample (Table 3
ofPerryman et al. 1998). We note that the global Gaia zero point is −0.03 mas but it varies upon position in the sky by 0.15 to −0.15 mas (Lindegren et al. 2018). This correction is negligible compared to the average parallax of the Hyades (∼21–22 mas). The Gaia–Hipparcos offset is −0.118 mas (Arenou et al. 2018), which means that the distance of the Hyades from Hipparcos put on the Gaia system would equate into 46.595 pc, close to our esti-mate using the 10 pc sample. This is the distance we adopt in this work. The distance fromGaia Collaboration(2018a) makes use of all kinematic members up to 16 pc (Sect. 4 inGaia Collaboration 2017) and should therefore be closer to our 20 pc estimate, which is indeed the case within 1σ. This difference will lead to some variation in the numbers of kinematic members.
5.2.2. Gaia DR2 catalogue (Gaia Collaboration 2018a) We cross-correlated our sample with the list of 515 member candidates fromGaia Collaboration(2018a). The matching was based on the SourceID parameter to avoid any mis-matches due to positional matching problems. We recovered 503 out of 515 objects that lie in a radius of approximately 16 pc, the limit set intrinsically by the procedure described in Gaia Collaboration (2018a). We find that only a small number of sources of Gaia Collaboration (2018a) are not in our sample of member candidates. The small difference in numbers is most likely due to the divergence between our space velocity and distance esti-mates. Furthermore, Gaia Collaboration (2018a) clearly stated in their Sect. 2 that they “selected the most precise data, with-out trying to reach completeness”. This is particularly the case in the low-mass and sub-stellar regimes where Gaia gives larger astrometric errors but remains nonetheless reliable. We noticed this effect when comparing their candidates with our sam-ple in the various colour-magnitude diagrams presented in this work.
5.2.3. TGAS catalogue fromReino et al.(2018)
We collected the Gaia DR2 SourceID of the 251 candidates identified byReino et al.(2018) based on Tycho-Gaia DR1 cat-alogue. Reino et al. (2018) kept 187 out of 251 candidates as bona-fide members while the other were rejected on the basis of their modelled parallaxes and standard errors. We found that 242 of the 251 have Gaia DR2 counterparts. We checked that the nine missing objects have entries in the second release of Gaia without parallax and proper motion. We recovered 169 as poten-tial members of the Hyades, including 159 within 30 pc from the centre (Table4).
5.2.4. Known members
We cross-correlated our sample with the list of 749 known members with Gaia DR2 parallaxes and located within 70◦
of the cluster. We conducted the cross-correlation with the SourceID keyword as before. In the full 70◦, we retrieved 527 pre-Gaia known members. We recover eight of the ten brightest Hyades members, exceptΘ1Tauri (G5III; c= 398.325; Keenan & McNeil 1989) and 71 Tauri (F0V; c= 85.39), whose Gaia parallaxes and proper motions confirm their member-ship. The former is a known spectroscopic binary and the lat-ter is a known variable star. These eight bright members are the brightest sources in the colour–magnitude diagrams showing Gaiaphotometry (e.g. Fig.6). All these sources lie within 6 pc from the cluster centre. Therefore, 749 − 527= 222 previously-known members are rejected by the kinematic method because their “c” indices are larger than the maximum values allowed for membership even though their proper motions, paral-laxes and magnitudes maybe consistent with other Hyades members. We conclude that the level of contamination from earlier surveys using the convergent point method is about 30%, consistent with ground-based photometric surveys in the Pleiades (Bouvier et al. 1998; Moraux et al. 2001) and Alpha Persei (Barrado y Navascués et al. 2002;Lodieu et al. 2005). We recovered 140, 312, 446, and 522 pre-Gaia known members within 3.1, 9, 18, 30 pc from the cluster centre, respectively (Table4). Hence, the level of completeness of previous surveys is decreasing with larger radii, from 80.9% in the 3.1 pc radius to 73.6% in the halo.
5.3. Comparison with BANYAN
Malo et al.(2013) developed a new method based on a Bayesian analysis to identify new members of nearby young kine-matic groups and assess their membership probability. This method, the Bayesian Analysis for Nearby Young AssociatioNs (BANYAN), was later updated byGagné et al.(2014) and fur-ther improved by Gagné et al.(2018a) to model the 6D space with multi-variate Gaussians to take advantage of Gaia. This algorithm has been successfully employed to revise the mem-bership of known members of young moving groups and also identify new candidates in a series of papers (Artigau et al. 2015;Boucher et al. 2016; Gagné et al. 2015b,a,2017,2018b; Malo et al. 2014a,b).
The new BANYAN Σ algorithm is freely available2 and
includes the Hyades in the list of nearby associations. We used the IDL version which allowed us to calculate probabilities using proper motions, parallaxes and radial velocities or sub-sets of those parameters. We did not incorporate any extra constraints, for example indicators of youth. We ran this algorithm on the full 70◦catalogue (126 144 objects), and 568 objects were returned
with a most probable Bayesian hypothesis of being a Hyades member. The cluster parameters given in Table 9 ofGagné et al. (2018a) are the updated parameters of the Hyades combining GaiaDR1 (Gaia Collaboration 2017) with member candidates from Eggen (1969), Perryman et al. (1998), Mermilliod et al. (2009), andRöser et al.(2011).
We cross-correlated our full sample of 1764 sources with the 568 candidates from BANYAN and found 484 objects in com-mon. Limiting the analysis to the radii of 3.1, 9, 18, and 30 pc from the cluster centre, we have 85, 376, 469, and 484 in com-mon with BANYAN, respectively. The remaining 568−484= 84
Table 5. Hyades WDs in Gaia DR2: single WDs are at the top and binary WDs at the bottom.
SourceID Name RA Dec Plx pmRA pmDEC Bp Rp G
(deg) (deg) (mas) (mas yr−1) (mas yr−1) (mag) (mag) (mag)
45980377978968064 EGGR29 62.3709338 17.1316806 19.9402 ± 0.0931 111.4542 ± 0.2682 −22.0215 ± 0.1464 15.302 15.460 15.378 3294248609046258048 HZ14 70.2576501 10.9943984 20.2471 ± 0.0510 91.3544 ± 0.0937 −10.6426 ± 0.0497 13.669 14.108 13.864 3306722607119077120 HZ7 68.4377818 12.7111484 21.1400 ± 0.0616 99.0219 ± 0.1237 −14.3138 ± 0.0711 14.122 14.437 14.262 3308403897837092992 EGGR316 70.0999149 13.9793215 21.7321 ± 0.0563 95.2761 ± 0.1097 −20.6871 ± 0.0512 14.810 15.006 14.932 218783542413339648 GD52 58.0005259 34.1241725 23.5584 ± 0.0457 145.9926 ± 0.0980 −77.6952 ± 0.0668 15.153 15.257 15.202 3313714023603261568 EEGR37 67.1646712 16.9699097 20.8952 ± 0.0567 102.6919 ± 0.1147 −26.8853 ± 0.0681 13.913 14.288 14.075 3313606340183243136 EGGR36 65.9825865 16.3540809 22.2272 ± 0.0519 114.4115 ± 0.1034 −27.7153 ± 0.0792 14.219 14.505 14.347 39305036729495936 HG7-85 60.9260025 14.9912221 24.0527 ± 0.0541 141.1900 ± 0.1073 −24.0698 ± 0.0843 14.984 15.112 15.039 3302846072717868416 HZ4 58.8423743 9.7883468 28.5890 ± 0.0536 173.2722 ± 0.1072 −5.5099 ± 0.0788 14.511 14.644 14.564 43789772861265792 V471-Tau 57.6046015 17.2464125 20.9569 ± 0.0440 127.4578 ± 0.0956 −22.4774 ± 0.0643 9.678 8.591 9.200 3310615565476268032 HD27483 65.2201424 13.8643726 21.0518 ± 0.0769 106.9751 ± 0.1947 −12.7011 ± 0.1071 6.284 5.683 6.033 3314232855652895104 HZ9 68.0994836 17.7505941 23.2618 ± 0.0373 109.8651 ± 0.0661 −34.5059 ± 0.0419 14.030 12.445 13.362 3311810043124387712 LP474-185 63.4688348 15.3649605 23.6172 ± 0.5733 116.2583 ± 1.0037 −24.2140 ± 0.7910 15.417 12.495 14.257
Table 6. Derived parameters for the eight single DA WD members in the Hyades, considered for the age determination.
SourceID MWD MMS TimeWD TimeMS Timetotal SpT Teff log g
(M ) (M ) (Myr) (Myr) (Myr) (K) (dex)
45980377978968064 0.826 3.823+0.637−0.478 355.0 236.8+107.2−80.2 591.8+107.2−80.2 DA3.2 15810 ± 288 8.38 ± 0.05 3294248609046258048 0.708 2.9657+0.412−0.343 20.4 487.8+214.6−152.7 508.2+214.6−152.7 DA1.8 27540 ± 403 8.15 ± 0.05 3306722607119077120 0.666 2.673+0.349−0.299 78.8 664.7+272.6−203.9 743.4+272.6−203.9 DA2.3 21890 ± 346 8.11 ± 0.05 218783542413339648 0.838 4.003+0.692−0.508 475.2 208.5+95.2−71.3 683.7+95.2−71.3 DA3.4 14820 ± 350 8.31 ± 0.05 3313714023603261568 0.691 2.863+0.388−0.327 44.8 542.8+232.9−169.8 587.6+232.9−169.8 DA2.0 25130 ± 381 8.12 ± 0.05 3313606340183243136 0.693 2.879+0.391−0.330 112.8 533.7+229.8−167.0 646.6+229.8−167.0 DA2.5 20010 ± 315 8.13 ± 0.05 39305036729495936 0.816 3.693+0.598−0.456 400.4 260.2+117.1−87.0 660.6+117.1−87.0 DA 15131 ± 209 8.48 ± 0.02 3302846072717868416 0.780 3.373+0.510−0.405 359.2 336.1+150.0−109.3 695.2+150.0−109.3 DA3.4 14670 ± 377 8.30 ± 0.05
objects from BANYAN are not in our list. About a quarter of these sources have right ascension below 60◦, lying in the tail of
members identified by BANYAN (Table4). The differing can-didate lists are most likely the result of the very different mem-bership allocation procedures and also the different distance and space velocities between Hipparcos/BANYAN (Perryman et al. 1998;Gagné et al. 2018a) and this work.
6. White dwarfs
One striking feature in the Hertzsprung–Russell diagrams dis-played in Fig. 17 of Gaia Collaboration (2018a) is the pres-ence of white dwarf (WD) members at around Bp − Rp < 0 and G ∼ 14–16 mag. The existence of WDs in the Hyades has been known since the discovery of ten WDs by von Hippel (1998). Seven of these “classical” WD are single while three are binaries (Table 5) and one of them a doubtful member due to its distance and tangential velocity (Weidemann et al. 1992). Schilbach & Röser (2012) presented a compendium of WD candidates in the Hyades, including the ten classical WDs (von Hippel 1998) and three new sub-groups: one with 12 new potential Hyades WDs (running number from 11 to 22) and two additional ones with most likely non-members (running number from 23 to 37).
We cross-matched this list of 37 WD candidates from Schilbach & Röser (2012) with our Gaia DR2 and recovered 13 WDs previously published in the literature (Table 5). All the ten classical WDs (seven singles and three binaries) from von Hippel (1998) are confirmed as members based on Gaia parallaxes and proper motions and common to the sequence of
WDs fromGaia Collaboration (2018a). We note that the three classical WD binaries are unresolved in Gaia because they have orbital periods less than about 3 days. Three other WDs from the Gaiasample are common to the sub-group of new WD mem-bers in Table 1 of Schilbach & Röser (2012). The remaining 37−15= 22 candidates inSchilbach & Röser(2012) are rejected as members based on their parallaxes and proper motions. All the three brightest WDs are binaries and appear much redder in the Gaia colours (bottom panels in Fig. 6). The WD+dM binary (EGGR 38; HZ9) lies between the WD sequence and the cluster main sequence in the (Bp − Rp,Rp) colour–magnitude diagram. The other two classical binaries lie on the cluster main-sequence: one is a known WD+F6 binary (HR 1358; HD 27483) and the other one is the known eclipsing binary of Algol type (WD+K2) V 471 Tau (Fig. 6). We find one more binary, LP 474-185 Schilbach & Röser (2012), based on Gaia photometry.
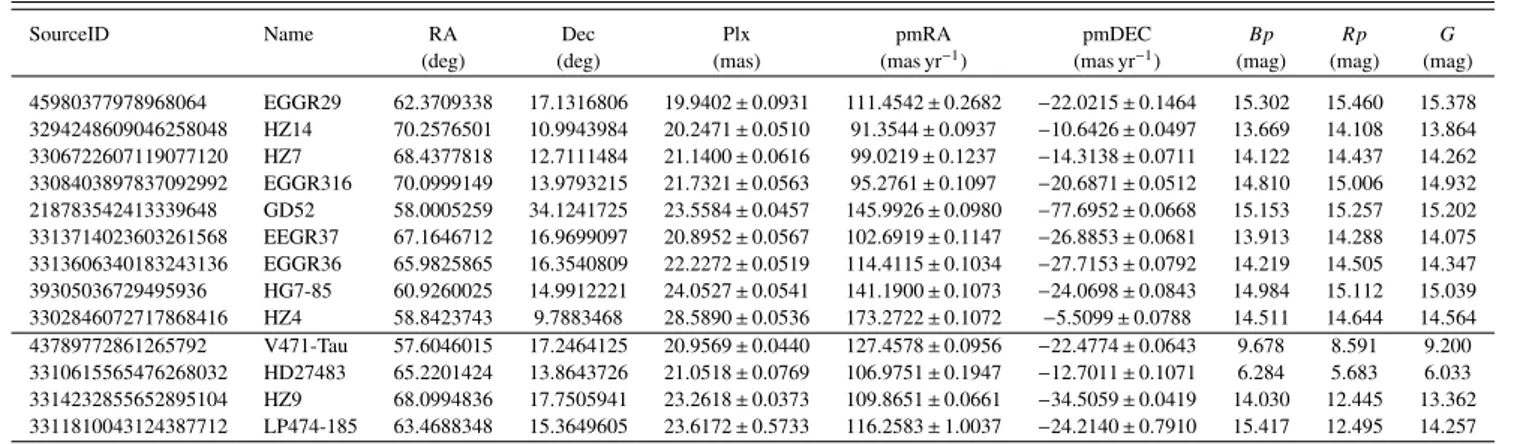
Table 5 lists all the binary and single WDs belonging to the Hyades. Of the nine single stars in Table5, we considered only eight with a pure hydrogen atmosphere (DA spectral class) to determine the cluster age. The other one, EGGR 316, was excluded because it is a DBA with mixed H/He atmosphere (Bergeron et al. 2011). In Fig. 7, we compare the position of the eight single DA WDs in the (GBP–GRP, MG) colour–absolute
magnitude diagram with the cooling tracks of DA white dwarfs with H-thick envelopes (MH/M? = 10−4) from Bergeron et al.
(2011)3. From cubic spline interpolation of the models, we
3 http://www.astro.umontreal.ca/~bergeron/
CoolingModels/, see also Tremblay et al. (2012) and references therein.
Fig. 6.Top left: parallaxes of Hyades WD candidates as a function of Gaia magnitude. Top right: vector point diagrams for Hyades WD candidates. Bottom left: (GBP− G,G − GRP) colour–colour magnitude of all candidates in our 30 pc sample. Bottom right: (GBP− GRP,GRP) colour–magnitude
magnitude for our 30 pc sample. The classical WDs fromvon Hippel(1998) are shown as black dots. The candidates fromSchilbach & Röser (2012) are highlighted with their ID number. The Hyades single and binary WDs fromGaia Collaboration(2018a) are depicted as red and blue circles, respectively.
determined the basic physical parameters of each WD: e ffec-tive temperature, surface gravity, mass and cooling age. After having verified that the effective temperatures and surface grav-ities (log g) agree with the known spectroscopic values from the literature, we used the initial-to-final mass relation (IFMR) of El-Badry et al.(2018) to derive the mass of each WD progenitor. Then, for each WD progenitor, we used the Padova evolutionary models of massive stars (Bressan et al. 2012)4with nearly solar
abundances (Z= 0.017, Y = 0.279) to compute the time needed to evolve from the pre-main-sequence to the first thermal pulse in the asymptotic giant branch.
4 http://people.sissa.it/~sbressan/CAF09_V1.2S_M36_
LT/, see alsoTang et al.(2014)
The results of our computations are summarised in Table6. The largest source of error comes from the IFMR: the uncer-tainty on the initial mass implies an unceruncer-tainty on the main-sequence evolutionary time. Compared to this uncertainty, the Gaia photometric and parallax errors are negligible for these relatively bright stars. When considering all eight single WDs in Table6, we infer an age of 640+67−49Myr for the Hyades cluster. This age agrees with the early estimate from the cool-ing age of the WD by De Gennaro et al. (2009), who quoted 648 ± 45 Myr. Those values are also consistent with the mean age of the cluster derived from isochrone fitting with con-vective overshoot (625 ± 50 Myr; Maeder & Mermilliod 1981; Mermilliod 1981) and the lithium depletion boundary method (650 ± 70 Myr;Lodieu et al. 2018;Martín et al. 2018). However,
Fig. 7.Absolute magnitude of the Hyades white dwarfs as a function of the GBP− GRPcolour. The error bars, smaller than the symbols, are
always lower than 0.011 and 0.008 in absolute magnitude and GBP−GRP
colour respectively. The WD cooling tracks ofBergeron et al.(2011) for various masses are shown in light blue (see text for more details).
it is on the lower side of older ages determined from evolution-ary models with enhanced convective overshooting (upper limit of 1.2 Gyr; Mazzei & Pigatto 1988) and models with rotation (750 ± 100 Myr;Brandt & Huang 2015).
After the first submission of this paper, a new article by Salaris & Bedin (2018) makes use of the same sample of sin-gle DA WDs. Using a recent estimate of the cluster age from the main-sequence turn off, these authors derived the WD progenitor masses and compared the Hyades IFMR with the global IFMR. It is basically the opposite with respect to what we have done.
7. The luminosity and mass functions
In this section, we present the luminosity function as a function of radius from the cluster centre and derive the associated mass function including all stellar and sub-stellar members.
7.1. Luminosity function
We derive the system luminosity function from our sample of Hyades candidates identified using Gaia DR2 data. This sample contains a total of 85, 381, 568, and 710 objects in 3.1, 9, 18, and 30 pc from the cluster centre, respectively. We did not attempt to correct the system luminosity function for binaries and post-pone this analysis to later Gaia releases where astrometric parameters of multiple systems will be incorporated. The impact of binaries is not expected to be negligible as 20–40% of can-didates are predicted to be in multiple systems (Duchêne et al. 2013; Gunn et al. 1988; Reid & Mahoney 2000; Reino et al. 2018; Röser et al. 2011). The multiplicity varies as a function of mass, with high-mass stars being more likely in multiple sys-tems. However, the precise impact on the luminosity function is difficult to estimate because multiple systems should be investi-gated over a wide range of separation and mass ratios.
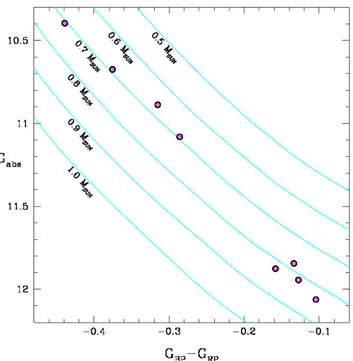
In Fig.8, we display the system luminosity function, that is the number of objects per absolute magnitude bins (MG), with
bin width of one mag scaled to a volume of one cubic parsec for four different annuli from the cluster centre. We choose to display the regions within 3.1 pc (core radius), 3.1–9 pc (tidal radius), 9–18 pc (halo), and 18–30 pc. We do not apply any correction to the luminosity function or plot the error bars. How-ever, we note that two of the ten brightest known pre-Gaia members are not recovered in our 30 pc sample for the reasons discussed in Sect.5.2.4. The LF is also affected to some level by incompleteness at the faint end of Gaia because a member at 10 pc will be about one magnitude fainter than a member at the centre of the cluster. However, the Gaia sample is mainly com-plete down to the hydrogen-burning limit with an uncertainty of ±0.01 M because we showed that all brown dwarfs with lithium
are not catalogued in Gaia DR2 (Tables1–2). Models predict that a 0.072 M Hyades member has G ∼ 19.65 mag, making
it detectable up to the tidal radius. Further discussion on the incompleteness is provided in the next section (Sect.7.2). How-ever, the completeness of Gaia DR2 is a function of magnitude, position on the sky density (Sect. 3 and Fig. 3 inArenou et al. 2018). As stated in Sect.5.1 we limit our study to candidates within 30 pc because the tidal radius may be higher (for exam-ple as we have not counted binaries, dust, etc..) and to look for objects that have been stripped off but continue to have the Hyades kinematics. Therefore, from the distribution of sources that passed the membership criteria, we counted the numbers of objects in three annuli (40–50 pc, 50–60 pc, and 60–70 pc) and divided by the volume, yielding numbers of contaminants in the range 3.84−7.59 × 10⁻⁴per cubic parsec. Therefore, we predict
0.15–0.25, 1.0–2.2, 8.2–16.3, and 34.0–67.3 contaminants among the 85, 381, 568, and 710 sources in the 3.1, 3.1–9, 9–18, and 18–30 pc volumes, respectively
We should add ten brown dwarfs to our luminosity function but we do not have Gaia magnitudes because they are too faint to be detected (Table2; Sect.4). We estimated their magnitudes with the equation in Sect.4.1(Smart et al. 2017b). We find 1, 1, 4, 1, and 1 objects in the 16–17, 18–19, 19–20, 21–22, and 23–24 magnitude bins, respectively (red lines in Fig.8), scaled to the volume and distance from the cluster centre. We note that there is only one brown dwarf in the 18–30 pc annulus, all the others being within 14 pc.
Among the WDs, we have two in the 3.1 pc core annu-lus (EGGR 36, EGGR 37) and another nine within the tidal radius (EGGR 29, HZ 14, LP 474-185, HG7-85, EGGR 316, HZ 7, HD 27483), including two known binaries V 471 Tau and HZ 9. Two other WDs (HZ 4 and GD 52) lie between 14.9 and 16.0 pc. The remaining two WDs (GD 77 and G 74-15B) are 31–32 pc away from the cluster centre, which we reject as mem-bers of the cluster. None of the WDs have Gaia radial velocity.
We observe distinct shapes of the Hyades luminosity func-tion in different regions of the cluster, from the core to the tidal radius, and the halo as previously reported by studies using Hipparcos and ground-based data. In the central 3.1 pc, we observe two peaks at MG= 5.0–6.0 mag and 11–12 mag,
corre-sponding to solar-type stars (0.9 ± 0.1 M ) and M2–M4 dwarfs
(∼0.2–0.3 M ) before it decreases sharply with only one brown
dwarf below MG=16 mag (HyaL5). The luminosity function
increases smoothly until it peaks at MG ∼ 12 mag within the
tidal radius and the brown dwarf bins are populated. Therefore, the lack of brown dwarfs in the core of the Hyades is likely of physical grounds because Gaia is most likely complete down to 0.072 M in magnitude space (with the biases described above).
Fig. 8. Luminosity functions for radius intervals of 0–3.1 pc, 3.1–9 pc, 9–18 pc, and 18–30 pc from the cluster centre scaled to a volume of one cubic parsec. We added the brown dwarfs undetected in GaiaDR2 in red.
Fig. 9. Mass functions for annuli of 0– 3.1 pc, 3.1–9 pc, 9–18 pc, and 18–30 pc from the cluster centre scaled to a vol-ume of one cubic parsec and mass bins of 0.1 dex in logarithmic units assuming an age of 650 Myr. Overplotted with a thick red line is the lognormal form of the field mass function (Chabrier 2003) nor-malised to one and multiplied by the most populated bin in the volume considered.
MG ∼ 12 mag (M2–M4) beyond the core radius. Assuming
magnitude as a proxy for mass we find the relative number per cubic parsec of high-mass stars (≥1.4 M ) in the 3.1–9 pc
annu-lus is 14.75 times lower than in the core. The number of high-mass stars decreases by a factor of ∼30 and ∼10 in the next two annuli, while the number of solar-type stars (0.7–1.3 M ) and
low-mass stars (0.1–0.5 M ) decrease by a factor of 14 (5.4) and
10.6 (6.3), respectively. The relative density of low-mass stars to high-mass stars is 2.6 in the core radius but increases to 9.2 and 30.2 in the tidal radius and halo, respectively. The luminosity function increases steadily in the 9–18 pc region until it reaches a broader peak at MG= 13 mag, one magnitude fainter than at
closer radii, and remains so in the halo.
7.2. Mass function
To convert magnitudes into masses, we need a mass-luminosity relation over a wide mass range, from A-type stars down to
the sub-stellar regime. To derive the most reliable present-day mass function, we would require eclipsing binaries with accu-rate masses and radii at the age of the Hyades. This informa-tion is not available despite recent advances thanks to Kepler/K2 which identified transiting planets orbiting members of the Hyades (Ciardi et al. 2018; David et al. 2016;Livingston et al. 2018; Mann et al. 2016, 2018). We selected both Hyades planet-host stars (EPIC 247589423 and EPIC 210490365) as kinematic candidates with distances from the cluster centre of 12.96 pc and 4.45 pc of the cluster, respectively. We remark that EPIC 247589423 lies beyond the tidal radius of the ter but has a radial velocity from Gaia consistent with the clus-ter. Since we do not have an empirical calibration, we adopt a model-dependent mass-magnitude relation and note that all the results in this section follow from that. We considered two types of models at an age of 650 Myr to convert observables into masses: the Padova isochrones (PARSEC v1.2S + COL-IBRI PR16;Bressan et al. 2012;Marigo et al. 2013,2008,2017;
Rosenfield et al. 2016)5 and the BT-Settl models (Allard et al. 2012; Baraffe et al. 2015)6. We also produced combined
mod-els for ages of 600 Myr and 700 Myr.
We compared the masses predicted by the BT-Settl isochrones to the dynamical masses of field late-M and L dwarfs (Dupuy & Liu 2017). We should bear in mind the difference in age between Hyades members (650 ± 100 Myr) and field dwarfs (>1 Gyr). Based on the four candidates ofHogan et al. (2008) with optical spectral types recovered in our Gaia sample (Hya01, Hya03, Hya06, and Hya08), we would infer masses of 0.098 ± 0.011 and 0.085 ± 0.010 M for M8–M8.5 and M9–L0.5
dwarfs (Dupuy & Liu 2017) while the models predict masses of 0.077 and 0.065–0.068 M . Considering the difference in
ages and the range in dynamical masses, the agreement between observed and model-dependent masses is acceptable to proceed with the derivation of the mass function bearing in mind these caveats.
We opted to merge both models to cover the full range of masses. We kept the Padova and BT-Settl models above and below 1.4 M (MG∼ 3.1 mag), respectively. We find small
dif-ferences between both models at 1.4 M : log(L/L )= 0.62 vs
0.60 dex in luminosities, 6918 K vs 6724 K in effective temper-atures, and log g= 4.28 vs 4.25 dex in gravities. We have now a mass-luminosity relation from 2.6 M down to 0.05 M
equiv-alent to absolute G magnitudes of −2.78 mag and 19.03 mag, respectively. The full magnitude range of apparent Gaia magni-tudes (3–21 mag) is therefore covered as are brown dwarfs in the Hyades.
We plot the (system) mass function in Fig.9counting the num-ber of objects per volume cubic parsec and per bins of 0.1 dex in logarithmic units of mass, assuming an age of 650 Myr. We obtained the masses for the brown dwarfs in a different manner because we have detection of lithium in absorption at 6707.8 Å for some of them, placing their mass in the 0.05–0.06 M range
(Baraffe et al. 2015; Basri et al. 1996; Rebolo et al. 1992). We place Hya02 (M8.5) and Hya11 (L3.0) in the 0.06–0.07 M
mass bin because they have depleted their lithium, while the T dwarfs fromBouvier et al.(2008) have most likely masses below 0.05 M . Therefore, we place two, seven, and two sub-stellar
members in the 0.06–0.07, 0.05–0.06, and 0.04–0.05 M
inter-vals, respectively, in addition to all the Gaia members.
We plot the Hyades (system) mass function for four annuli (3.1, 3.1–9, 9–18, and 18–30 pc) in Fig.9. We overplot the log-normal form of the field mass function (red line) fromChabrier (2003), normalised to the value of the most populated bin of objects in the volume into consideration. We observe that the Hyades mass function is not reproduced by the field mass func-tion in any of the regions. In the core of the cluster, we observe an excess of high-mass stars (≥1.4 M ) with respect to the field while
low-mass stars are under-represented. The mass function within the tidal radius is relatively well fit by the log-normal form of the field IMF, except for stars below 0.1 M and brown dwarfs. In the
halo, the high-mass stars are clearly under-represented because their number is scarce while low-mass stars start to dominate. The lack of brown dwarfs remain evident in all regions, which we attribute to the mass segregation and the incompleteness of previous ground-based surveys in the sub-stellar regime due to a combination of a lack of sensitivity and limited spatial coverage (Bouvier et al. 2008;Pérez-Garrido et al. 2017,2018).
As stated above, the system mass function is not corrected for binaries, which we cannot do at this stage. The upcoming
5 http://stev.oapd.inaf.it/cgi-bin/cmd 6 https://phoenix.ens-lyon.fr/Grids/BT-Settl/
CIFIST2011_2015/ISOCHRONES/
release of Gaia will contribute to the correction but a wider spec-trum of physical separations must be probed before a “resolved” mass function can be derived. To estimate the impact of bina-ries on the shape of the mass function, we have compared the system and resolved mass functions of the field (Fig. 1 and Eq. (17)+(18) inChabrier 2003). Assuming that the multiplicity of Hyades members is comparable to the binary fractions in the solar neighbourhood, we should apply the multiplicative factors of 0.96, 1.0, 1.14, 2.17, and 3.33 to the numbers of members at masses of 2.0, 1.0, 0.5, 0.3, and 0.1 M , respectively.
We infer a total mass of 61 M in 85 systems within a radius
of 3.1 pc from the cluster centre assuming an age of 650 Myr and the models described earlier. The total mass is about 218, 292, and 343 M in 381, 568, and 710 systems within 9, 18,
and 30 pc from the cluster centre, respectively. We find a slightly larger number of systems within the central 9 pc thanRöser et al. (2011) with a smaller total mass (381 vs 364 systems and 218 M
vs 275 M ). We find another ∼70 M in the halo (9–18 pc),
which is two-thirds of the one reported by Röser et al.(2011) but a similar additional mass budget in the 18–30 pc annulus (∼50 M vs 60 M ). The most likely explanation is that the
high astrometric precision of the Gaia data has cleaned up the contaminants in the halo of the cluster but possibly not fully beyond where we still expect significant contamination (lower right panel in Fig. 8). We caution that those total mass esti-mates do not consider multiple systems. Assuming a multiplic-ity fraction of 20–40% and an average mass of the secondary equal to two-thirds of the primary, the correction factor to apply to the aforementioned numbers would be of order of 16–27%, which is not negligible at all. We inferred a tidal radius of 8.3 pc from Gaia DR2 alone, agree with Röser et al. (2011). Accounting for 20–40% binaries among Hyades members, the tidal radius of the cluster may increase to 10.5–13.5 pc depend-ing on the binary fraction and mass ratios. We also investigated the impact of the uncertainty on the age of the Hyades by calcu-lating the total mass in each distance annulus for isochrones of 600 Myr and 700 Myr, corresponding to about 10% uncertainty. At those ages, the isochrones are very similar over a wide range of masses, except above 1.8 M and below the hydrogen-burning
limit. Both mass intervals contain a limited number of members. The impact is less than 1% on the total mass, therefore minimal, and much lower than the effect of multiplicity discussed above.
8. Discussion: a 3D view of the Hyades
8.1. Distribution in space
With the availability of accurate astrometry from Gaia DR2, we are now able to draw a 3D map in galactic coordinates for all bona-fide members identified from their kinematics. We depict the distribution of all 1764 member candidates in Fig. 10 but limited the plots to the central regions where we overplotted four circles in cyan representing the core (3.1 pc), tidal (9 pc), halo (18 pc), and 30 pc radius. We added in red in Fig.10the galactic coordinates of ten brown dwarfs discussed earlier for which we have ground-based parallaxes, except in the case of the two mid-L candidates identified by Schneider et al.(2017) where we included their photometric distances for completeness. These are the only two sources without parallaxes in our sample in addition to Hya04 which has no parallax in Gaia DR2.
The (0,0,0) in galactic coordinates represent the position of the Sun and (1,0,0) is a unit vector pointing to the galactic cen-tre. We observe that the cluster shows a centrally-concentrated group of stars with two tails in the X and Y directions (Fig.10).
Fig. 10.3D coordinates in space (bcin pc) of the 1764 Hyades stellar (black) and ten sub-stellar (red) members with four different annuli from the
cluster centre drawn in cyan: 3.1, 9, 18, and 30 pc. White dwarfs are highlighted in green.
Fig. 11.3D velocities of 192 Hyades members within 30 pc with Gaia RVs. One object lies outside the limits of the (vx,vy) plot with vx= −17.26 pc
(the outlier at the top-right on the right-hand side diagram).
The extension of the cluster in Y,Z is consistent with the exten-sion found in the Hipparcos data (Perryman et al. 1998). We refer to that work for a detailed interpretation of the possible causes for the spatial distribution of cluster members. The elon-gation of the cluster in the X direction is increasing dramati-cally from 3.1 to 9 pc from the cluster centre with the popu-lation in the tail to the Galactic anti-centre increasing quickly between 3.1, 9, and 18 pc. The overall extension of about 80 pc, from −20 pc to −100 pc is also consistent with the results of Hip-parcos (Perryman et al. 1998) but is now homogeneously dis-tributed with the presence of a tail towards negative values of bx. We note that the cluster appears also elongated in the Y
direction beyond 18 pc, in the region of the halo of the cluster where we might identify a mix of members of the cluster and the Hyades moving group (Boss 1908;Eggen 1958;Famaey et al. 2007;Zuckerman & Song 2004).
In Fig.11, we plot the 3D distribution of galactic velocities (bcin km s−1) of the 192 Hyades members at distances less than
30 pc from the cluster centre and Gaia radial velocities (G= 5.6– 13.6 mag). The size of the sample corresponds approximately to the size of the Hipparcos sample but with more accurate radial velocities. We observe an extension along the X-axis with a small sub-group of objects towards negative vx. We confirm the
con-clusions drawn inPerryman et al.(1998).
8.2. Mass segregation
The differences seen in the luminosity function in different annuli from the cluster centre clearly indicate a mass segregation
in the Hyades (Fig.8), in fact extensively discussed in the litera-ture (e.g.Bouvier et al. 2008;Perryman et al. 1998;Röser et al. 2011) and reproduced through numerical simulations by the loss of the lowest mass members over a timescale of a few 100 Myr (de La Fuente Marcos 1995;Kroupa 1995;Terlevich 1987).
In Fig.12we display the distance from the centre of the clus-ter as a function of the Gaia magnitude G for the 3.1, 9, 18, and 30 pc radii from the cluster centre. We overplot the Hyades brown dwarfs in red. In these diagrams, as we can assume the objects are of the similar age, composition and distance then magnitude will act as a proxy for mass. We can clearly see the equal number of stars at different masses within the central ∼3 pc whereas low-mass stars become more numerous beyond 3 pc. At distances larger than 6–7 pc, the number of high-mass stars become negligible (Fig.12). We observe a possible bias of brown dwarf members on the side towards us, suggesting that we are more complete nearby than the other side, which can be a consequence of the depth of photometric surveys. These plots represent another proof of the mass segregation present in the Hyades. We observe that one of the known brown dwarfs lies at 2.6 pc from the cluster (red dots in Fig. 10). Most of them lie within the tidal radius and the furthest at about 20 pc. Their distribution seems to match the distribution of M-type members. To illustrate the effect of segregation in a more quantitative manner, we compute the ratio R of stars to brown dwarfs as defined byAndersen et al.(2008): the sum of all objects in the interval 0.08–1.0 M is divided by the number of brown dwarfs
(0.03–0.08 M ). We emphasise that the bin of brown dwarfs