University of Messina
Research Doctorate Course XXXI Cycle
Medical and Surgical Biotechnologies
Coordinator: Prof. Giovanni RAIMONDO
MYO-INOSITOL SUPPLEMENTATION TO
PREVENT GESTATIONAL DIABETES IN
OVERWEIGHT NON-OBESE WOMEN:
BIOELECTRICAL IMPEDANCE ANALYSIS,
METABOLIC ASPECTS, OBSTETRIC AND
NEONATAL OUTCOMES
PhD thesis of:
Salvatore Giovanni VITALE M.D.
Tutor:
Index
Introduction ... ..1
1. Gestational diabetes mellitus (GDM) ... ..4
1.1 Definition and classification ... 4
1.2 Pathophysiology of GDM ... 6
1.3 Risk factors for GDM ... 10
1.4 Clinical features and complications ... 12
1.5 Diagnosis and screening ... 14
1.6 Principles of therapy ... 18
2. Myo-inositol: from cellular metabolism to clinical implications ... 24
2.1 Generality ... 24
2.2 Digestion and absorption ... 28
2.3 Biosynthesis and catabolism ... 29
2.4 Main clinical implications ... 30
2.5 Myo-inositol and gestational diabetes ... 33
3. Bioelectrical impedance analysis (BIA) ... 36
3.1 Introduction ... 36
3.2 Physical principles of BIA ... 38
3.3 BIA approaches ... 41
3.4 BIA procedures ... 45
3.5 Main clinical applications ... 48
3.6 BIA and pregnancy ... 50
4. Our clinical trial ... 53
4.2 Materials and methods ... 53
4.2.1 Patients and study design ... 53
4.2.2 Study measurements ... 55
4.2.3 Sample size calculation ... 58
4.2.4 Statistical analysis ... 58
4.3 Results ... 60
4.4 Discussion ... 69
4.5 Conclusions ... 72
Introduction
Gestational diabetes mellitus (GDM) can be defined as “any degree of glucose intolerance” with onset or “first recognition during pregnancy” [1].
The development of GDM is associated with a variety of risk factors, more specifically body weight which is among the most important ones for gestational diabetes [2]; indeed, body mass index (BMI) ranging 25.1–29.9 predisposes not only to GDM but also to several adverse outcomes in pregnancy [3,4].
Despite a general agreement on its definition, there is no universal consensus on the diagnostic criteria of GDM throughout the last 50 years. A two-step approach using a glucose challenge test (GCT) (50 g-1 h) was firstly proposed by O'Sullivan, followed by an oral glucose tolerance test (OGTT) (100 g-3 h) if the result of the GCT is greater than the cut-off considered [5]. Any amount of abnormal values higher than two during the assessment of the OGTT had been deemed diagnostic for gestational diabetes [5,6]. This approach, later modified by the National Diabetes Data Group (NDDG) [7] and Carpenter [8], was the most considered in Western countries until 8 years ago, when the International Association of Diabetes and Pregnancy Study Groups (IADPSG) Consensus Panel [9], on the basis of the HAPO study results [10], recommended new diagnostic criteria. At first, they proposed evaluating the first trimester fasting glycemia to exclude cases of pre-existing diabetes (≥126 mg/dl), and then suggested that a 75 g-2 h OGTT should be undergone by all pregnant women in their 24th-28th week of gestation, with just one value of abnormal plasma glucose being enough to diagnose GDM (fasting ≥ 92 mg/dl; 1 h ≥ 180 mg/dl and 2 h ≥ 153 mg/dl) [9].
However, the Italian Institute of Health in the Guidelines of Physiological Pregnancy (2011) advised that only pregnant women with a defined risk factor ought to take part in an
OGTT [11]. It is, in fact, highlighted that screening only patients with at least one risk factor could make the diagnosis of GDM more cost effective; the limit of this approach, based on a narrow vision of costs and benefits, is the possibility of determining a misconception with consequent under-treatment of patients with carbohydrate intolerance [11].
Therapeutic approaches to GDM include medical nutrition therapy (MNT) and weight management, physical exercise, self-monitoring of blood glucose (SMBG), and pharmacological therapy, if required [12,13].
In recent years, a vast array of studies have been conducted on the effectiveness of substances such as myo-inositol for the prevention of GDM and related complications [14,15]. Myo-inositol is an isomer of inositol, a simple carbohydrate and nutrient which has an important role for many cell functions [16]. It is naturally present in fresh fruit and vegetables, cereals, legumes and nuts, but it is also synthesized by our body, especially in the liver [17,18]. Despite its therapeutic effects have been widely demonstrated by numerous studies [16,18], it is commonly available on the market as a dietary supplement, in water-soluble powder form or capsules [15].
Recent studies by D’Anna et al. demonstrated that a diet supplementation with myo-inositol has insulin sensitizing effects and may decrease GDM occurrence in populations at risk for this disease, like obese women or women with family history for Diabetes Mellitus type 2 (T2DM) [19–22].
Maternal body composition experiences profound adaptive changes during pregnancy [23]. Fat mass (FM), fat-free-mass (FFM) and total body water (TBW) increase with different modes and their effects on pregnancy outcomes represent a very interesting field for perinatal medicine which is currently investigated in a fragmentary and non-homogeneous manner [24].
Different techniques for measuring body composition are available but one of the most used in clinical practice is bioelectrical impedance analysis (BIA). BIA is a method used to test body composition, which is simple and reproducible. It is a relatively recent technique that has found a clinical application only since the 1980s thanks to the development of portable analyzers (RJL Systems in USA/Akern Srl in Italy), which operated similarly to the electrocardiograph. Currently, the most adopted technique is based on the use of cutaneous electrodes used for ECG and positioned in two pairs (hand-foot tetrapolar technique). This technique allows measurements to be performed quickly, non-invasively, harmlessly, repeatedly and at low cost [25,26].
Although several scientific works support the use of BIA in the study of some pathologies of pregnancy such as gestational hypertension, pre-eclampsia and pregnancy hyperemesis [27–29], there are few actual data concerning the study of gestational diabetes and its correlation with body composition investigated through this well-established technique. In the light of these considerations, the main objective of this study is to evaluate the occurrence of GDM and body water distribution in overweight non-obese pregnant women, randomized to a myo-inositol oral formulation (2g myo-inositol + 200 µg folic acid) or to placebo (200 µg folic acid). The secondary one is to evaluate the effects of treatment on the metabolism of these women, as well as on obstetric and neonatal outcomes.
Chapter 1
Gestational diabetes mellitus (GDM)
1.1 Definition and classification
Gestational diabetes mellitus (GDM) is among the most frequent medical conditions in the stages of gestation and is defined as glucose intolerance first identified during pregnancy and, in many cases, resolves after delivery [2,30].
Several factors influence GDM prevalence, for instance the population tested and the diagnostic assessments being used [2,31–33]. Prevalence in Northern Europe ranges from 0.6% in Netherlands to 3.6% in Denmark while it is higher in Italy (6.3%) [31,34]. A 7% of all the pregnancies in the USA are affected by GDM [35].
Using the new International Association of Diabetes in Pregnancy Study Group (IADPSG) criteria instead of the Wolrd Health Organization (WHO) 1999 ones, GDM prevalence is 2.4 times higher and goes from 9% to 26% [32,36]. Either the diabetic mother, the fetus, neonate, the child or even the adult offspring could suffer adverse consequences associated with GDM [37].
The first classification system of diabetes in pregnancy was developed by Priscilla White in 1949 [37,38]. On the basis of age at onset, diabetes duration, metabolic, and vascular complications, White divided diabetes in pregnancy in classes from “A” (more favourable) to “F” (less favourable). Her original classification underwent multiple modifications, until 1980 [39]. In 1978, the White Classification experienced its last revision which includes the addition of GDM as a distinct separate class and the deletion of classes “E” and “G” [39,40].
An alternative classification for GDM was proposed by the American College of Obstetricians and Gynecologists (ACOG) where the presence or absence of metabolic
complications is as well noted and the utility of the White’s classification in clinical practice is essentially questioned [12,41].
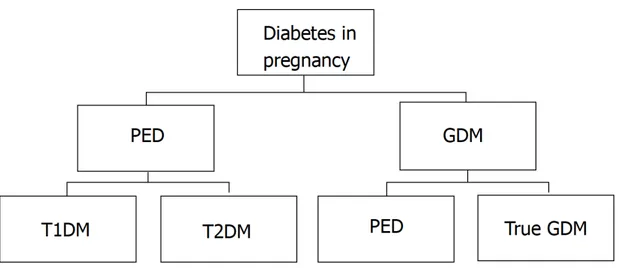
Currently, the term “diabetes in pregnancy” include all cases of hyperglycaemia observed during pregnancy comprising GDM and pre-existing diabetes (PED). Both pre-gestational T2DM and type 1 diabetes mellitus (T1DM) are included in the latter [42]. It also defines GDM as any degree of hyperglycaemia that is recognized for the first time during pregnancy. This definition of GDM should include cases of undiagnosed T2DM “overt diabetes” identified early in pregnancy and true GDM which develops later in pregnancy [10,43]. Classification of diabetes in pregnancy is shown in Figure 1.
Figure 1. Classification of diabetes in pregnancy. GDM: Gestational diabetes mellitus; PED: Pre-existing diabetes; T1DM: Type 1 diabetes mellitus; T2DM: Type 2 diabetes mellitus. Adapted from: Mirghani Dirar A, Doupis J. Gestational diabetes from A to Z. World J Diabetes 2017;8:489–511.
1.2 Pathophysiology of GDM
In humans, the balance between adequate insulin secretion and insulin sensitivity guarantees normal glucose tolerance. Insulin is able to dispose of carbohydrates thanks to the sensitivity of the glucose utilizing tissues to insulin and the secretory response of the pancreatic β-cells to the former [3].
There is a constant product insulin secretion and sensitivity in individuals with an equal degree of glucose tolerance, and this value is known as disposition index. This index reflects how insulin resistance is compensated by the the ability of the β-cell [3]. In addition to the disposition index, HOMA-IR (insulin resistance index) and HOMA-β (cell function index) can be used as reliable surrogate markers for insulin sensitivity and β-cell function, respectively, and can be calculated from fasting insulin and fasting glucose concentrations [1,3].
Pregnancy is a complex metabolic and physiological condition that allows to detect insulin resistance earlier [12,42]. Insulin resistance in pregnancy could be the result of several factors such as maternal obesity with varying degree of adipocytokine production, or an increased production of diabetogenic placental hormones. Moreover, pancreatic β-cell dysfunction can also have an important role in the pathophysiology of GDM [12]. Catalano
et al. has extensively researched the pathogenesis of GDM with the use of euglycaemic
hyperinsulinemic clamp techniques and glucose infusion. He reported that women who developed GDM are insulin resistant before pregnancy compared to non-diabetic women during pregnancy [44].
Ryan et al. underlined the role of placental hormones in the induction of insulin resistance in pregnant rats. More specifically, increasing levels of progesterone, cortisol, prolactin and human placental lactogen (hPL) play a causal role in the insulin resistance during pregnancy but their effect in human pregnancy remains to be clarified [12,45].
In particular, hPL has a significat role in triggering the changes that can lead to glucose intolerance [2]. hPL is a product of the feto-placental unit and stands as the principal diabetogenic hormone [46]. Changes in the circulating level of glucose can alter maternal levels of hPL during pregnancy; more specifically, hPL is elevated with hypoglycemia and decreased with hyperglycemia [47].
hPL presents effects considered highly anti-insulin and lipolytic [2]. Indeed, it stimulates lipolysis leading to an increase in circulating free fatty acids in order to provide a different source of energy for the mother so that glucose and amino acids can be conserved for the fetus. The increase in free fatty acid levels, in turn directly interferes with insulin-directed entry of glucose into cells. For this reason, hPL is considered as a potent antagonist to insulin action during pregnancy [46].
Another factor that is thought to be involved in the pathogenesis of GDM is β-cell dysfunction, which occurs on the setting of insulin resistance state [48].
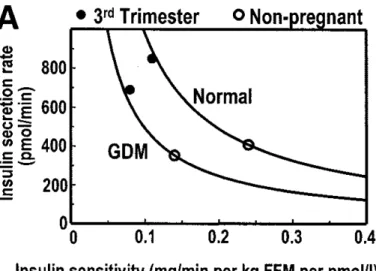
Pancreatic β-cells normally increase their insulin secretion to compensate for the insulin resistance of pregnancy (Figure 2) [49]. β-cell function presenting robust plasticity in the face of progressive insulin resistance is the indicator of common glucose regulation on pregnancy stages [49].
Figure 2. Insulin sensitivity-secretion relationships in women with GDM and normal women during the third trimester and remote from pregnancy. Adapted from: Buchanan TA. Pancreatic B-cell defects in gestational diabetes: implications for the pathogenesis and prevention of type 2 diabetes. J Clin Endocrinol Metab 2001;86:989–93.
On the contrary, the abnormal glucose tolerance is due to the fact that pancreatic β-cells output do not meet the tissues insulin needs in response to changes in insulin resistance [3,21]. Xiang et al. found that, in comparison to normal pregnant women, there was an increased resistance in Hispanic women with GDM due to the effects of insulin on glucose clearance and production. In addition, the Authors showed a reduction of pancreatic β-cell function by 67% in women with GDM compared to normal glucose tolerance controls [50]. These defects in β-cell have been attributed either to autoimmune process or enzymatic defect like glucokinase [51].
In GDM, circulating TNF-α and interleukin-6 (IL-6) displayed an inverse correlation where a role of inflammatory factors in the pathogenesis could be suggested by insulin sensitivity [52].
More specifically, TNF-α interferes with insulin receptor signaling and β-cell function and this significantly influences hyperglycaemia [53]. According to several studies about the topic, women with GDM had significantly higher levels of TNF-α compared with normal
glycaemic pregnant women [54,55]. However, other studies showed conflicting results so further investigations are needed [56,57].
IL-6 is an inflammatory marker significantly higher in women with GDM, compared to normal women, independent of adiposity [58,59]. A recent study by Hassiakos et al. revealed that IL-6 could be independently used to predict development of GDM when assessed in the first trimester of pregnancy [60].
Other cytokines such as leptin have been found elevated in GDM. Leptin is a protein hormone related to the bulk of fat stores [61]. A predictive risk model proposed that each 10 ng/ml increase of leptin levels was associated with a 20% increase risk for GDM [62]. Still, other studies reported conflicting results [63].
Finally, overweight and obesity during pregnancy are also involved in the pathogenesis of GDM [12]. Indeed, according to Chu et al., an increase in early pregnancy BMI range is associated with an increased odds ratio (OR) of developing GDM: BMI 25–30 kg/m2, OR 1.86; BMI 30–35 kg/m2, OR 3.34; and BMI ≥35 kg/m2, OR 5.77 [64].
Obesity is considered a state of chronic inflammation in which inflammatory markers are produced in excess to systemic circulation. These inflammatory markers influence alterations in post-receptor insulin signaling resulting in increased insulin resistance [65]. Obesity is associated with an alteration in adipocytokines production from both adipocytes and macrophages. These inflammatory mediators may act locally to aggravate inflammation in adipose tissue, increasing peripheral insulin resistance [12]. During pregnancy, it has been demonstrated that adipocytokines influence glucose tolerance interfering with regulation of insulin secretion and insulin receptor signaling; this mechanism explains, in part, the development of insulin resistance [12,53].
1.3 Risk factors for GDM
The development of GDM is associated with a vast array of risk factors. More specifically, two categories of subjects can be identified: high risk factors and low risk factors for GDM [2].
The first category includes pregnant women who have at least one of the following risk factors [2,66–68]:
- obesity (pregnancy weight >110% of ideal body weight or BMI > 30); - age older than 25 years;
- polycystic ovarian syndrome (PCOS);
- strong family history of diabetes (especially in first-degree relatives); - prior history of GDM or prediabetes;
- prior history of spontaneous abortions and unexplained stillbirths; - prior history of macrosomia (birth weight > 4500 g);
- current glycosuria;
- member of an ethnic group with a higher rate of type II diabetes (such as South Asians, Pima Indians);
- stages before or during early pregnancy presenting hypertension.
Further, recent studies have underlined a possible role of vitamin D deficiency in the development of GDM [69,70].
The second category includes pregnant women meeting all of the following characteristics [2,71]:
- age < 25 years;
- no family history of diabetes; - weight normal before pregnancy;
- no history of poor obstetrical outcome;
- member of an ethnic group with a low prevalence of GDM.
1.4 Clinical features and complications
GDM is associated to adverse effects involving both the mother and the fetus. However, the major intrapartum risks are associated with fetus and are collectively known as diabetic fetopathy [72,73].
Macrosomia is considered the commonest complication associated with GDM and is related to the growth-promoting activity of fetal insulin [72,73].
It is regularly defined as a birth weight above the 90th percentile for gestational age or greater than 4500 gr. Macrosomia is presented in 15-45% of cases in diabetic women during pregnancy, with a 3-fold increase compared to normoglycemic controls [2,74]. The excessive growth is disproportional and it is cause of large amounts of subcutaneous fat and broad shoulders with a consequent risk of shoulder dystocia at delivery [73].
Respiratory distress syndrome and other problems of prematurity are other serious risks in infants with diabetic mothers and can lead to infant death [73]. Other possible complications include fetal hypoglycemia immediately following the delivery (with the newborn still being hyperinsulinemic while there is a disruption in the glucose input of the mother), hypocalcemia, hyperbilirubinemia, and plethora [31,71,73].
GDM is also associated to complications for the mother. Hypertensive disorders are one of the most frequent complications for diabetic pregnant women. Three categories comprehend the classification of hypertensive disorders throughout pregnancy: chronic hypertension, preeclampsia and gestational hypertension [12,75].
Preeclampsia occurs in approximately 12% of diabetic women compared to 8% of the nondiabetic population [2]. The risk of preeclampsia is also related to maternal age and the duration of pre-existing diabetes [76].
In the long-term, hypertensive disorders increase the risk of developing T2DM, hypertension, metabolic syndrome and cardiovascular diseases [12].
Gestational diabetes is not generally an indication for cesarean section but its complications might (e.g. shoulder dystocia). Since cesarean delivery is a major surgical procedure, it is associated to the risk of complications such as infection, bleeding, thrombosis and wound dehiscence [12,13]. The HAPO study showed that 16.0% of the participants had a primary caesarean delivery and 7.7% had a repeated caesarean delivery and both were associated to increased post OGTT maternal glucose and fasting glucose levels [10,12].
The risk of progression to diabetes within 5 years of the diagnosis of GDM is associated to gestational age at diagnosis, level of glycemia at diagnosis and at the first postpartum assessment, impairment of β-cell function, obesity, and further pregnancy [2,77].
From a psychological point of view, it has been shown that a diagnosis of GDM may increase woman’s anxiety, result in poorer health perceptions and a less positive pregnancy experience when compared with non-diabetic women [78]. Pregnancy is thoughtrouly controlled in women with GDM, with an adaptation process to the diagnosis following soon after; they are left worrying about possible negative outcomes of the diagnosis for future health and the burden of being a responsible mother as their duty [78,79].
Finally, it has been widely demonstrated that intrauterine exposure to maternal hyperglycaemia is associated with impaired glucose tolerance in 20% of offspring aged 5– 9 years old and 10–16 years old [80,81]. According to the studies by Clausen et al., intrauterine hyperglycaemia might be a contributor to the pathogenesis of overweight and the metabolic syndrome, also having a role in the pathogenesis of T2D/pre-diabetes in adult offspring [82,83].
1.5 Diagnosis and screening
Until now, screening and diagnosis of GDM are characterized by the lack of uniform international criteria. There are certainly no clear indications concerning universal versus selective screening, the optimal time for screening, appropriate tests and cutoff values, and if two steps ought to be used when testing or just one [30].
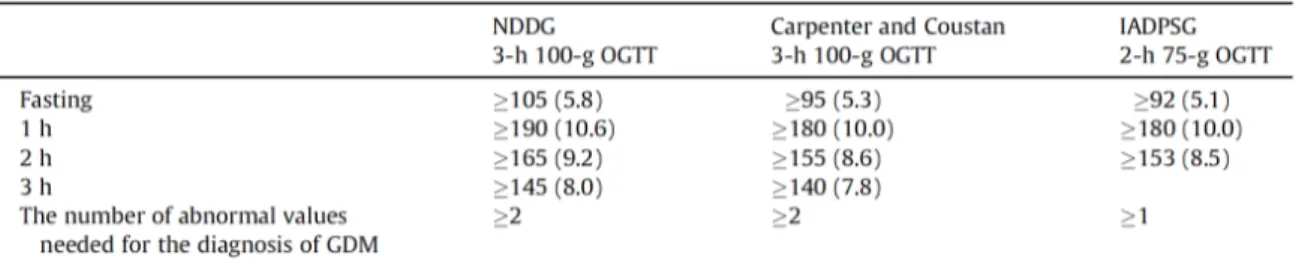
An initial approach for the diagnosis of GDM was established by O’Sullivan et al. and was obtained from a study including 752 pregnant women who screened for GDM using 3-h 100 g OGTT [5]. These criteria identified women at a high risk of developing diabetes after pregnancy but not pregnancies with an increased risk of adverse perinatal outcomes [1]. According to O’Sullivan’s criteria, rounding the mean plus two standard deviations to the nearest 5 mg/dL was the base to estimate the cut-off values for GDM diagnosis. These two cut-off values are required to make the diagnosis [5,6,12].
Starting from the results of the Hyperglycemia and Adverse Pregnancy Outcome (HAPO) study that show a significant relationship between maternal hyperglycemia and the risk of an adverse perinatal outcome, independent of other risk factors [10], the International Association of Diabetes and Pregnancy Study Groups (IADPSG) recommended screening for overt diabetes in the first stages of pregnancy as well as a universal screening with the 2-h 75-g OGTT during a gestation period between the 24th and the 28th week [9]. Furthermore, one abnormal value is enough for the diagnosis of GDM. Therefore, these criteria are more stringent and become the first diagnostic criteria for GDM based on perinatal outcome.
The IADPSG criteria have been adopted by various expert groups including the American Diabetes Association (ADA) and the Endocrine Society [84,85]. Also, the Italian Study Group on Diabetes in Pregnancy accepted these criteria and applied them in most Italian centers with the agreement of the Italian Association of Diabetologists (AMD) and the
Italian Diabetes Society (SID) [3,86]. Nonetheless, it took only 18 months to re-consider this position when the Italian Institute of Health in the Guidelines of Physiological Pregnancy suggested that only pregnant women with a defined risk factor should undergo an OGTT. It is, in fact, highlighted that screening only patients with at least one risk factor could make the diagnosis of GDM more cost effective; the limit of this approach, based on a narrow vision of costs and benefits, is the possibility of determining a misconception with consequent under-treatment of patients with GDM [3,11]. Controversy over screening for GDM as recommended by the IADPSG largely remains, since this will lead to a considerable increment in the amount of women diagnosed and treated as GDM, in most populations [30,32,87].
An overview of the different diagnostic criteria for GDM is shown in Table 1.
Table 1. An overview of the different diagnostic criteria for GDM. Adapted from: Benhalima K, Devlieger R, Van Assche A. Screening and management of gestational diabetes. Best Pract Res Clin Obstet Gynaecol 2015;29:339–49.
Also the choice of the optimal screening strategy for identification of women with GDM is quite controversial. More specifically, it has not yet been clearly established whether the screening for GDM should be performed in all pregnant women or only in women at high risk of developing T2DM [88].
In Italy, for many years, a two-step procedure was adopted for the screening of GDM. This approach included first a risk factors-based evaluation followed by a diagnostic 100-g OGTT [3].
Once IADPSG Panel recommendations were accepted in our country, the Italian National Health Service underlined some critical issues and, in particular, the higher rate of GDM, as women initially diagnosed as non diabetic are now identified as being affected by GDM, according to new criteria [86].
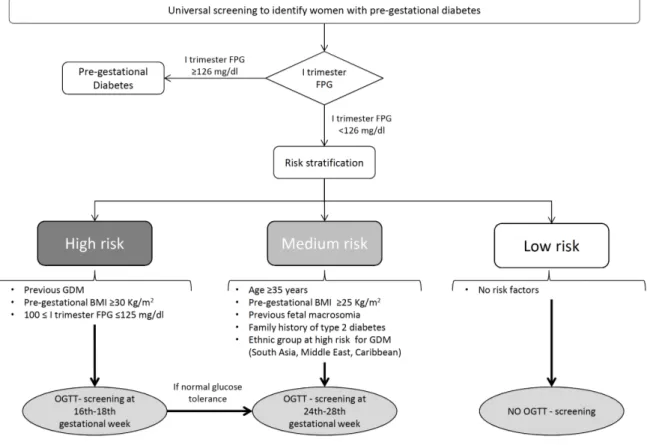
In order to solve these disagreements, a national panel of experts was set up and in 2011 the ‘‘Italian guidelines on physiological pregnancy’’ were introduced. These guidelines introduce a selective screening for GDM based on risk factors after the exclusion of overt diabetes and recommend early screening for high risk women [11].
Specially on the basis of a risk stratification, high risk women should be screened with a 75-g OGTT between 16th-18th gestational and then at 24th-28th week in case of normal
glucose tolerance; women with medium risk ought to be screened only between the 24th -28th week, instead [11].
Risk stratification and screening approach according to the Italian guidelines are shown in Figure 3.
Figure 3. Italian National Health System guidelines for selective screening for gestational diabetes (GDM) based on risk factors. Adapted from: Bianchi C, de Gennaro G, Romano M, Battini L, Aragona M, Corfini M, et al. Italian national guidelines for the screening of gestational diabetes: Time for a critical appraisal? Nutr Metab Cardiovasc Dis. 2017;27(8):717-722.
1.6 Principles of therapy
Management of GDM needs a multidisciplinary approach in order to provide high-quality care. The team should include diabetologist, gynecologist, diabetes specialist nurse, dietitian, midwife and neonatologist [89].
The main objective of an effective treatment of GDM is to decrease adverse pregnancy outcome [31].
Studies by Crowther et al. [90] and Landon et al. [43] showed improvements in perinatal results when mild glucose intolerance was treated in women during pregnancy, especially regarding large-for-gestational-age (LGA) and preeclampsia.
A recent meta-analysis by Hartling et al. confirms that treatment of GDM is associated to less preeclampsia, shoulder dystocia, and macrosomia [91]. However, it has not been demonstrated a significant effect on neonatal hypoglycemia or future poor metabolic outcomes [91].
Management of pregnant women with GDM should consist of both a non-pharmacological approach (medical nutrition therapy and weight management, physical exercise, self-monitoring of blood glucose, dietary supplementation) and a pharmacological one, if required [12,13].
1.6.1 Medical nutrition therapy (MNT)
A well-adjusted diet is the initial step of the management of hyperglycemia in women with GDM and in some cases may avoid the use of insulin or oral hypoglycemic agents. Providing an adequate nutrition to the mother and fetus, as well as enough calories for maternal weight gain, maintaining normoglycemia and preventing ketosis are the principal objectives of MNT [2,71,73].
Patients should be supervised by a trained professional (a registered dietitian if one is available) or by an individual with knowledge and expertise in the field. Nutritional therapy is individualized according to the woman’s weight and height and takes into account the nutritional requirements of pregnancy [2,12,73].
Monitoring weight changes is important to ensure adequacy of dietary therapy and to maintain a weight gain within the recommended rates [12].
According to the Institute of Medicine (IOM) revised guidelines for weight gain during pregnancy, it is recommended a 30-33% calorie restriction for obese women (BMI>30 kg/m2), a minimum intake of 1600-1800 kcal/day, and a limitation of the carbohydrate intake to 35-45% of the total number of calories [92]. The advised amount of weight gain depends on the pre-pregnancy BMI. 12.7-18 kg for underweight women (BMI < 18.5 kg/m2), 11.3-15.8 kg for healthy ones (BMI 18.5-24.9 kg/m2), 6.8-11.3 kg for those overweight (BMI 25.0-29.9 kg/m2), and 5-9.1 kg for the obese (BMI ≥ 30.0 kg/m2) are among the weight gain values recommended by the IOM [92].
1.6.2 Physical exercise
Physical activity may be associated to MNT to control blood glucose [72]. It has been demonstated that physical exercise might improve fasting and postprandial glucose level as well as insulin sensitivity, avoiding the use of insulin in some women with GDM [2,12,72]. Moreover, several studies have shown an association between exercise and a reduction of the risk of preeclampsia in pregnant women [93].
ADA recommends a continuing moderate exercise for women without medical or obstetrical contraindications [71].
1.6.3 Pharmacological therapy
Pharmacotherapy is needed when lifestyle interventions and non pharmacological treatments do not allow to maintain an adequate glycemic control during pregnancy [12,30].
Insulin has long been the first choice for the pharmacological treatment of women with GDM. About 15% of women with GDM start an insulin therapy because target glucose levels are exceeded despite life style modification [2].
In addition to glucose values, fetal ultrasonic parameters, such as the fetal abdominal circumference, can be also used as indicators for the need to initiate insulin (or medical) therapy. More specifically, an abdominal circumference above the 70th percentile usually
suggests the opportunity to start an insulin therapy to be added to the dietary plan [12,37]. Recent studies have underlined that ultrasound-guided management is associated to a significant reduction of LGA and fetal macrosomia, and reduces the need for insulin treatment when fetal growth is normal [94].
Types of insulin used during pregnancy include human insulin both short-acting and NPH-insulin and rapid-acting analogues (lispro and aspart). Use of long-acting NPH-insulin analogues is not extensively investigated during pregnancy [95].
The dose depends on body weight and is usually 0.7-1.0 units/kg, equally divided between NPH-insulin and prandial-insulin [95]. Dosage is adjusted to mantain glycemic values within the reference interval for pregnant women and to avoid the risk of hypoglycaemia [12].
A theoretical option in the treatment of GDM is the use of oral hypoglycemic agents (OHAs) such as glyburide and metformin. In many countries, these drugs are considered as a good alternative for the treatment of GDM because they are easy to administer, non-invasive, cheaper and have better patient acceptability [72].
However, in Italy, the use of OHAs is generally contraindicated during pregnancy, mainly due to the possible risk of over fetal anomalies, and inducing fetal and neonatal hypoglycemia [37,96]. Indeed, although several studies suggest the possibility of using OHAs in pregnancy, the evidence available today and the official indications at national level do not allow to recommend their use, which should be limited only to authorized clinical trials [11].
1.6.4 Dietary supplements
In recent years, several studies have been conducted to investigate efficacy and effectiveness of dietary supplements in reducing the risk of GDM.
Cardiovascular diseases, including diabetes and obesity, are prevented by the increasing use of Omega-3 polyunsaturated fatty acids (PUFAs), which have been associated with reduced insulin resistance [97]. However, the DOMInO trial underlined that fish-oil supplementation in pregnancy does not reduce the risk of gestational diabetes or preeclampsia and that its real efficacy in reducing the risk of perinatal death and neonatal seizures requires further investigation [98].
The use of probiotics is also recommended in the literature to prevent GDM. The human gastrointestinal tract is colonized by a set of microorganisms known as the gut microbiota. It undergoes significant changes during pregnancy and is associated with inflammation and a raise in the scale of fat mass, blood glucose, and insulin resistance in the mother as well as circulating pro-inflammatory cytokines [99].
The study by Taylor et al. shows that probiotic supplementation for 6-8 weeks is associated to a significant reduction in insulin resistance in pregnant women diagnosed with GDM [99]. Another reasearch by Luoto et al. confirms that probiotic supplementation (with Lactobacillus rhamnosus GG and Bifidobacterium lactis Bb12) is associated with
both reduced insulin resistance in the antenatal and postpartum periods, as well as a reduction in GDM incidence [100].
However, further studies are needed to determine the safety, optimal dose and ideal bacterial composition of probiotics for their use in GDM patients [99].
Vitamin D is involved in glucose homeostasis and facilitates the secretion and action of insulin. For this reason, it has been hypothesized that a vitamin D deficiency could be associated to an increase risk to develop GDM [101].
According to a study by Asemi et al., vitamin D supplementation in pregnant women with GDM has positive effects on glycemia and cholesterol concentrations but do not affect inflammation and oxidative stress [102]. Nevertheless, as underlined in a recent review by Joergensen et al., carrying out good-quality randomized controlled trials becomes essential in order to ascertain whether vitamin D supplementation reduces the risk of GDM or enhances glucose tolerance in diabetic women [101].
Finally, a growing amount of studies has investigated the effects of dietary myo-inositol (Myo-Ins) supplementation on the incidence of GDM.
Inositol belongs to vitamin B complex, and its main source comes from the diet; it has nine possible stereoisomers, and myo-inositol is the most common one [16]. Myo-inositol is known for its insulin sensitizing effects and lead to a decrease in blood glucose levels [103,104].
D’Anna et al. evaluated the effects of myo-inositol supplementation in reducing the GDM diagnosis in women at high risk for a positive family history of type 2 diabetes mellitus. The results underline that myo-inositol supplementation may reduce GDM incidence and the delivery of macrosomic fetuses [19]. In addition, the Authors confirm that myo-inositol improves insulin resistance in patients with gestational diabetes [21].
Another study by Matarelli et al. evaluated the effects of myo-inositol supplementation in women with elevated fasting glucose since the first/early second trimester of pregnancy. The Authors found that the use during pregnancy of myo-inositol supplements in women at high risk of this disorder decreases the incidence of GDM and this reduction is associated to improved pregnancy outcomes [105].
In conclusion, according to these data and with many other evidences present in the literature about the topic, the use of myo-inositol could have positive effects on the glucose/insulin homeostasis in pregnancy, and it is associated with a reduction in GDM onset. Consequently, myo-inositol supplementation may have an important role in the prevention of GDM, in different categories of women at risk [106].
Chapter 2
Myo-inositol: from cellular metabolism to clinical implications
2.1 Generality
The term inositol indicates a group of cyclic organic compounds belonging to the sugar
family (molecular formula C6H12O6). It is also known as cyclohexane-1,2,3,4,5,6-hexol, is
widely distributed in nature and it is represented by nine stereoisomeric forms depending
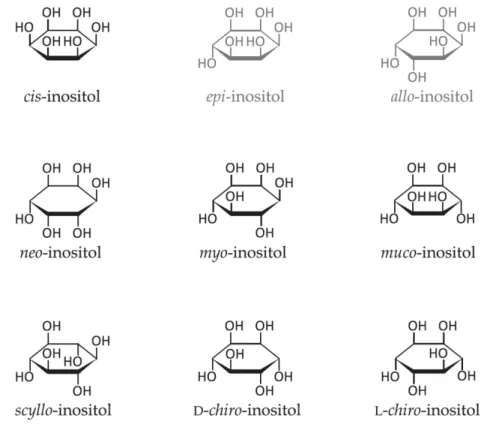
on the spatial orientation of its six hydroxyl groups (Figure 4). Among these nine possible structural isomers, myo-inositol (Myo-Ins) and D-chiro-inositol (DCI) are the widest distributed in the human organism.
Figure 4. Structural formulas of inositol stereoisomers. Inositols shown in grey (epi and allo-inositol) do not occur naturally. Adapted from: Schneider S. Inositol transport proteins. FEBS Lett. 2015 Apr 28;589(10):1049-58.
With over 99% of all stereoisomers, Myo-Ins stands as the ruling stereoisomer in the human body, while its conversion by an insulin-dependent epimerase synthesizes DCI. A physiological serum ratio 40:1 is the quantity present in the human organism for both of them [107].
Myo-Ins is an achiral (meso) molecule whose internal structure is characterized by the presence of a plan of symmetry. It was first described by Scherer in 1850 who isolated it from the muscle tissue and called it “Inosit”, while the -ol suffix was added later [107].
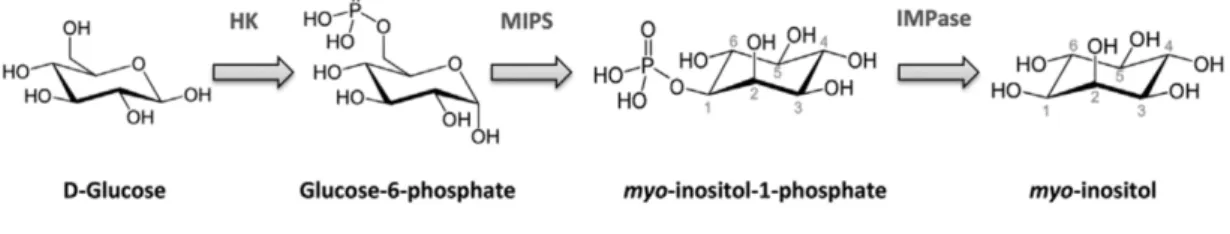
In the human organism, Myo-Ins can be synthesized from D-glucose in a three-step reaction. Nevertheless, due to the low efficacy of this reaction, Myo-Ins derives above all from exogenous sources and for this reason some authors have considered it as a part of the vitamin B complex group [107].
Myo-Ins is present in greater quantities in fresh fruits and vegetables and in all foods containing seeds (beans, grains and nuts). High quantities of inositol in form of phytic acid are especially contained in almonds, walnuts and Brazil nuts (9.4, 6.7 and 6.3% of dry weight, respectively) as well as in oats and bran [108]. Beans and peas are the vegetables with the highest content of Myo-Ins while leafy vegetables are the poorest ones. Finally, cantaloupe and citrus fruits (with the exception of lemons) are extraordinarily rich in Myo-Ins: for example, a portion of grapefruit juice (120 g) contains about 470 mg of Myo-Ins [17].
The amount of Myo-Ins assumption through the diet has not been widely investigated, and available data are indirect measurements based on the consumption of phytate-rich aliments [109]. Dietary requirements may vary based on several factors such as age, geographical area, long-term use of antibiotics, or regular consumption of coffee. In particular, the daily intake does not exceed 500–700 mg/day for Western countries, while higher consumption have been recorded in Africa and Asia [110].
Myo-Ins is one of the oldest components of living beings. In addition to the important biological functions which performs in its free form, it is also an important component of structural lipids and of secondary messengers.
More specifically, Myo-Ins is the only inositol that is part of the phospholipids [110].
Phospholipids are very important structural elements of all eukaryotic cellular membranes. In order to maintain the structural integrity of the cell, phospholipids undergo numerous
metabolic modifications. Produced by a group of particular phosphoinositide-kinases
(PIKs), Inositides or Phosphoinositides (PIPs) are mainly all phosphorylated inositol-based
phospholipids. PIPs are composed of a glycerolphospholipid linked through a
phosphodiester bond to the hydroxyl in position 1 of a Myo-Ins molecule [110,111].
Inositol polyphosphates (InsPs) are an important class of structures based on Myo-Ins. They consist of a Myo-Ins core that is phosphorylated at different positions. The most present InsP isomers are Myo-Ins (1,2,3,4,5,6)-hexakisphosphate, known as “phytate” (InsP6), and Myo-Ins (1,3,4,5,6)-pentakisphosphate (InsP5) [107].
Membrane-bound phosphoinositides (PtdIns) and the corresponding soluble InsP act as a base to generate by phosphorylation a variety of compounds that control several cellular processes including cell proliferation, synaptic vesicle recycling, receptor signalling and actin polymerization. Indeed, cell membrane phospholipids are the source of inositol triphosphate (IP3), diacylglycerol (DAG) and inositolphosphoglycans (IPG) that act as second messengers of several metabolic pathways, comprehending the ones that depend on luteinizing hormone (LH), thyroid stimulating hormone (TSH), follicular stimulating hormone (FSH) and insulin [110].
Signaling from the inner leaflet of the plasma membrane starts from PtdIns(4,5)P2 and PtdIns(3,4,5)P3. PtdIns(4,5)P2 serves both as a precursor for specific messengers,
other phospholiases, such as PLD. PtdIns(4,5)P2 is also converted to PtdIns(3,4,5)P3 by PI 3-kinases. A great deal of important protein kinases such as protein kinase C (PKC) and Akt/PKB, Btk isoforms are recruited and activated by this lipid [110].
PIPs regulate the activity of a number of ion channels and transporters, thereby controlling distribution and gradients of hydrophilic and charged molecules but also hydrophobic ones [112].
InsP5 is involved in cell proliferation, viral assembly, chromatin remodeling, and the regulation of calcium channels. It has been shown that InsP5 inhibits Akt activation by competing for binding of the Akt PH domain, thereby attenuating downstream angiogenesis, resulting in apoptosis in cancer cells [107]. InsP6 has antioxidant properties and acts as an anti-neoplastic agent. Besides, it plays an important role in several activities such as neurotransmission, immune responses, regulation of protein kinases and phosphatases, and activation of calcium channels [107,113].
2.2 Digestion and absorption
Both animal and plant source present Myo-Ins in its free form, as either inositol-containing phospholipid (phosphoinositides) or phytic acid (inositol hexaphosphate or IP6) [16,114]. More specifically, enzymes phytases, found in the intestinal mucosa of some animals, can release Myo-Ins in the gut of monogastric animals [114]. Present in plants, animal tissues, and microorganisms, phytases (myo-inositol hexaphosphate phosphohydrolase, EC 3.1.3.8 and EC 3.1.3.26) are able to release free inositol, orthophosphate, and intermediary products and forms of inositol, including the mono-, di-, tri-, tetra- and penta-phosphate ones. The form of phosphatidylinositol (PI) represents a substantial part of the ingested myo-inositol consumed. A pancreatic phospholipase A may hydrolyze PI in the intestinal lumen. Acyltransferase activity may then recyclate the resultant lyso-phosphatidylinositol (lysoPI) via the intestinal cell, upon entering, or be further hydrolyzed after glycerylphosphorylinositol is released [16,108].
Virtually, the 99.8% of the free Myo-Ins ingested is absorbed from the human gastrointestinal tract, through an active transport that involves a Na+/K+-ATPase [16,114].
Uptake and accumulation occur against a concentration gradient in a Na+-dependent manner [110,114]. An active transport system has been described in kidney, endothelial, epithelial and neuronal cells. Two transporters, SMIT1 and SMIT2, for instance, have been highlighted in adjusting the levels of inositol, brain and peripheral, with two sodium ions being co-transported along the concentration gradient [115].
This process is significantly inhibited in a non-competitive manner by glucose and other sugars [110]. Free inositol is transported in human blood plasma at a concentration of approximately 30 micromoles (µM) in normal and healthy subjects. In association with the circulating serum lipoproteins, small but important amounts of Myo-Ins can be found in phospholipids, and as phytic acid at a level of about 0.1 and 0.4 µM [109,110].
2.3 Biosynthesis and catabolism
Biosynthesis of Myo-Ins occurs endogenously, with a rate close to 4 g/day, mainly in the kidney.
Extra renal tissues (e.g., brain, testis, and liver) can also contribute to the production of inositol under hormonal control [16,116].
Myo-Ins biosynthesis from D-glucose occurs in in a three-step reaction: in the first step, glucose is phosphorylated in phosphate by hexokinase; then, glucose-6-phosphate is transformed into myo-inositol-1-glucose-6-phosphate by 1-D-myo-inositol glucose-6-phosphate synthase (MIPS); lastly, myo-inositol-1-phosphate is dephosphorylated by inositol monophosphatase (IMPase) and free Myo-Ins is produced (Figure 5) [16].
Figure 5. Myo-inositol de novo biosynthesis from D-Glucose. Adapted from: Croze ML, Soulage CO. Potential role and therapeutic interests of myo-inositol in metabolic diseases. Biochimie. 2013 Oct;95(10):1811-27
Kidney is the most important organ in the catabolism of Myo-Ins, since in vivo models have shown that nephrectomy impairs Myo-Ins degradation while a considerable amount of abnormalities in Myo-Ins metabolism have been associated with renal failure as well as increased plasma levels of inositol [16,116].
2.4 Main clinical implications
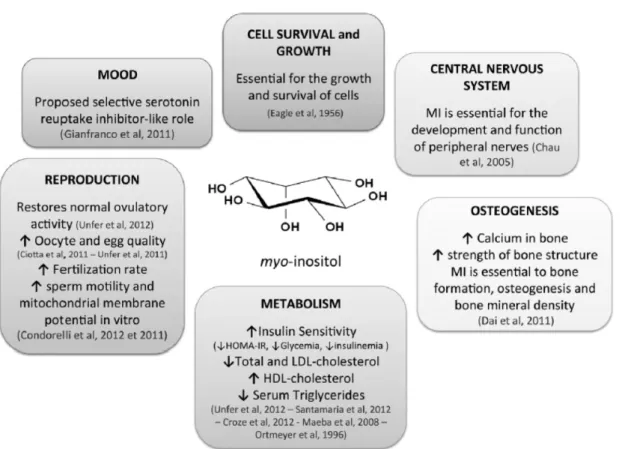
Inositol and its phosphate derivatives regulate a variety of biological processes including cell growth and survival [117], development and function of central nervous system [118], osteogenesis [119], glucose and lipid metabolism, endocrine function and reproduction [120–123] (Figure 6).
Figure 6. Functions and implications of myo-inositol in human health. Adapted from: Croze ML, Soulage CO. Potential role and therapeutic interests of myo-inositol in metabolic diseases. Biochimie. 2013 Oct;95(10):1811-27.
It has been widely demonstrated that inositol has an important role in the pathogenesis of several neurological and neurodegenerative diseases (e.g. Alzheimer disease and epilepsy), as well as in cardiovascular, endocrine and gynecological diseases [103,124–127].
With a specific reference to the field of obstetrical and gynecological disorders, several and consistent data confirm that Myo-Ins supplementation positively impacts on fertility
maternal adaptation to gestational status [120,128]. Furthermore, Myo-Ins could have positive effects in periconceptional period and as well in early stages of pregnancy. Indeed, there seems to exist an apparent association between folate-resistant embryo neural tube defects (FR-NTDs) and a dysregulation of the inositol pathway during pregnancy.
Around 30% of all cases of NTDs with unclear pathogenesis are represented by FR-NTDs, which occur in early embryogenesis in spite of folic acid being correctly administrated in periconceptional period [129,130]. Inositol concentrations were shown being considerably lower in the blood of pregnant women carrying fetuses with NTD in comparison to normal pregnancies; moreover, mothers presented an increased risk of an affected child when low blood levels of inositol indicated a 2.6-fold [131,132].
In recent years, several studies have investigated inositols as insulin-sensitizing integrative agents acting to directly and indirectly influence ovarian function. Polycystic ovary syndrome (PCOS) can be considered as one of the commonest endocrine disorder among women of childbearing age. This condition is commonly associated with a high prevalence of obesity, hyperinsulinemia and insulin resistance. Consequently, patients with PCOS are at increased risk of metabolic syndrome, T2DM and cardiovascular diseases [133].
IR and compensatory hyperinsulinemia play a key role in the pathogenesis of PCOS [134]. Indeed, androgen production from theca cells is stimulated by insulin which also decreases directly the production of steroid hormone binding protein (SHBG). This mechanism leads to increased levels of free, biologically active androgens. IR is increased by both abdominal obesity and androgen overproduction, possibly by lowering the GLUT 4 transporters expression in skeletal and adiposal muscle tissue.
Androgen production is also induced by obesity and a high concentration of circulating free fatty acids (FFA). Furthermore, insulin-dependent pathways influence the hypothalamic–pituitary function, determining an increase of GnRH induced LH release as
well as of the gonadotropin-induced ovarian androgen production [135]. For all these reasons, the insulin-sensitizing drugs have a significant relevance among the first-line treatments for PCOS [136].
Interestingly, it has been observed an increased urinary excretion of inositol phosphoglycan in patients with PCOS and insulin resistance, suggesting that the excretion of inositol phosphoglycan could contribute to the insulin resistance associated with PCOS [19,137] .
Oral administration of DCI and/or Myo-Ins enhances insulin sensitivity and reduces the insulin resistance in PCOS patients; furthermore, it has a positive impact on ovulation and cycle regularity and improves the hormonal profile by reducing circulating androgens and the LH/FSH ratio, increasing the levels of SHBG, and improving clinical features of hyperandrogenemia, such as hirsutism and acne [138]. Inositol supplementation may reduce BMI and blood pressure in PCOS patients; finally, it also improves the lipid profile, reducing hypertriglyceridemia and increasing HDL levels [128]. In accordance with the data available, inositol treatment has shown high effectiveness, especially among patients with a positive family history of diabetes type 2 or those that are obese and hyperinsulinemic [139,140]. Abnormalities in Myo-Ins and DCI metabolism seem to be involved in the development of insulin resistance and diabetic complications not only in women with PCOS but also in healthy men and women. Indeed, studies conducted both on diabetic animal and human models have shown a concomitant intracellular depletion of Myo-Ins and accumulation of intracellular sorbitol in the primary sites for the development of diabetic microvascular complications [103,141].
2.5 Myo-inositol and gestational diabetes
Inositol supplementation has been widely evaluated as a prophylactic/therapeutic alternative during pregnancy due to the positive outcomes obtained in terms of maternal– fetal safety and its potential role in improving glucose profile and reducing the adverse effects of hyperglycemia. Recent evidence have demonstrated the insulin-sensitizing effect of inositol, encouraging to analyze the role of this molecule in the pathogenesis of GDM [19,21,142].
As above mentioned, Myo-Ins is widely involved in glucose homeostasis, providing the structural basis for secondary messengers in eukaryotic cells [16]: alterations of this signaling pathway are associated with diabetes, obesity and various metabolic diseases, as well as with their associated complications (cardiovascular complications and inflammation) [103].
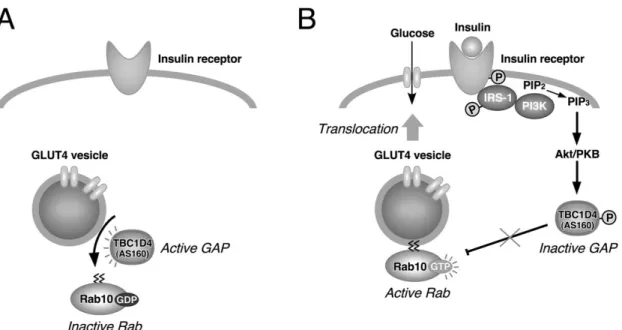
Inositol trisphosphate (InsP3) plays a pivotal role in regulation of the intracellular process related to glucose metabolism, representing a key component in insulin signaling [143,144]. More in detail, when insulin binds the insulin receptor tyrosine kinase, it increases the phosphorylation of insulin receptor substrates: IRS1 and IRS2 [145,146]. Tyrosine phosphorylated IRS proteins bind to the SH2 domains of the p85 regulatory subunit of Class IA PI3K (Phosphatidylinositol 3-kinases), a family of lipid kinases that has serine/threonine (Ser/Thr) kinase activity and that catalyze the addition of a phosphate group to the 3'-position of the inositol ring. It has been suggested that peripheral insulin resistance can be the product of impaired PI3K signaling in the effector cells [147]. Akt, a serine/threonine kinase, stands as one of the main effectors of PI3K downstream signaling network [148]. The three Akt isoforms (Akt1, Akt2 and Akt3) present diverse physiological functions, characteristics and expression patterns.
could result in severe insulin resistance and diabetes, along with lipoatrophy [150], and Akt3 plays a prevalent role in brain and neuronal cell size [151].
PI3K activation transforms phosphatidylinositol 4, 5-bisphosphate (PIP2) to PIP3 [148]; PIP3 can bind the pleckstrin homology (PH) domain of Akt and this allows the Akt transfer to the membrane from cytoplasm. Akt is then activated by 3'-phosphoinositide-dependent kinase 1 (PDK1) through the phosphorylation of Thr308 and Ser473 [152,153]. Activation of AKT upregulates the glucose uptake mediated by GLUT4 translocation from the intracellular pool to the plasma membrane. This translocation takes place thanks to the phosphorylation of protein AS160, that is the Akt substrate that contains GAP domain for Rabs, small G proteins required for membrane trafficking (Figure 7) [154,155].
Figure 7. A possible mechanism of TBC1D4/AS160 in GLUT4 translocation to the plasma membrane in adipocytes. Adapted from: Fukuda M. TBC proteins: GAPs for mammalian small GTPase Rab? Biosci Rep. 2011 Jun;31(3):159-68.
Activation of Akt also promotes transcription of genes involved in insulin secretion and action mediated by the regulation of the FoxO transcription factor [156].
overweight or obese women [20,22] or women with family history for T2DM [14,19]. Myo-Ins supplementation may also reduce the occurrence of GDM-related complications, comprehending shoulder dystocia, respiratory distress syndrome, neonatal hypoglycemia, preterm delivery and polyhydramnios [14,157].
Clinical evidences deriving from randomized clinical trial have highlighted the positive effect of Myo-Ins in reduction of mean fetal weight at delivery and incidence of fetal macrosomia in pregnant women with a family history of type 2 diabetes [19].
The biochemical mechanisms at the base of the reported benefits of oral administration of Myo-Ins on metabolic derangements in patients with GDM and other states of insulin resistance are still not fully understood. It is possible that Myo-Ins exerts a directly intracellular effect by the activation of acetil CoA carboxylase-stimulating lipogenesis, or it acts indirectly as a precursor of DCI-containing inositolphosphoglycan (DCI-IPG), which have been shown to stimulate pyruvate dehydrogenase and activate glycogen synthase activities in muscle and adipose tissue, similar to the effects of insulin [158,159]. In conclusion, the beneficial effects of Myo-Ins supplementation on GDM appear promising. The optimal dose, frequency of administration, and the effects of different forms of inositol on GDM have to be further investigated. It is likely that Myo-Ins supplementation will be a cost-effective and attractive option in GDM prevention and reduction of GDM-related complications. Further evaluations in multicenter, randomized controlled trials are needed to draw firm conclusion.
Chapter 3
Bioelectrical impedance analysis (BIA)
3.1 Introduction
The measurement of body composition parameters such as fat mass (FM), fat-free mass (FFM), body cell mass (BCM), total body water (TBW), extracellular water (ECW) and intracellular water (ICW) is of high importance in numerous clinical situations [160]. TBW and FFM have a strong relation, the latter containing an average of 73.2% of water in healthy individuals [161]. Similarly, BCM is also strictly connected to ICW [162]. Radio-isotopic dilution, of deuterium for TBW [163] and bromide for ECW, is used in most of the predominant methods for measuring body fluid volumes [164]. Radioactive potassium isotope, 40K, included in body potassium, can measure ICW space [165]. However, these procedures cannot be used frequently as they are invasive and expensive, and are not able to be repeated at short intervals [166].
Due to these limitations, bioimpedance methods for measuring body fluids rapidly developed.
BIA is a fairly simple technique, quick, non-invasive used to assess body composition. BIA measures the response of the body to an applied electrical current. The opposition to this current flow or the impedance is measured while the body is passed through by a low level alternating current [167].
The first studies on electrical impedance measurements as an index of TBW were conducted by Thomasset, using two subcutaneously inserted needles [168]. Quad surface electrode readings for bioimpedance measurements were applied by Nyober, in order to roughly calculate the FFM of the human body [169]. Hoffer later presented, in reference to
tritium dilution techniques, the connection between total body impedance and TBW content [170].
The first single frequency commercial instrument was produced by RJL in the 1980s, followed by multifrequency instruments in 1993 [167].
The standard BIA devices are hand-to-hand and foot-to-foot models, without complications in their use, with which no great technician/user experience is required. In addition, through the use of a four electrodes model, BIA assesses total body fat by sending a low electrical current throughout the body [171]. Nonetheless, bioimpedance methods are indirect, with their accuracy depending especially on the validity of the electrical model of tissues used [166]. There has been an increase in the implement of BIA due to its portable and safe instrumentation, an uncomplicated and noninvasive procedure, and the possibility of reproducible results rapidly obtained. More recently, the development of segmental BIA has overcome inconsistencies between body mass of the trunk and resistance (R) [172].
3.2 Physical principles of BIA
In the BIA procedure, an alternating electric current at a typical frequency of 50 kHz is passed through the body via ECG-type skin electrodes. The electric current (typically between 200 and 800 µA), is conducted along the path of least resistance which is the tissue with high water content. Measurement of the impedance is recorded and an arithmetic transformation is used to relate this measure to the physiological parameter of interest [167].
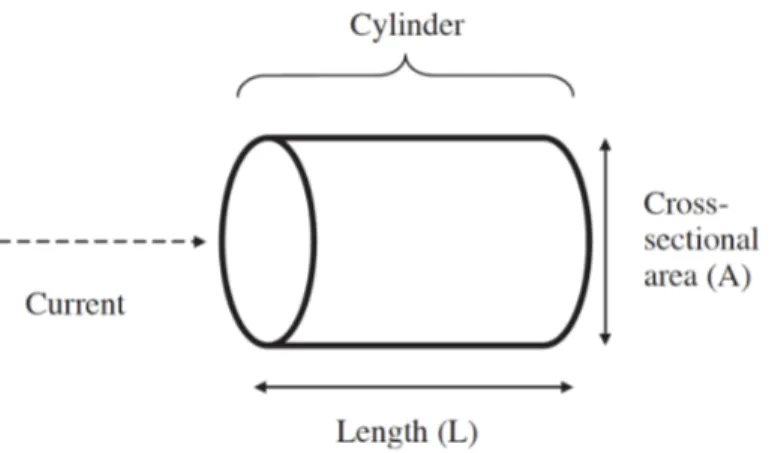
The impedance (Z) is a two-dimensional vector quantity and it can be expressed either as a magnitude (in Ohms) and phase angle (degrees) or as a resistance (R) and reactance (Xc). There is a proportion between the resistance (R) of a length of homogeneous conductive material of uniform cross-sectional area and its length (L), but the measure is inversely proportional to the cross-sectional area (A) (Figure 8).
Figure 8. Principles of BIA from physical characteristics to body composition. Adapted from: Kyle UG, Bosaeus I, De Lorenzo AD, Deurenberg P, Elia M, Gómez JM, et al. Bioelectrical impedance analysis--part I: review of principles and methods. Clin Nutr 2004;23:1226–43.
In a cylindrical conductor the impedance is given by Equation 1: Z= r !
"
Using the relationship for the volume of a cylinder, Equation 1 can be rearranged to provide the relation between impedance and volume (Equation 2):
V= r !$#
Equation 2 establishes a well-defined relationship between volume and the impedance quotient. The electrical resistivity, r, varies significantly between tissue types. In addition, Equation 2 is restricted to cylindrical conductors with a uniform cross-sectional area while the human body is not a uniform cylinder [167]. Another complication is presented by the body offering two types of R to an electrical current: resistive R (called just resistance) and capacitative R (reactance).
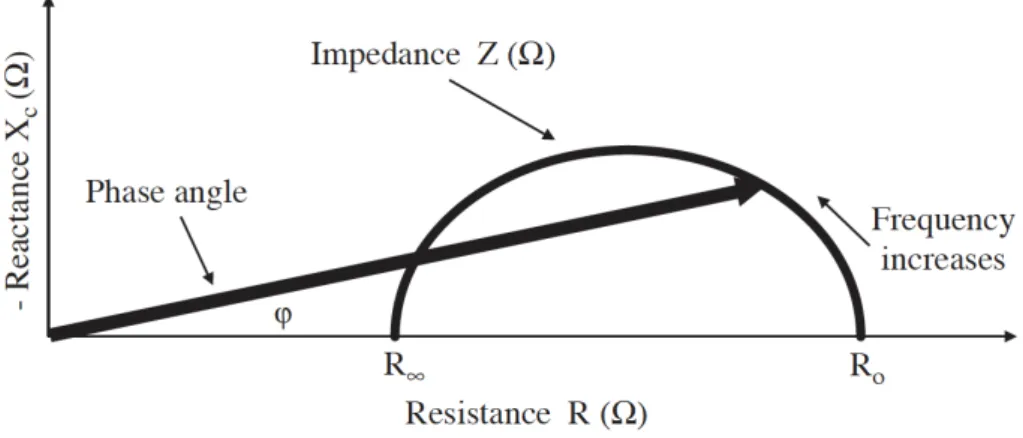
The reactance is the opposition to the current flow due to cell membranes and tissue interfaces while the resistance is the opposition to the current inherent in body conductors (fluids) [167,172].
The capacitance results from cell membranes, while the R from extra- and intracellular fluid. The combination of the former two being referred to with the term impedance [172]. The cell membrane, which acts as an insulator, is not penetrated by the current at zero (or low) frequency, thus the latter goes through the extracellular fluid which is responsible for the measured R of the body R0. The capacitor fulfills its role perfectly (or almost perfectly)
at infinite frequency (or very high frequency), and therefore the total body R (R¥) reflects
the combined of both intracellular and extracellular fluid [172].
Diverse electrical properties of tissues affected by several diseases are reflected by the relationship between capacitance and R.
The phase angle, one of the measures of this relationship, and other interrelated indices, including R0/RN, have been used to predict clinical outcomes (Figure 9) [167,172].
Figure 9. Diagram of the graphical derivation of the phase angle; its relationship with resistance (R), reactance (Xc), impedance (Z) and the frequency of the applied current. Adapted from: Kyle UG, Bosaeus I, De Lorenzo AD, Deurenberg P, Elia M, Gómez JM, et al. Bioelectrical impedance analysis--part I: review of principles and methods. Clin Nutr 2004;23:1226–43.
3.3 BIA approaches
3.3.1 Single Frequency Bioimpedance Analysis (SF-BIA)
The analysis of bioimpedance data obtained at 50 KHz electric current is known as single-frequency bioimpedance analysis (SF-BIA) [174]. Electric current is generally passed between surface electrodes placed on hand and foot (Figure 10) [172].
Figure 10. Standard placement of electrodes for SF-BIA and MF-BIA. Adapted from: Kyle UG, Bosaeus I, De Lorenzo AD et al. Bioelectrical impedance analysis--part I: review of principles and methods. Clin Nutr 2004;23:1226–43.
SF-BIA is among the first methods proposed for the estimation of body compartments, based on the inverse proportion between assessed impedance and TBW, which is the sum of extra- and intracellular fluids, respectively (about 25% and 75%) and represents the conductive path of an electric current [172,173].
More specifically, SF-BIA estimates ECW and TBW; consequently, ICW is calculated by subtracting the former from the latter [172,175].
BIA results have its base on theories and empirical equations where healthy subjects with tight biological homeostasis are the main components [172].
SF-BIA instruments have been used to assess TBW and FFM in normally hydrated subjects, although SF-BIA is not valid under conditions of significantly altered hydration [172,174,176].
To date, SF-BIA is still the preferred procedure of bioimpedance analysis in clinical practice as well as in scientific research [175].
3.3.2 Multiple Frequency Bioimpedance Analysis (MF-BIA)
Multiple-frequency bioimpedance analysis (MF-BIA) is the analysis of bioimpedance obtained at more than two frequencies [174].
Similar to SF-BIA, MF-BIA makes use of empirical linear regression models although with different frequencies (0, 1, 5, 50, 100, 200 to 500 kHz) to evaluate FFM, TBW, ICW and ECW [172].
According to Hannan et al., estimated TBW, while oscillating at a frequency under 5 KHz and higher than 200 KHz, is more accurate implementing the MF-BIA rather than bioimpedance spectroscopy with the same predicted values of ECW for both techniques [177].
In addition, Patel et al. report that TBW prediction using SF-BIA gave more precise results than MF-BIA, whereas SF-BIA, compared to MF-BIA, was more accurate and less biased for TBW in critically ill subjects [172,174,178].
Compared to SF-BIA, MF-BIA is less used in clinical practice and further studies are needed to improve this methodology for the assessment of body composition.
For example, Dittmar and Reber derived new equations for estimating BCM from SF-BIA and MF-BIA in elderly. However, they failed to find any advantage of MF-BIA as compared to SF-BIA for the prediction of BCM [179].
3.3.3 Bioimpedance Spectroscopy (BIS)
Bioimpedance spectroscopy (BIS) is defined as the analysis of bioimpedance data obtained using a broad band of frequencies [174].
Differently from MF-BIA, BIS has its base on the use of mathematical modeling and mixture equations where relationships between R and body fluid in compartments are generated, and it is also used to predict R0 and R¥, developing then empirically derived
prediction equations instead of going to mixture modeling [167,172].
In the spectroscopy approach, the impedance is measured at many frequencies in the range from 5 to 1000 kHz. The resistance and reactance of the measured impedances are plotted and form a semicircular locus as shown in Figure 11 [167].
Figure 11. Plotted resistance and reactance of the measured impedance. Adapted from: Cornish B. Bioimpedance analysis: scientific background. Lymphat Res Biol 2006;4:47– 50.
The values of R0 and R∞ can be determined extrapolating the data along the theoretical
circular locus. The impedance quotients H2/R0 and H2/R∞ can be used to estimate
extracellular fluid and total body fluid volumes, respectively [167].
Although several studies have compared BIS with other BIA techniques obtaining promising results, this approach is not widespread in clinical practice [180–182].
3.4 BIA procedures
In order to estimate whole body compartments, measurement of total body bioimpedance can be considered as one of the most commonly used methods [174,175].
The most common approach is based on the use of a tetrapolar hand to foot arrangement that allows to bypass the high skin impedance (Figure 12a) [183].
In this procedure, the subject is in a supine position on a nonconductive bed, with arms separated from the trunk and legs separated one from the other in a straightened position. Four surface electrodes are positioned in the middle of the dorsal surfaces of the right hand and foot proximal to the metacarpal–phalangeal and metatarsal–phalangeal joints, respectively, as well as the distal protuberances of the radius and ulna and at the ankle, in the space between the medial and lateral malleoli [175,184,185].
The use of alcohol to prepare skin sites before placing the electrodes has also been advised [175,184–186]. Moreover, it is important that electrodes are accurately placed with reference to anatomical markers [175,186].
According to the different BIA approaches, a possible variation of the current, passed between the outer electrodes, may occur, from 100 up to 800 µA in a range of frequencies from 1 to 1000 kHz. The voltage drop is detected with the two inner electrodes [173]. Other two approaches, that are less used than the hand-to-foot arrangement, are foot-to-foot or leg-to-leg method and hand-to-hand method [174,175].
Nuñez et al. introduced a leg-to-leg bioimpedance method [187] where the subject stands vertically, feet uncovered, on four footpads electrodes made of stainless steel and the current flows through the lower extremities (Figure 12b) [188].
Hand-to-hand bioimpedance measurements were introduced by Ghosh et al. for subjects with malnutrition [189]. In this procedure, both arms are stretched out horizontally in front of the body [174].