1
Umberto Anguzza
A METHOD TO DEVELOP A COMPUTER
-
VISION BASED SYSTEM FOR THE AUTOMATIC DAIRY COW IDENTIFICATION AND BEHAVIOURDETECTION IN FREE STALL BARNS
Tesi per il conseguimento del titolo di Dottore di Ricerca
Tutor: Ch.mo Prof. Claudia Arcidiacono
Coordinatore: Ch.mo Prof. Claudia Arcidiacono
UNIVERSITÀ DEGLI STUDI DI CATANIA
Dipartimento di Gestione dei Sistemi Agroalimentari e Ambientali Sezione Costruzioni e Territorio
3
To my wife Simona, whose unconditional love, cooperation, knowledge, availability, patience and support made the thesis work possible. To my daughter Chiara, who will complete her four years next month. I spent little time with her, especially in these recent months. My thoughts to Chiara allowed me to find the energy to complete this dissertation.
5
CONTENTS
ABSTRACT ... 9
1 INTRODUCTION ... 11
1.1 PREFACE ... 11
1.2 OBJECTIVE OF THE STUDY ... 13
1.3 WORK ORGANIZATION ... 14
2 STATE OF THE ART ... 15
2.1 THE OBSERVATION OF ANIMAL BEHAVIOUR ... 15
2.1.1 The selective observation ... 16
2.1.2 Some open issues on animal behaviour observation ... 19
2.2 OBSERVATION OF DAIRY COW BEHAVIOUR ... 20
2.2.1 Traditional methods ... 20
2.2.1.1 Check lists compiled in field ... 20
2.2.1.2 Analysis of digital images from time-lapse video recordings ... 21
2.2.2 Automated image analysis-based methods ... 25
2.3 ICT APPLICATIONS FOR ANIMAL LOCALIZATION AND IDENTIFICATION ... 26
3 MATERIALS AND METHODS ... 29
3.1 THE MULTI-CAMERA VIDEO-RECORDING SYSTEM ... 31
3.1.1 Computation of the number of cameras to be installed in the barn ... 31
3.1.2 Image synchronization and mosaicing ... 33
3.2 OBJECT RECOGNITION IN DIGITAL IMAGES WITH THE VIOLA &JONES ALGORITHM ... 37
3.2.1 Main concepts of the Viola & Jones Algorithm ... 37
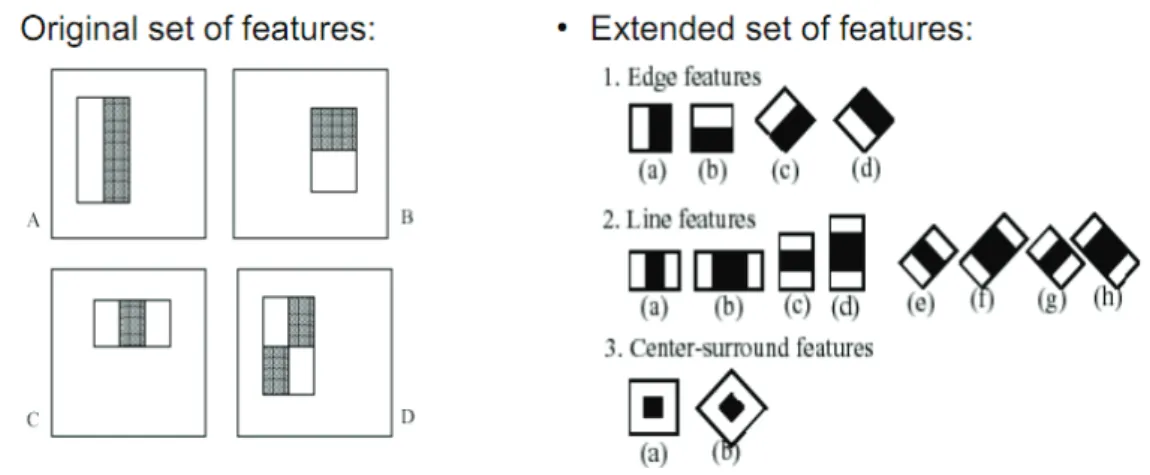
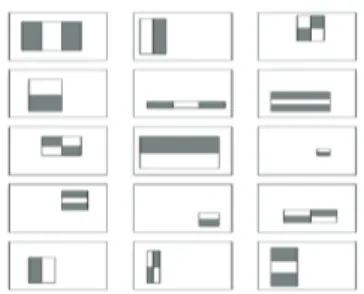
3.2.1.1 Haar features ... 37
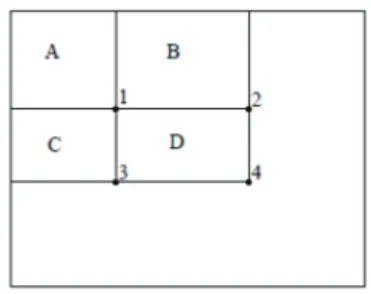
3.2.1.2 Integral image ... 38
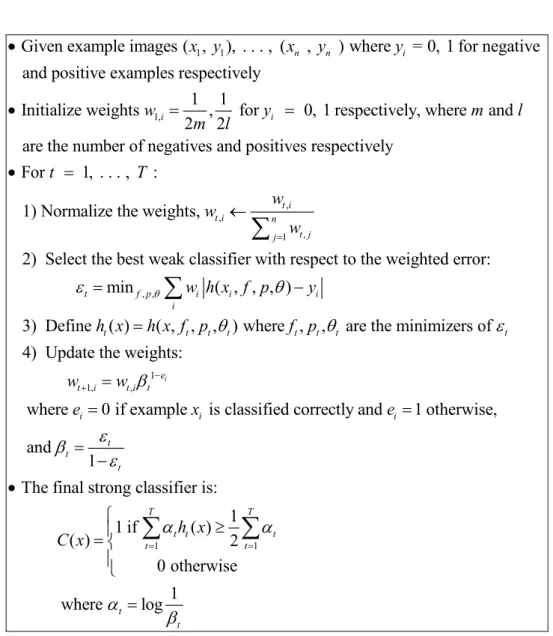
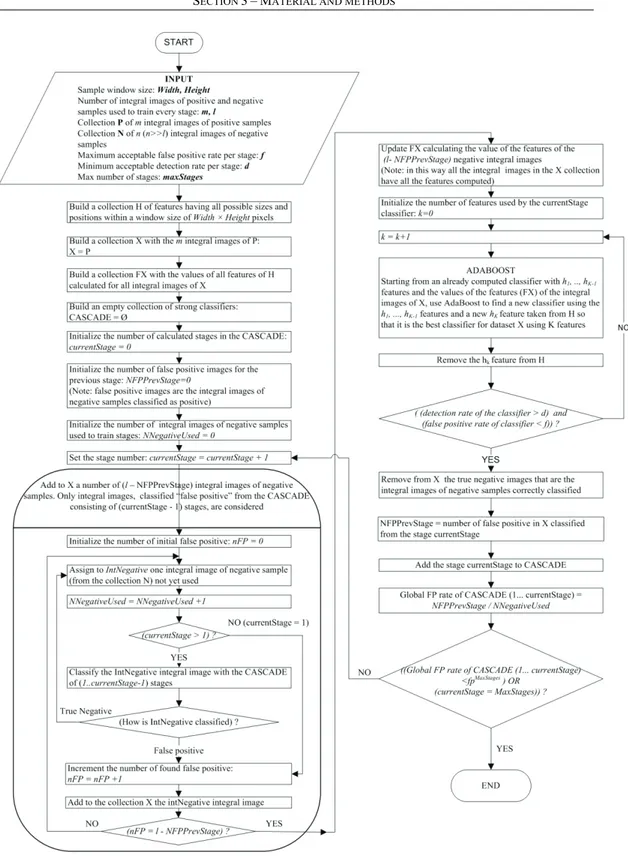
3.2.1.3 The AdaBoost machine-learning method ... 41
3.2.1.4 The cascade of strong classifiers ... 43
3.2.2 Modelling and execution of the Viola & Jones classifier ... 43
3.2.2.1 Training ... 45
3.2.2.2 Execution ... 46
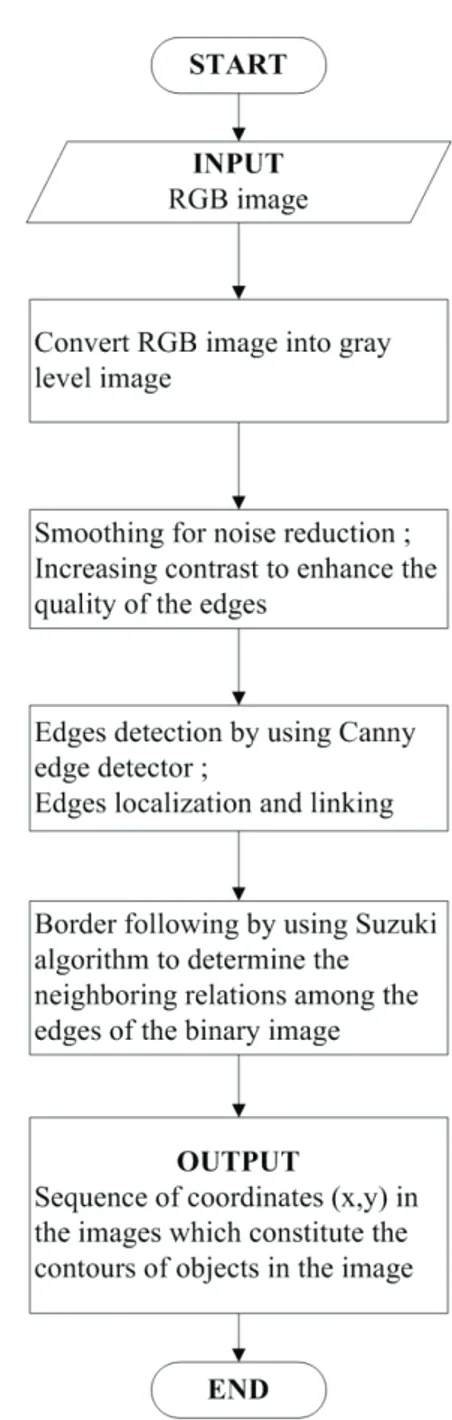
3.3 RECOGNITION OF OBJECT CONTOURS IN DIGITAL IMAGES WITH THE NORMALIZED PRODUCT SCALAR METHOD ... 49
6
3.3.1 Main concepts of object contour detection ... 49
3.3.1.1 Image segmentation ... 49
3.3.1.2 Edge detection and contour findings ... 50
3.3.1.3 Contour representation ... 50
3.3.1.4 The proposed contours matching methodology ... 52
3.3.2 Modelling and execution of the proposed contour matching algorithm ... 54
3.3.2.1 Construction of a database of known contours ... 54
3.3.2.2 Execution ... 56
3.4 THE CASE STUDY ... 57
3.4.1 The area of the barn under study ... 57
3.4.2 Developed software tools ... 59
3.4.3 The design and installation of the video recording system ... 59
3.4.3.1 Camera model selection ... 60
3.4.3.2 Camera image calibration ... 60
3.4.3.3 Evaluation of the maximum horizontal and the maximum vertical view angles after the calibration process ... 61
3.4.4 Full rectified panoramic top-view image of the area under study ... 62
3.4.5 First methodology: the automatic detection of cow behavioural activities in free-stall barns (objective 1) ... 65
3.4.5.1 Training phase ... 65
3.4.5.2 Software tool for the detection of dairy cow behavioural activities in free-stall barns ... 69
3.4.5.3 Test phase ... 70
3.4.5.4 The validation of the CVBS for the automatic detection of dairy cow behavioural activities in free-stall barns ... 72
3.4.6 Second methodology: the automatic identification of dairy cows in free-stall barns (objective 2) ... 75
3.4.6.1 Cow visual identifier ... 75
3.4.6.2 Software tool for the automatic extraction and matching of contours ... 76
3.4.6.3 Construction of the database constituted by known contours of cow visual identifier... 80
7
3.4.6.5 The validation of the CVBS for the automatic identification
of dairy cows in free-stall barns ... 83
4 RESULTS ... 85
4.1 FIRST METHODOLOGY: THE AUTOMATIC DETECTION OF COW BEHAVIOURAL ACTIVITIES IN FREE-STALL BARNS (OBJECTIVE 1) ... 85
4.1.1 Lying behaviour classifiers ... 88
4.1.2 Feeding behaviour classifier ... 90
4.1.3 Standing behaviour classifiers ... 90
4.1.4 Perching behaviour classifiers ... 93
4.2 SECOND METHODOLOGY: THE AUTOMATIC IDENTIFICATION OF DAIRY COWS IN FREE-STALL BARNS (OBJECTIVE 2) ... 95
5 DISCUSSION ... 101
5.1 FURTHER UTILIZATION OF THE DESIGNED MULTI-CAMERA VIDEO RECORDING SYSTEM ... 101
5.2 FIRST METHODOLOGY: THE AUTOMATIC DETECTION OF COW BEHAVIOURAL ACTIVITIES IN FREE-STALL BARNS (OBJECTIVE 1) ... 102
5.3 SECOND METHODOLOGY: THE IDENTIFICATION OF DAIRY COWS IN FREE -STALL BARNS (OBJECTIVE 2) ... 104
5.4 POTENTIAL APPLICATIONS OF THE CVBS AND FURTHER IMPROVEMENTS . 107 5.4.1 First methodology: the automatic detection of cow behavioural activities in free-stall barns (objective 1) ... 107
5.4.2 Second methodology: the identification of dairy cows in free-stall barns (objective 2) ... 109
6 CONCLUSIONS ... 115
REFERENCES ... 117
9
A METHOD TO DEVELOP A COMPUTER
-
VISION BASED SYSTEM FOR THE AUTOMATIC DAIRY COW IDENTIFICATION AND BEHAVIOURDETECTION IN FREE STALL BARNS
A
BSTRACTIn this thesis, a method to develop a computer-vision based system (CVBS) for the automatic dairy cow identification and behaviour detection in free stall barns is proposed. Two different methodologies based on digital image processing were proposed in order to achieve dairy cow identification and behaviour detection, respectively. Suitable algorithms among that used in computer vision science were chosen and adapted to the specific characteristics of the breeding environment under study.
The trial was carried out during the years 2011 and 2012 in a dairy cow free-stall barn located in the municipality of Vittoria in the province of Ragusa. A multi-camera video-recording system was designed in order to obtain sequences of panoramic top-view images coming from the multi-camera video-recording system. The two methodologies proposed in order to achieve dairy cow identification and behaviour detection, were implemented in a software component of the CVBS and tested.
Finally, the CVBS was validated by comparing the detection and identification results with those generated by an operator through visual recognition of cows in sequences of panoramic top-view images. This comparison allowed the computation of accuracy indices. The detection of the dairy cow behavioural activities in the barn provided a Cow Detection Percentage (CDP) index greater than 86% and a Quality Percentage (QP) index greater than 75%. With regard to cow identification the CVBS provided a CDP > 90% and a QP > 85%.
Keywords: cow behavioural activity, precision livestock farming, dairy
11
1
I
NTRODUCTION1.1 Preface
The optimization of the overall life quality of animals housed in intensive farming systems, both in terms of comfort and productivity, involves the analysis of several responses that an animal produces to adapt to the environment, such as behavioural modifications and physiological mechanisms that could affect animal health status and growth.
As concerns the intensive farming of dairy cows, animal health can be investigated by the analysis of four categories of indicators: behavioural indicators, physiological indicators, pathological indicators, and productivity indicators (Smidt, 1983).
In research works aiming at assessing cow welfare, a growing attention to the analysis of cow behaviour has been paid by the scientific community since it is considered an essential indicator for both the evaluation of cow health status in different types of housing systems and the development of farming systems that make it possible to combine high production levels and animal welfare.
In literature, the most frequently analyzed behavioural activities of dairy cows are the following: ‘feeding’, which refers to the cow standing still in the feeding alley with the head in the feed barrier; ‘standing’, which describes the standing still in the alleys and the walking; ‘lying’, which is related to all the possible lying postures of the cow in the stall; and ‘perching’, which is associated to a standing still behaviour characterized by the cow hind limbs placed in the service alley and the cow forelimbs placed in the stall.
In some research studies the lying behaviour of dairy cows was analysed to determine its effect on the level of milk production and the foetal development during the pregnancy (Nishida, Hosoda, Matsuyama, & Ishida, 2004; Rulquin & Caudal, 1992). The daily incidence of lying and standing behaviours was also examined both to improve oestrus detection (Firk, Stamer, Junge, & Krieter, 2002) and perform early diagnosis of lameness (Pastell, Tiusanen, Hakojärvi, & Hänninen, 2009). The monitoring of feeding behaviour was carried out with the aim to both optimize intake under different feeding managements (DeVries, Von Keyserlingk, Weary, & Beauchemin, 2003b; Halachmi et al., 1998; O'Driscoll, Boyle, & Hanlon, 2009) and improve barn building characteristics in terms of layouts and building materials (DeVries & Von Keyserlingk, 2006; Fregonesi, Tucker, Weary, Flower, & Vittie, 2004; Fregonesi, Veira, Von Keyserlingk, & Weary, 2007).
Traditionally, dairy cow behaviour is assessed by skilled operators, such as veterinaries, who carry out the direct observation of the herd in field or inside animal houses. These operators also verify the adequacy of the breeding environment, which affects dairy cow behaviour, apply protocols to determine the
12
presence of diseases, and control production data. When information is gathered in situ the use of check lists is generally adopted to investigate animal behaviours.
However, studies based on the direct observation of animal behaviour could suffer from a common problem related to the presence of the observer, which may affect and thus modify animal behaviour. Moreover, the direct observation usually involves many hours of specialized operators’ work used for the visual recognition of behavioural activities and, if more than one operator carries out the detection work, it could be also subject to discordant interpretation.
Another technique involves the observation of animal behaviour by means of the visual analysis of digital images obtained from time-lapse video recordings. This technique allows the operator to perform a more adequate planning of the monitoring activities. Furthermore, video recording facilitates the collection of more frequent data over longer time periods and assures a safe and secure record for future analysis.
With regard to dairy cows, the visual recognition of cow behaviours from continuous recordings provides precise data about the time and the duration of the considered behaviour. This data can be used for carrying out statistical analyses and computing behavioural indices (Provolo & Riva, 2009), such as the cow lying index (CLI), the cow standing index (CSI), and the cow feeding index (CFI). The computation of these indices requires only the knowledge of cow behaviour whereas cow identification and tracking are needed when studying behavioural patterns and activities with the aim to perform an estimation of missed operations (e.g., milking), and to automatically observe individual animals.
Concerning large breeding environment, the visual recognition of cow behaviour in digital images coming from time-lapse video recordings can be carried out by using one or more cameras to frame all the functional areas where cow behaviours are likely to occur. Among the possible views of a barn that can be obtained from multi-camera systems, a panoramic top view of the barn is of crucial importance to detect animal positions within the barn as well as to obtain the real shape and dimensions of the body of the animals.
To obtain a panoramic top-view image of a large breeding environment, the careful design and installation of a multi-camera video-recording system is required. However, methods for the automatic detection of cows in panoramic top-view images acquired by means of multi-camera systems have not been applied yet.
The automation of both the visual recognition of cow behaviours in digital images and the individual cow identification may represent a suitable alternative to the traditional observation techniques adopted to investigate cow behaviours since it is comparatively less expensive and not invasive for animals. The design and the implementation of a computer-vision based system (CVBS) is recommended to automate cow behaviour detection and cow identification.
13
Though in literature several systems have been proposed in order to detect cow behaviour in digital images, few research work has been aimed at identifying each animal of the herd by using image processing techniques. Whereas, animal identification is generally obtained by using several sensors such as wireless pedometers, or collars equipped with RFID tags. The integration of these sensors within a CVBS implemented in order to detect animal behaviour would increase the overall cost of the recognition activity. Furthermore, even though the sensors themselves are apparently harmless, they may interfere with animal behaviour.
An inexpensive solution for the identification of animals is marking them with natural paints or hair dye. However, in literature this animal identification technique was not used within CVBS implemented in order to detect animal behaviour.
1.2 Objective of the study
On the basis of the issues arising from the preface, the overall objective of the thesis work is to put forward a method to develop a computer-vision based system (CVBS) for the automatic dairy cow identification and behaviour detection in free stall barns. Two different methodologies based on digital image processing are proposed in order to achieve cow behaviour detection and cow identification, respectively. Suitable algorithms among that used in computer vision science are chosen and adapted to the specific characteristics of the breeding environment under study. The method is applied to a case study, i.e., the detection of cow behavioural activities and the identification of each cow bred in a free-stall barn located in the municipality of Vittoria in the province of Ragusa.
The use of the proposed CVBS could avoid the interference in the cow behaviour due to the presence of the operator in the barn and could reduce the time-consuming operations needed to perform the visual examination of digital images in order to recognize cow behaviours and perform cow identification.
A sub-objective of the study is the design of a multi-camera video-recording system. The achievement of this aim is crucial in order to obtain sequences of panoramic top-view images coming from the multi-camera video-recording system. The panoramic top-view images make it possible to relate the position of the cow in the image with the real position of the cow in the barn. The achievement of these aims is relevant to verify if irregular behaviours occur, e.g., idle standing in the stall, perching, alternate occupancy of the stall, standing still for long time in an area of the barn, and lying in the alleys.
The overall objective of this thesis falls within the research boundaries of the precision livestock farming (PLF). Together with precision farming (PF), which has been assisting plant production for quite a long time, PLF has been developed more recently in the field of stock-breeding. PLF consists of monitoring, collecting and evaluation of data acquired by on-going processes related to the animals, modelling these data to select useful information, and then
14
applying these models in real-time for monitoring and control purposes. Collection of data from animals and their environment, by innovative techniques, is followed by evaluation of the data by using knowledge-based computer models. Currently, considerable PLF research is directed toward the development and the validation of various techniques for data measuring and registration in livestock farms (monitoring feeding times, feed intake, and performance parameters, real-time analysis of sounds and images, live weight assessment, body condition scoring, etc.). The final aim of PLF is to achieve information on the main parameters of animal health, animal behaviour and animal performance on a continuous basis. As farmer routinely gather visual, auditory, and olfactory information from their animals to evaluate health, welfare and productivity, new technologies can be useful to perform this task, even with large herds, thanks to the evolution in sensors and sensing techniques (Frost et al., 1997). The advantage of these monitoring systems is that much information can be automatically collected without the stress of animal disturbance or handling (Provolo & Riva, 2009).
1.3 Work organization
The second section of this thesis contains a review of the methods used to observe animal behaviour. A number of research works are described in order to highlight the methods used to achieve the animal behaviour detection and animal identification. Both traditional methods and those based on the automated image analysis are described.
The third section of this thesis describes the materials and methods of the research. In detail, it describes the method proposed for the design of a multi-camera system that makes it possible to obtain a panoramic top-view image of large breeding environments; it gives a comprehensive look at the image processing algorithm used in the two methodologies proposed in order to achieve cow behaviour detection and cow identification, respectively. This section of the thesis, illustrates also the case study. In detail, a description of the free-stall barn is provided as well as the materials and methods used to develop the multi-camera system and the two methodologies.
The fourth and the fifth sections of this thesis describe the results of the application of the two methodologies to the case study. The potential applications of the CVBS are illustrated as well as its further improvements.
15
2
S
TATE OF THE ART2.1 The observation of animal behaviour
The study of animal behaviour is based on the consideration that animals do not behave randomly. A species of animal that lives in natural environmental conditions is able to express behavioural activities that can be considered as “normal”, i.e., characterized by movements highly coordinated in both time and space. The sequences of these movements can be patterned. Each pattern is characterized by the fact that the shape of animal body does not vary and that the time intervals, at which the specific sequence of movements is expressed, are constant. These patterned sequences of movements are the fundamental units in the study of animal behaviour and they can be measured just as surely as other physiological parameters, e.g., weight, length, and height.
Some people erroneously refer to behavioural observations as subjective, contrasting them with physiological measurements that are said to be objective. What distinguishes behaviour and physiology for some people, however, is that they believe that behavioural measurements are less reliable than physiological ones, e.g., it is less easy for two people to agree what, say, an aggressive behaviour is than what a level of a given hormone is. The variability of behaviour, both between individuals of the same species and also within the same individual at different times is often thought to make it difficult to come up with reliable, repeatable measures that can be used in the same way by different observers (Rushen, 1991).
Whatever the truth of those arguments, the fact remains that the reliability of both behavioural and physiological measures needs to be checked or validated from time to time. This is particularly true when more than one observer is engaged in a single study, but it also applies when there is just one observer whose criteria for different behaviours may slip as a study proceeds.
The precise and detailed list of all the observed behaviour patterns of a species is known as the “ethogram”. A period of unstructured observations that allow for a systematic data collection should be used in order to build an ethogram. Furthermore, reading what has been already published on the specific animal species under study may also help the construction of the ethogram. Each behavioural pattern of the ethogram should be clearly defined by means of drawings, photographs and video. Whether observations are recorded on paper or video, electronic support, or other means of recording, each observation should be labelled by date, time, location, and other details that are important such as weather information, total number of animals visible, etc. If paper is used, a waterproof notebook, or data sheets on a clipboard are useful and it often helps to print out maps and sheets with slots for all the information to be recorded
16
beforehand in order to avoid missing something. If video is used, it is still necessary to record on paper the details of when and where the video recordings are being made. By keeping good records of any actions that were done, including departures from the planned protocol is an essential part of good research.
The use of the appropriate tools for defining the ethogram should allow the sharing of the observations among other people in order to explain the outcomes of a specific research. Moreover, it should be useful to train other observers who may be assisting the researcher in the phase of data collection.
There are several kinds of questions that can be asked about animal behaviour and there are several ways in which observation can contribute to all of them. The right question determines both the kind of data to collect, for example data collected over the whole lifetime of the animals or at just selected moments in time, and the type of information to be recorded, how often, how long for, and how many animals to watch to get valid results. It will determine the required equipments, whether any breaks of the observations are periodically required, or otherwise whether continuous observations are needed. It will determine whether it is important to know the investigated animals as individuals or can treat them as herd.
2.1.1 The selective observation
To study a specific behaviour of a single animal the following activities should be required:
- to record each behavioural pattern, e.g., the movements of its head, body, and limbs;
- to record the behavioural patterns of all the other animals around it; - to record where the animal is in relation to other animals;
- to record where the animal is in relation to the building characteristics of the breeding environment:
- to record which animals are interacting with it.
Since the development of the above mentioned activities is not possible to be achieved in practice for all the possible behaviours, a selective observation is required. In detail, it is important to define:
- the behavioural patterns to be recorded;
- the suitable length of time to spend observing the animal in relation to the chosen behavioural patterns, i.e. from seconds to weeks or years;
- the appropriate observation level, i.e. from an individual to the whole herd; - the suitable sampling regime, i.e. what, for how long, and how often you
record.
When making certain hypotheses, these should be first validated by considering the suitable selection of behavioural patterns, e.g., lying, feeding,
17
standing. Even if observations are made by using video-recordings, videos should be watched or analyzed with some hypotheses in mind. It is not the amount of data derived from the results of automatic recording devices that makes the behavioural analysis exhaustive, but databases still have to be interrogated on the basis of selected and defined hypotheses since they can only provide answers to specific questions. For example, lying and standing behaviours should be analyzed if a hypothesis predicts that a particular species of animal is more likely to sit down in cool weather than in hotter weather whereas other behaviours could be discarded, e.g., grooming itself or plying with other animals, in order to test this hypothesis.
The choice of observing individual animal behaviour or collective behaviour of the whole group of animals, characterizes the levels of observation. In a broad sense, when individuals, through local interactions, do something together is defined as collective behaviour. Examples of this behaviour are the following: bird flocks or fish schools moving coherently in the same direction, ants feeding from the same food source, cockroaches aggregating under the same shelter, etc. (Sumpter, 2006).
To clarify the concept of level of observation, let suppose that the hypothesis to be tested predicts that animals should be found in larger groups rather than being isolated. To test this, it would be necessary to record the size of the groups to be observed, but it might not be necessary to record the behaviour of each individual animal. Conversely, if the hypothesis predicts that the animals would seek food far from the place where they were, it would be necessary to observe individually where each animal eats.
To identify animals individually, it could be done in two ways: to catch the animals before the beginning of the observations and mark them in some way, such as with wing tags, leg bands, or collars; to recognize them from characteristics that make many animals naturally individually distinct. Particular attention should be paid to the first way of identifying animals because even when the tags themselves are apparently harmless, they may interfere with animal behaviour. In fact, a series of experiments on zebras (Burley, 1988) showed that the coloured leg bands which were used to identify individual male zebra finches affected not only their attractiveness to females but also their success as fathers. The females seemed to confuse the red leg bands with the red beaks that males have naturally as a sexual signal.
After having performed the selection of behavioural patterns to be recorded (e.g., preening, feeding, standing, and lying) and levels of observation, there is the problem of how many different focal animals are needed and what sampling method to use.
As regards the problem of defining the number of animals to observe, if research involves behavioural activities that are very simple to observe, it is useful to consider all the animals in the group. If, instead, the study aims at analyzing
18
some specific behaviour, then it might be convenient to focus the attention to one animal at a time, which in this case takes the name of Focal animal sampling, whereas when the behaviour to be analyzed involves simultaneously more than one subject, can be observed a group of animals is to be observed and it is defined as Focal group sampling (Albertini et al., 2008; Martin & Bateson, 2007). For both methods of focal sampling it is required to record all the activities performed by the selected animals over a set period of time. On the data collected during the observation period, some summary statistic, such as the mean number of times the focal animal looked up, is extracted from the record and becomes one data point in a whole series of observations. Since the focal animal is taken as representative of that whole group, a particular care in deciding which of a group of animals is chosen to be the focus of the observations should be taken. To avoid invalidating the results, the focal animal is randomly chosen since choosing the cutest or the most active could bias the results.
As regards the problem of choosing the type of measurement, i.e., how much of what observed is actually recorded, the use of continuous recording provides precise information about when the considered behaviour starts and stops. This technique provides very good quality data, known as interval measurements (Siegel & Castellan Jr., 1988), and can be used for all sorts of statistical analyses. If the animal behaves relatively slowly, as cattle tend to, it will probably be possible to carry out direct observation, by noting the times of any change in behaviour, but if the animal keeps changing behaviour rapidly, this may not be possible or track of the animal may be lost in the effort to write everything down. Therefore, video-recordings are a more simple way of obtaining information about the durations of behaviours but the additional support of a notebook and a stopwatch is still advisable.
The type of measurement called “zero/one” or “yes-no” sampling is used when a continuous record is not, in fact, absolutely necessary to reach the objectives of a research, and it may be sufficient to record less about each behaviour in order to test a hypothesis as effectively as with continuous recording. Video-recording just whether or not the behaviour occurred at all during a predetermined time period might be enough to some purposes. This type of measurement makes it much easier to write down what it is observed or recorded from a video and allows keeping up with the animal’s behaviour in real-time. In particular, the focal animal is observed for the same amount of time as for continuous sampling, but only information related to whether an animal did a behavioural activity, is written down. This is defined as categorical measurements (Siegel & Castellan Jr., 1988) which are absolutely valid but can only be used in certain types of statistical tests.
A third category of measurements, very commonly used in behavioural research, constitute a compromise between the interval measurements, which provide data with a high completeness, and the categorical measurements, which give more sparse data. This kind of measurements, called ordered or ranked
19
measurements (Siegel & Castellan Jr., 1988), can be very useful when an animal does more of something than another, but not possible to say exactly how much more. Therefore, instead of trying to record all the individual behaviour patterns, the behaviour could simply be divided into categories. Ordered or rank measurements have to be analysed with non-parametric statistical tests, which are very easy to carry out and make few assumptions about the data.
When it is not possible to watch all animals continuously, but to watch all of them for some of the time, Scan sampling is used. This method of recording behaviour and is the easiest and quickest to do. Usually it is carried out by doing a quick scan of the whole group of animals, which would provide a snapshot of what animals were all doing at one moment in time, and, sometime later, another scan is done in order to capture another frozen moment in time. The elapsed time between two snapshot should be small to allow a realistic estimate of the percentage of time that the animals used in the various activities, but reducing as much as possible the amount of energy for observation (Mitlohner, Morrow-Tesch, Wilson, Dailey, & Mcglone, 2001).
When it is not possible to make the systematic observations ideally required by the research aims, other methods of sampling could be used. Behaviour sampling is used if the behaviour at all is observed and recorded and ad libitum sampling is used if anything the animal is doing at all is observed and recorded (Altmann, 1974). Both methods are particularly suitable for rare behaviour or rare species.
2.1.2 Some open issues on animal behaviour observation
Studies based on the observation of animal behaviour could suffer from a common problem related to the fact that the animals may be observing the observer, and they may be afraid of observer and run away, or they may be so interested in observer that they spend all their time investigating him, like dairy cattle often do. This problem could be solved by using a multi-camera video recording system (DeVries, Von Keyserlingk, & Weary, 2004; DeVries et al., 2003b; Kaihilahti, Suokannas, & Raussi, 2007; Mattachini, Riva, & Provolo, 2011; Overton, Sischo, Temple, & Moore, 2002; Provolo & Riva, 2009).
Another issue regards the localization of the animal, i.e. where the specific animal behaviour occurs. Tracking devices based, for instance, on radio frequency or GPS, could be used to collect huge amounts of data. A basic technique of recording where animals are with respect to their environment is to make a number of photocopies of the map of the area the animals are occupying and use one copy for each scan sample, noting the positions of animals or groups on each scan in relation to specific previously defined landmarks. Since the recording of the animal positions in each scan is a burdensome activity, it is possible to subset the map into areas and to count the numbers of animals in each of them.
Another quick and coarse but useful method of recording the location of animals with respect to each other, is to select a focal animal and then count the
20
number of animals within one, two, or more body lengths of it. The main advantage of using the animal’s own body length rather than real measurements is that the distance between animals can be measured, regardless of their actual distance from the observer. Moreover, there are no parallax problems since though the animals will appear to be smaller when they are further away, a body length will also be correspondingly smaller too. Also in video-recordings analysis this suggestion could be useful, because effects of camera distortion or the size of animals in different parts of the screen could be not considered if the apparent body length of the animal in the considered area of the screen was used.
Another issue regards the choice of the most appropriate system to record the data, e.g., a notebook and stopwatch, a small portable computer, or a video-camera.
Since a safe and secure record for future analysis is obtained, there are sometimes clear advantages in using a video-camera system and there are now various software packages available to extract information. These include Observer XT (Schmied, Waiblinger, Scharl, Leisch, & Boivin, 2008) and Jwatcher (Blumstein & Janice, 2007). Nevertheless, while there are some projects where video or other automatic recording is essential, i.e. day long observations that cannot be recorded directly, direct observation should also be considered as the simplest of recording methods which may have advantages in some situations. On the other hand, technology is also opening up new possibilities in the field of animal behaviour observation and recording methods.
2.2 Observation of dairy cow behaviour
2.2.1 Traditional methods
2.2.1.1 Check lists compiled in field
From the literature it came out that often dairy cow behaviour is assessed by skilled operators and veterinaries who carry out the direct observation of the herd in field or animal house in order to compile check lists suitable to verify the adequacy of the breeding environment, apply protocols to determine the presence of diseases (e.g., lameness), control data production and dairy cow health status. Often, daily scan sampling intervals of a few hours are applied.
The direct observation of the herd was used in a number of studies in order to assess dairy cow behaviour and welfare.
In 2001, two experiments were conducted to detect differences in animal responses between strawyard and cubicle systems (Fregonesi & Leaver, 2001). The welfare of the lactating dairy cows was assessed by means of behaviour, performance and health indicators. The direct observation of the herd was used in order to obtain the data for the computation of the indicators. In detail, measurements were made by a team of operators that, through direct observation of herd activities in the barn, recorded the investigated behaviours (i.e., lying
21
down, ruminating on bed, and standing on passage and feeding) by using check lists. In the first trial the herd was observed for two weeks and, for each day, data were recorded by using 5-minute scan sampling techniques. In the second trial the herd was observed for four weeks and data were recorder by using the same scan sample. The activity related to direct observation involved the drawing up of 4032 and 8064 check-lists in the first and in the second trial respectively.
Check lists were also used to estimate the detrimental effects of lameness on calving-to-conception interval and hazard of dying or being culled in lactating Holstein cows (Bicalho, Vokey, & Guard, 2007). Trained veterinarians assigned a visual locomotion score (VLS) to 1799 lactating dairy cows present in 5 dairy farms. The VLS could take a 5-point scale ranging from 1 = normal, 2 = presence of a slightly asymmetric gait, 3 = the cow clearly favored 1 or more limbs (moderately lame), 4 = severely lame, to 5 = extremely lame (nonweight-bearing lame). The VLS was done every 14 days, and each cow received at least 2 scores and a maximum of 7 scores.
Firstly, the observers entered the cow identification number and the assigned VLS into a digital voice recorder and subsequently the data were entered in a spreadsheet. Successive analysis demonstrated a significant increase in days from calving to conception for cows detected as lame when compared with those considered nonlame during the first 70 days in milk (DIM).
2.2.1.2 Analysis of digital images from time‐lapse video recordings
The analysis of digital images from time-lapse video-recordings represents an effective tool for studying livestock behaviours in different environmental conditions. It is relatively cheap, non-invasive and facilitates the collection of more frequent data over longer time periods (Cangar et al., 2008). In this section a review of the most relevant research on the analysis of dairy cow behaviour by analyzing digital images was carried out.
Time-lapse video recordings were used to document dairy cow behavioural patterns, examine factors affecting lying behaviour, and develop guidelines for visual assessment of free-stall usage during summer conditions in a high producing dairy (Overton et al., 2002). The Authors used a multi-camera video-recordings system constituted of four video cameras placed in a free-stall pen containing 144 stalls and 129 high producing cows. The four cameras were placed about 5 m above the pen floor to allow more complete visualization of the pen. The video recordings were recorded over a 6-day period in July 1999. Operators carried out the visual interpretation of the video recordings. In detail, each daily video recording was reviewed using 60-minute scan sampling techniques, so cows were counted as lying, standing in alley without eating, standing in free-stalls, or eating in each of the four sections of the pen. As a result, 19 hourly observations were recorded for each day of the study. Therefore, the activity related to direct observation of video recordings involved the visual interpretation of 456 frames.
22
The analysis of video recordings was also used to validate the data generated by GrowSafe, an electronic system designed to allow for passive monitoring of feeding behaviour of individual cows housed in a free-stall barn (DeVries et al., 2003b). Two groups of six lactating cows were monitored for 24 hours using both the GrowSafe system and time-lapse video recordings. The cows were housed in two different adjacent pens in a free-stall. One video camera was positioned approximately 6 m above the feeding alley of each experimental pen. The output from the cameras was recorded with a time-lapse video recorder and a digital video multiplexer. Cows were individually identified with symbols on both sides of their body using hair dye. Also in this experimental trial, operators carried out the visual recognition of the cows within the video-recordings. In detail, raw data were summarized for each cow and for each minute of the day. Therefore 2880 video recordings were analyzed.
Another original study (DeVries et al., 2004) made use of digital image coming from video recordings with the aim to determine whether doubling the amount of feeding space from 0.5 to 1.0 m per cow leads to increased spacing between cows at the feeder, fewer aggressive social interactions among cows, and ultimately increased feeding activity. Two adjacent pens, each having a total of 6 m of accessible feeding alley space, were observed by using a video recording system. In detail, the animals were videotaped using one video camera per pen, a time-lapse videocassette recorder, and a video multiplexer. The video cameras were located 6 m above the feeding alley, and red lights were used to facilitate recording at night. Within the two 90-minute post feeding periods, an operator labelled the inter-cow distances and the number of animals present at the feeding alley by using a 5-minute scan sampling. During the two post feeding periods, four groups of cows of 6 cows each were observed for 7 days. Therefore a total amount of 1008 frames were analyzed by the operator.
The effects of two different feed barrier systems on feeding and social behaviour of dairy cows were assessed by analysing digital images coming from video recordings (Endres, DeVries, Von Keyserlingk, & Weary, 2005). Forty-eight cows were housed in 4 pens in a free-stall barn. Feeding and social behaviour data were collected using one video camera per pen, a time-lapse videocassette recorder, and a video multiplexer. The video cameras were located at 6 m above the feed bunk of each pen. Red lights, hung adjacent to the cameras, were used to facilitate recording at night. An operator observed the analyzed cow behaviour from continuous 24-hours video recordings by using 10-minute scan sampling. The number of displacements from the feed bunk per day were collected by continuous observation of 24-hours videos for the last 3 days of recording (6 days data collection) for each treatment condition (treatment of 4 groups of cows). Therefore a total amount of 1728 frames were analyzed by the operator.
Another research (Munksgaard, Jensen, Pedersen, Hansen, & Matthews, 2005) quantified the relative priorities between lying, eating and social behaviour
23
of dairy cows in different stages of lactation by analyzing cow responses to time constraints in two experiments. In the first experiment, the behaviour of individual cows was recorded on videotapes (time lapse, two frames per second) on three days of the treatment, when cows were in their resource pen. In the second experiment, the behaviour of individual cows was recorded on videotapes for 24 hours a day on the last four days of the experimental period. For both the experiments, an operator quantified the behaviour of all animals. The position of the head of the animal was used to assess position in the pen. Activity of the animal was classified as eating (the animal has food in the mouth and/or chews when standing in front of the feed trough), lying (body resting on floor or mattress) and other patterns (performing a behaviour other than eating or lying). Whenever a cow changed position or started doing a new activity, the time was recorded; thus both frequency and duration could be calculated. Interruptions of less than 60 s were not recorded.
The qualitative assessment of dairy cows’ social behaviour on farm was assessed with regard to its inter-and intra-observer reliability and its correlation to quantitative ethogram-based assessment (Rousing & Wemelsfelder, 2006). Five farms were object of the experimental trials. The social interaction of cows around a drinker was recorded with a digital camera. The camera was mounted on a pole out of cow reach to ensure undisturbed recording of social activities. Recording took place on three successive days for 2-3 hours in the morning, starting approximately 1 hour after the morning feeding, and 2-3 hours in the afternoon before and after afternoon milking. From this video footage, 25 clips of approximately 1 minute duration were selected. This selection was designed to be a representative sample of the variation of social interactions observed at the drinkers on the different farms, including agonistic and non-agonistic interactions. The 25 video clips included 25 social events of a total of 66 cows: 14 video clips of two cows, eight video clips of three cows, two video clips of four cows and one video clip of six cows. These 25 clips were then edited on to two VHS tapes at a professional studio. Qualitative assessment of these video tapes was provided by 12 observers, five of whom were researchers of animal science, five were Ph.D. students of animal science, and two were stockmen familiar with daily routines in dairy herds. All observers had practical experience in handling cows and observing cow behaviour. These observers were gathered at the start of the study, and given detailed instructions about free choice profiling experimental procedures. Observers were divided into two groups, with each group seated in front of a wide screen TV monitor to watch the recorded video tapes. A week later this procedure was repeated by showing observers the same 25 video clips in reversed order on Tape 2. Observers were informed that the clips were the same, to avoid speculation and to encourage them to get on with the task at hand.
Carreira et. al. 2009 (Carreira, Fernández, & Mariño, 2009) estimated the variation of stall occupancy by means of an apposite indicator. Three farms were object of the experimental trials. On each farm, cow behaviour and stall use were
24
time-lapse recorded uninterruptedly for 24 h by using a video camera connected to a timer that recorded at preset time intervals. Individual 17-second intervals were recorded, followed by a disconnection time of 3 min and 30 s. By using this system, 380 observations were recorded over 24 h. The recordings were simultaneous in every three farms and were made during winter months. To analyze stall occupancy, the number of observations in which stalls were occupied (over the 380 observations) was quantified.
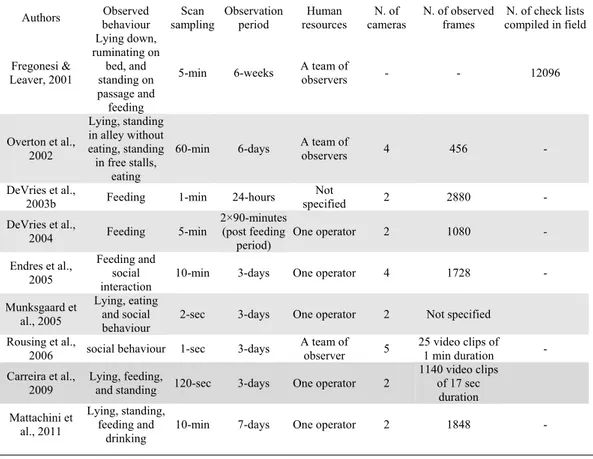
In a recent study (Mattachini et al., 2011) the values of different behavioural indices at different scan-sampling frequencies were compared in order to evaluate the different methods of data aggregation that are used to obtain daily behavioural indices. The lying, standing, feeding and drinking behaviours of 69 cows in a free-stall barn were recorded over 7 days using continuous video recording. Two black-and-white closed-circuit video cameras were installed in the barn. The two cameras were placed about 5 m above the pen floor to allow for the complete visualization of the pen. A 7 day video sequence pattern over a long-term (one year) recording period was used. An operator carried out the visual analysis of the video recordings and counted the number of dairy cows occupied in different behavioural activities (i.e., eating, lying, and standing). Standing was considered to be an upright posture (i.e., motionless or walking), while the lying category included only cows that were observed in total lateral or sternal
Table 1 - Review of the most relevant research on the analysis of dairy cow behaviour by
analyzing digital images
Authors behaviour Observed sampling Scan Observation period resources Human cameras N. of N. of observed frames compiled in field N. of check lists
Fregonesi & Leaver, 2001 Lying down, ruminating on bed, and standing on passage and feeding
5-min 6-weeks A team of observers - - 12096
Overton et al., 2002 Lying, standing in alley without eating, standing in free stalls, eating
60-min 6-days A team of observers 4 456 -
DeVries et al.,
2003b Feeding 1-min 24-hours
Not specified 2 2880 - DeVries et al., 2004 Feeding 5-min 2×90-minutes (post feeding period) One operator 2 1080 - Endres et al., 2005 Feeding and social
interaction 10-min 3-days One operator 4 1728 -
Munksgaard et al., 2005
Lying, eating and social behaviour
2-sec 3-days One operator 2 Not specified
Rousing et al.,
2006 social behaviour 1-sec 3-days A team of observer 5 25 video clips of 1 min duration -
Carreira et al., 2009
Lying, feeding,
and standing 120-sec 3-days One operator 2
1140 video clips of 17 sec duration Mattachini et al., 2011 Lying, standing, feeding and drinking
25
recumbency within the confines of a stall. Eating was defined as actively ingesting feed or water, or standing within 0.6 m of the feed bunk and oriented toward the feed. Behavioural activities were analysed at different scan intervals of 10, 20, 30, 60 and 120 min. The entire video observation period covered 154 hourly time periods and, therefore 1848 frames were examined.
2.2.2 Automated image analysis-based methods
Since the visual recognition of cow behaviour is generally time consuming and, if more than one operator carries out the detection work, it could be also subject to discordant interpretation (Müller & Schrader, 2003), a number of studies proposed different methods to automate image analysis of animals in their breeding environment.
In 2008 a study was carried out in order to develop a fully automatic image analysis system to identify some locomotion and posture behaviours of cows prior to calving in a continuous and automated way (Cangar et al., 2008). In the research, eight individual cows representing a range of calving events from normal to difficult were selected for analysis. In order to identify posture and locomotion behaviour patterns, five individual pens with a straw-bedded surface of 4.6 m × 3.3 m were instrumented with cameras and recording equipment. Two cameras were used on each pen. The first one was an overhead camera which generated a top view of the animal. The images were used to develop the automatic real-time posture and locomotion monitoring tool based on an active shape model (Cootes, Taylor, Cooper, & Graham, 1995). The second one was a side view camera which generated a side view of the animal as seen by the stockperson. These video surveillances were used for visual interpretation on a computer screen by ethologists. The top view camera was placed 5-m high, above the centre of each pen. A group of operators observed the side views generate by the five side view cameras. These views were used for visual interpretation on a computer screen by ethologists. They labelled the images of cows approaching parturition at 10-second intervals over the last 24 hours prior to calving. Particular behaviours such as position in pen, orientation, lying or standing, type of lying, eating or drinking and calving details were recorded. However the above experiments were done in pig chambers in a research laboratory. In commercial livestock houses, image analysis for behaviour classification becomes more complicated.
A number of studies were carried out in order to detect lameness in dairy cows. A first study was carried out in 2008 with the aim to build an automatic system for continuous on-farm detection and prediction of lameness in the farm by using vision techniques (Song et al., 2008). This research proved that vision techniques have great potential to be used for continuous quantification of lameness in cows.A digital camera was fixed on a tripod 6 m far from the side of a corridor to record on video the entire body of each cow and its movement. The locomotion of all the 15 cows was scored by four trained observers. They scored cows individually as cows passed through the alley during the image acquisition.
26
Side-view images were recorded when cows passed an experimental set-up freely. Digital image processing such as background subtraction, binary image operations, calibration and hoof separation, were executed to obtain the trackway information containing hoof location. The accuracy of automatically captured results was checked by comparing with the output from manually labeled hoof locations. The above experiments were done in a research farm.
A further study (Poursaberi, Bahr, Pluk, Van Nuffel, & Berckmans, 2010) aimed at developing an automatic real-time algorithm suitable to on farm detection of lameness in dairy cattle. In particular, back posture analysis as a potential variable for lameness detection was investigated. Video-recordings data of 28 lactating Holstein cows were acquired on farm by a camera located 1.5 m high above the ground, centred and 8 m away from a concrete corridor (1.2-m wide and 6-m long) which takes from the barn to the pasture ground. The video-recordings were taken during the scoring procedure carried out by several observers. Scores were given when one or more of the following “lameness indicators” derived from literature were observed: tenderness, arched back, reduced speed, irregular gait in time or place, reduced tracking up, increased abduction and head bobbing. Observers gave score “1” when the cow did not show any of the ‘lameness indicators’, score “2” when the presence of one “lameness indicator” was observed, and score “3” when a severe “lameness indicator” or multiple “lameness indicators” were found.
Finally, a recent research (Pluk et al., 2012) described a synchronized measurement system, useful for lameness detection in dairy cattle, which combines image and pressure data to automatically record the angle of the metacarpus and metatarsus bones of the cow with respect to a vertical line.
A pressure-sensitive mat, having an active surface 0.61 m wide and 4.88 m long, was used to record the timing and position of hoof placement and release of each cow. The video-recordings were acquired by a camera installed at 2.5 m above the ground and at a distance of 3.5 m from the pressure mat which made it possible to cover the whole measurement area. The pressure mat data and the camera images were synchronized by using the timing information, stored in text files. The camera image, together with the position information, allowed automatic computation of the touch angle by using image processing.
A trained observer visually scored locomotion of the cows from the video-recordings. In two weeks of experiments carried out in September and October 2009, 400 measurements were considered. In the group analysis, the kinematic data of the sound cows were compared with the data from the groups of cows with a higher degree of lameness to assess differences in gait.
2.3 ICT applications for animal localization and identification
The research works reported in the previous section allowed cow localization in the breeding environment by using vision techniques. The
27
identification, or more specifically automatic or machine-readable identification, is the key to the realization of effective precision livestock farming (Banhazi et al., 2012). The identification of the cow within the herd besides allowing the tracking of the animal, which is useful to study particular behavioural activities of the animal individually in comparison to those of the whole herd, may be utilized when the isolation of individual animals is required due to the risk of infections or the welfare of each animal have to be assessed taking into account the time spent in a number of specific behaviours.
Usually in outdoor the position of animals on wild animal habitats is obtained by developing systems based on the GPS technology, e.g. GPS-collar receivers (Barbari et al., 2006). This technology allows location data with a precision of about 1 m but it is not feasible for indoor applications.
The increasing improvement of wireless technologies has favoured the development of automated localization systems utilized to detect and track motion of animals inside farm buildings. A number of studies proposed different methods to automate identification of animals in their indoor breeding environment.
In 2007 a study (Gygaxa, Neisen, & Bollhalder, 2007) was carried out in order to set-up a local position measurement system based on radar technology to be used to track cows and analyze how they use the different areas of the barn. In addition, authors tested the system suitability for monitoring and quantifying social interactions. A data set of measurements at fixed positions and on dynamic circular showed that estimates of the location of a transponder were obtained with an error within 0.5 m. To validate the automatic positioning system was used to identify dairy cows at the feed rack. Data recorded by the LPM were compared to those collected by operator’s works which identified the dairy cows inside digital images of the feed rack acquired for 9 hours with a sample rate of 10 min. Results of comparison showed that animal positioning can reliably be obtained with a precision of about 0.5 m.
Another research (Huhtala, Suhonen, Mäkelä, Hakojärvi, & Ahokas, 2007) aimed at developing an automatic tracking system based on WLAN suitable for cow tracking inside a building. The system was installed in a cowshed with a special section for 10 cows milked with a milking robot. The tags were installed first in the precise places to get accurate coordinates and subsequently, for the validation of the system, the tags were placed on top in a cow’s neckband and also on a cow’s back with a special band. Data recorded by the tracking system were compared to those collected by operator’s works which identified the dairy cows inside digital images provided by a web camera installed above the room. In undisturbed conditions (no moving cows, clear sights between antennas and tags, etc.) the result of the manufacturer’s analysis was 30% inside 65 cm, 70% inside 100 cm and 90% inside 200 cm. Instead when a tag was fastened on the cow and all the 10 cows were in the section, the results were not so good; especially when a cow was lying, the stability was very poor.
28
In 2009 a number of experiments (Simonini, 2009) conducted in different breeding environments have shown that active RFID systems based on the use of position markers can detect the presence of animals equipped with active tags within areas bounded by inductive loops. However, from these experiences, a number of disadvantages, mainly attributable to the cost of the position markers and the complexity of the installation of its inductive loop in the breeding environment, have emerged.
In a later search carried out in the 2011 (Porto et al., 2012) an automatic detection system (ADS) was developed. The ADS defined a configuration of an active RFID system alternative to that making use of position markers for the automatic detection of tags. The ADS was initially tested in the laboratory and then applied to a group of pigs housed in a pen consisting of a built and completely roofed resting area and an enclosed open-air area. Reference tags were properly placed in the pen and a specifically developed software was executed to elaborate RFID data. The work highlighted the possibility of using active RFID tags to detect the pigs resting in the indoor area, thus avoiding the cost of the position markers and the onerousness of the induction loops installation.
29
3
M
ATERIALS ANDM
ETHODSWith regards to the automatic detection of dairy cows housed in free-stall barns, the reliability of the image processing methods described in section 2.2.2 could be threatened by a number of conditions, i.e., clean and dirty straw bedding; dry and wet sand bedding; rubber mats; rubber flooring; slurry in the alleys; higher variability of floor brightness near the openings; and higher sunlight reflection of wet floors.
Therefore, the need to adapt the described methods and to assess the effectiveness of their results arises when coping with these specific conditions.
Another issue is the need to obtain a panoramic top-view image of the free-stall barn under study. This is crucial in order to detect animal positions within the barn as well as to obtain the real shape and dimensions of the body of the cows. To obtain such a panoramic top-view image, a careful design of a multi-camera video-recording system is required because of the large dimensions of the breeding environment to be monitored. A literature review revealed that methods for the detection of animals in panoramic top-view images acquired by means of multi-camera systems have not been yet applied to the field of precision livestock farming.
As a consequence of the above considerations, the present study puts forward a novel approach for the design of a computer vision-based system (CVBS) for:
- The automatic detection of a number of cow behavioural activities in free stall barns (objective 1);
- The automatic identification of dairy cows in free-stall barns (objective 2).
To acquire the images which are utilized in the CVBS, a method for the design of the multi-camera video-recording system is proposed and described in section 3.1.
Concerning the objective 1, a first methodology proposed in the present research aimed at detecting the following cow behavioural activities: feeding, lying, walking/standing still, and perching. With regard to some of these, more precise information is required for the comprehension of the proposed methodology. In this work, the behavioural activity feeding is referred, as in previous studies (DeVries, Von Keyserlingk, Weary, & Beauchemin, 2003a; Wilson, 2005), only to animal having its head through the feed barrier. The behavioural activity lying is referred to cow resting in the stall in one of its natural postures, i.e., long, short, narrow or wide.
The selection of these behavioural activities among all those possible is justified by the growing attention for their analysis as it is considered that their modifications, caused by social and physical problems as consequence of the breeding environment, could be associated with changes in the health status and
30
reproductive efficiency of dairy cows. Some studies analysed the permanence of dairy cows lying down in the stalls because it affects the level of milk production and the foetal development during the pregnancy (Nishida et al., 2004; Rulquin & Caudal, 1992). Other studies focused on the daily incidence of lying and standing behaviours for oestrus detection (Firk et al., 2002) and early diagnosis of lameness (Pastell et al., 2009). It has been observed (Galindo, Broom, & Jackson, 2000) that standing still and perching predispose cows to lameness. The detection of these behavioural activities along with the analysis of the walking posture (Maertens et al., 2011), could be applied to obtain an early diagnosis of lameness.
Other research focused on the monitoring and analysis of feeding behaviour with the aim to optimize intake under different feeding managements (DeVries et al., 2003b; Halachmi et al., 1998; O'Driscoll et al., 2009) and some other studies analyzed the influence of barn building characteristics on the social and feeding behaviour of dairy cows (DeVries & Von Keyserlingk, 2006; Fregonesi et al., 2004; Fregonesi et al., 2007).
With regard to the objective 1, in section 3.2 the main characteristics of the cow detection methodology, that includes an algorithm originally proposed by Viola and Jones (Viola & Jones, 2001, 2004) for the human face detection and applied only in few cases for the animal detection (Burghardt, 2004; Burghardt & Càlìc, 2006), is described. From literature, it resulted that the robustness of this algorithm could provide accurate classifications also when significant brightness and background variations occur in the sequence of the analyzed images.
Concerning the objective 2, an improvement of the CVBS functionalities was achieved by putting forward a second methodology for the identification and consequent positioning of each cow in the functional areas of the barn. Such improvement is required when:
- models of animal behaviours must be developed on the basis of continuous behavioural observations;
- the isolation of individual animals is required due to risk of infection; - the welfare of each animal have to be assessed taking into account the
time spent in a number of specific behaviours (Huhtala et al., 2007). Though several systems could be used for animal identification, e.g., RFID tags and position markers (Barbari, Conti, & Simonini, 2008) and wireless technology (Huhtala et al., 2007), their integration within the proposed CVBS is not recommended because of the increasing of the overall cost.
Therefore, section 3.3 describes the main characteristics of an identification methodology based on the contours extraction in digital images and the normalized product scalar method for contours matching.
31
3.1 The multi-camera video-recording system
Among the possible views obtainable from a video-recording system, those providing plan views of the barn are the most suitable for the recognition of the cow behavioural activities analysed in this study. In particular, plan views of the barn make it possible to distinguish each cow from the others and to determine the real position of each cow within the barn. These potentials are relevant to verify if irregular behaviours occur, e.g., idle standing in the stall, perching, alternate occupancy of the stall, standing still for long time in an area of the barn, and lying in the alleys.
To obtain a broad coverage of the barn from above, a multi-camera video-recording system has to be designed. This kind of system must provide synchronized and rectified camera images and also panoramic rectified top-view images of the barn. Both rectified plan views are needed to obtain real dimensions of cows, physical spaces, and equipments. This characteristic of rectified plan views allows the selection of homogeneous training samples to be used by the classifiers in terms of cow body proportions showed in the video recordings.
3.1.1 Computation of the number of cameras to be installed in the barn
The exact number of cameras must be established by following the steps described below:
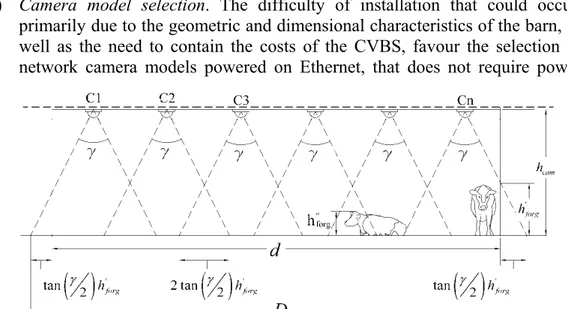
a) Direct metric survey to produce the plan and two or more sections of the barn. This phase is required to determine the installation height of the cameras above the floor of the barn (hcam) as well as the height above the
floor of the foreground plan (hforg) that is the height of the animal body,
measured at the withers, when it is standing (h’forg) or lying (h”forg) (Figure 1).
b) Camera model selection. The difficulty of installation that could occur, primarily due to the geometric and dimensional characteristics of the barn, as well as the need to contain the costs of the CVBS, favour the selection of network camera models powered on Ethernet, that does not require power
Figure 1 – A schematic representation of the section of the functional areas of barn to be
32
supply and prevent the barn from being subject to the installation of power cables. Moreover, the selected camera model has to be equipped with the hypertext transfer protocol (HTTP) based interface which provides the functionality suitable to request a single image (snapshot), to control camera functions and to get and set values of the camera parameters. The HTTP-based interface is required to obtain camera image synchronization, which will be described in the next section.
c) Camera image calibration. The images acquired from the cameras have to be subject to an image calibration process to remove lens radial distortion, which is the source of the ‘fish-eye’ or ‘barrel’ effect, and lens tangential distortion, produced by manufacturing defects consisting in lens not exactly parallel to the plane of the scene. For each camera, calibration is carried by using the Zhang’s calibration method (Z. Zhang, 2000) that requires the use of a planar chessboard to be placed on planes with different inclination in front of each camera to be calibrated. In details the method calculates for each camera the distortion matrix and the camera matrix which characterize the process of transformation between the filmed reality and the images generated by the camera. A set of equations are defined by matching the known Cartesian coordinates of square corners in a chessboard, with the corresponding coordinates of points automatically identified in a distorted image. The solution of the defined equation are collected to build the required distortion matrix and the camera matrix.
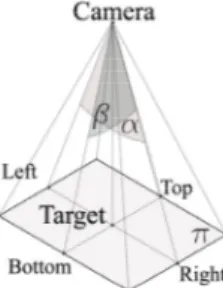
e) Evaluation of the maximum horizontal and the maximum vertical view angles after the calibration process. This phase is required to establish the exact dimensions of the viewable region (π) that will be acquired by the cameras. Camera view angles have been evaluated by means of laboratory tests. The horizontal view angle (α) is the angle defined by the midpoint of left edge of the viewable region, the camera location, and the midpoint of the right edge (Figure 2). Likewise, the vertical view angle (β) is the angle defined by the midpoint of the top edge, the camera location, and the midpoint of the bottom edge.
33
To monitor a rectangular plan area of length l and width w, the total number N of cameras to be installed in the direction of l, or in the direction of w, can be determined by computing the value of n as:
2 tan 2 cam forg d n h h (1)where d is equal to the length l or to the width w, γ is equal to the view angle α or to the view angle β. The number N is equal to the next whole integer of n. Once fixed the value of d, the selection of the γ value should minimize the number N.
The resulting length, or width, D of the rectangular plan area monitored by the N cameras computed by means of the equation (1) is greater than d. This makes it possible to obtain the rectified plan view of objects having height equal to hforg and located near the perimeter of the area.
3.1.2 Image synchronization and mosaicing
Video acquisition from the multi-camera system must be synchronized because the N camera images characterized by the same acquisition time must be used to compose a panoramic top-view image of the barn. If camera images are not synchronized among them the image matching of the cow activities in the overlapping region of two adjacent camera images would not be assured.
By making use of the HTTP based interface, an algorithm that allows for the synchronization of snapshots coming from the cameras must be designed and implemented in a software tool. Firstly the algorithm has to make an asynchronous request to each camera to download one snapshot, and then each camera web server returns the most up-to-date snapshot in JPEG format. The algorithm must wait until all the snapshots are available before making the subsequent request, and thus the accumulation of delay times in the video sequences is avoided.
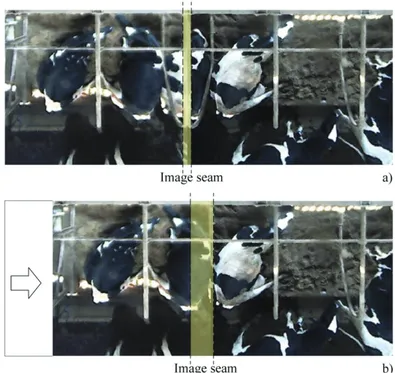
Image mosaicing refers to the combination of two or more camera images into a single composite one. This phase is required to detect cows which leave one camera scene and enter another one. In this way one single frame which will be the input of the algorithm used to detect cow behavioural activities is obtained, and the selection of the samples that will be used for the training of the classifiers is facilitated. Many algorithms today are able to take overlapping regions of camera scenes and autostitch them together to create a panoramic top-view image. However, such algorithms have to satisfy a number of requirements to obtain good results (Mills & Dudek, 2009): limited camera translations, limited lighting variation, similar exposure settings of camera images, and limited motion of objects in the scenes. Attempts have been made to autostitch images containing a number of moving objects with the objective of identifying and separating them, and assuring that they were fully included or excluded from the optimal image seam (Mills & Dudek, 2009). Yet results are not straight forwardly applicable.