The ability of the turnaround index to assess going
concern assumptions: evidence from its application
to Italian listed companies
Roberta Provasi*
Department of Business Administration, Finance, Management and Law, Milan-Bicocca University,
Via R. Bicocca degli Arcimboldi 8, 20126 Milan, Italy Email: [email protected]
*Corresponding author
Patrizia Riva
Department of Economics and Business Studies, Piemonte Orientale University,
Via Perrone 18, 28100 Novara, Italy Email: [email protected]
Abstract: In times of crisis, an entrepreneur often must decide whether to liquidate the company and the whole business or to renew it by activating a turnaround process. A tool increasingly used in international practice is the turnaround index, which can determine whether a company can continue its activities in the future according to the going concern assumption, which is the index measured as a function of the economic and financial performance of the company. This measure can take values between 0.1, for satisfactory performance and therefore unlikely to turn around, and 0.9, for unsatisfactory performance and therefore a high propensity to turnaround. The index determines whether there is a higher or lower risk for a company to enter into crisis. The aim of this paper is to test the effectiveness of the turnaround index in assessing the turnaround urgency by choosing a sample of the Italian companies.
Keywords: turnaround; going concern; turnaround urgency; crisis forecast; crisis assessment; insolvency; insolvency forecast models; company’s health; Z-score.
Reference to this paper should be made as follows: Provasi, R. and Riva, P. (2016) ‘The ability of the turnaround index to assess going concern assumptions: evidence from its application to Italian listed companies’, Global Business and Economics Review, Vol. 18, No. 1, pp.54–81.
Biographical notes: Roberta Provasi received her PhD in Business Administration from Pavia University. She is an Associate Professor of Business Administration and Accounting, Auditing and Corporate Governance at the Milan Bicocca University. Since 1992, she has been a registered chartered public accountant and auditor. Since 2005, has been a member of the scientific committee of graduate studies in business administration and coordinator of masters in business administration program. She has several publications mainly dealing with accounting and auditing issues.
Patrizia Riva holds a PhD in Business, Economics and Management from the Milan Bocconi University. She is an Associate Professor of Accounting, Auditing and Corporate Governance at the University of Eastern Piedmont. Since 1994, she has been registered as a chartered public accountant and auditor. Since 1999, she has been the Chief Executive of the High School of Certified Public Accountants Institute of Milan. She has several publications mainly dealing with accounting and auditing issues.
This paper is a revised and expanded version of a paper entitled ‘The turnaround index’ presented at 24th B&Esi Conference, Florence, 7 July 2014.
1 Introduction
The aim of the research is to examine the methods for evaluations linked to the going concern principle, which is the assumption on which financial statement preparation is based: a company is considered able to continue and to conduct its business activity in the foreseeable future without the need to liquidate, to cease activity, or become subject to insolvency proceedings. The increasing attention given to the issue of going concern has increased the importance of crisis forecast and assessment of the state of a company’s health and has therefore increased the development of several models to verify more accurately the long-term ability of companies to maintain activity over time. Identification of a declining situation in the short term or at least maintaining control of the company’s health is essential as it helps to prevent the spread of crisis, to increase the success probability of the turnaround processes, to stop value loss. The research presents an empirical analysis conducted in the Italian context to assess the effectiveness of the turnaround processes adopted by the analysed companies using two different approaches: the Z-score model and a second model known as the turnaround index, which allows the use of a function that is able to assign a score based on the company’s health condition.
The dependent variables of the function are financial statement indicators, and the coefficients of each variable, or more clearly, the incidence to be assigned to each indicator, were determined using statistical software based on logistic regression to measure the correlation between the selected ratios calculated for a sample of companies and their turnaround urgency or health conditions. The sample is companies from Milan all share index, which excludes companies in the financial and insurance services industries. Turnaround urgency has been deduced from the independent auditor opinion expressed in relation to the company’s going concern. The authors identified four companies that in recent years have had going concern difficulties to test the efficacy of the turnaround index by comparing it with the one produced by the Z-score method. The analysis further considers two companies that seem to have overcome their crisis situation (Pininfarina Group and Bioera Group), and two other companies that still declare that they are facing it (Bialetti Group and Stefanel Group). Registered results seem to be consistent.
2 Going concern assessment methods: relevant research
Over time, the methods used to support the assessment of the going concern assumption have become more complex, accurate and appropriate (McGough, 1974). The first insolvency forecast models were designed after the great depression of 1929. In previous years, banks granted loans without adequately considering the customer’s reliability and capability to refund the loan. The depression experience helped in the creation of the perception of a new information need, so that models started to be conceived to identify the signs of a business crisis. The tools developed were based on analysis of financial statements and the use of mathematical and statistical techniques (Holmen, 1988). As analysing the trends of the calculated indices presented a high subjectivity level and required specific skills for those who were asked to implement the analysis, the introduction of statistics therefore became important. This was considered relevant to reduce the subjectivity of such assessments (Balcaen and Ooghe, 2006).
A first distinction between different assessment models can be made distinguishing the theoretical from the empirical model (Madonna and Cestari, 2010).
Theoretical models, based on a deductive approach, require only the formulation of some hypotheses and the use of algorithms to calculate the insolvency probability. These models, however, were not commonly used as they produced unreliable results when used to identify corporate crisis symptoms.
Empirical methods, based instead on an inductive approach, requires users to follow some relevant steps to calculate them:
a select a sample of existing firms
b analyse the situation of the selected companies c conceive a model for the analysed companies
d generalise the model so that it can be applied to other existing businesses.
The first two steps had to be performed in the financial statement analysis, and the last two, which represent the generalisation process, required the use of mathematical and statistical techniques.
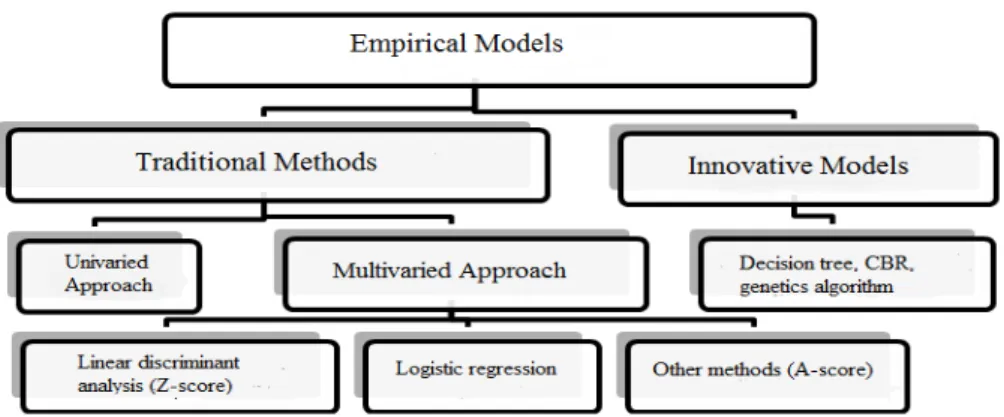
Figure 1 Empirical models to assess going concern: a framework
Previous research has classified the empirical methods (Madonna and Cestari, 2010; Teodori, 1989) as shown in Figure 1, which gives a useful framework used in our analysis.
2.1 Traditional empirical methods
The proposed framework considers two traditional approaches: univaried and multivaried (Teodori, 1989).
The univaried approach, as applied to going concern assessments, consists of the analysis of the various indexes separately with the aim of identifying which among the others better describes whether a company can continue its activity. An early important study in the 1960s analysed the prediction capability of some indicators regarding insolvency phenomena (Beaver, 1966, 1968). In particular, this method has been used with a sample of companies that insolvent or in broader terms, facing difficulty in repaying their debts. In addition, this method has been considered for use with companies defined as healthy. Comparisons between the two classes of companies has revealed a systematic difference among the index’s average of healthy companies vs. insolvent ones. The analysis was conducted using a dichotomous classification test to identify an optimal separation point or a cut-off for the indexes with the aim of reducing classification errors. The author concluded that the best predictive index was, among six others, the ratio of cash flow:total debt. The main limit of the model was recognised as its ability to consider the various indexes one by one its inability to determine relations among them (Cestari, 2009; Teodori, 1989).
The multivaried approach as applied to going concern assessment requires, on the contrary, simultaneous consideration of the various companies’ aspects (Andrew, 1986; Marco and Varetto, 1994; Teodori, 1989).
The main methods of this approach are:
a The linear discriminant analysis (and therefore the Z-score model) and the logistic regression represent the first group of studies used in the definition. The Z-score model is based on linear discriminant analysis (Altman, 1968). This approach (a kind of multivaried analysis) was first introduced by Fischer with the aim of classifying an object in two or more populations that have their own characteristics, considering specific variables to build the taxonomy (Fischer, 1936). The Z-score model is a linear model built using on one hand a sample of companies bankrupt between 1945 and 1965 and on the other hand a sample of companies considered healthy
relative to going concern situations. The two groups of companies present similar characteristics in terms of size, sector and referring period. The result of the research was the construction of an insolvency forecast model that involved the use of five variables represented by five financial statement indices. The set of indices was chosen considering their incidence level defined as their capacity when considered together to describe the company situation more accurately. The model resulted in the following equation:
1 2 3 4 5
1.2 1.4 3.3 0.6 1.0
Z = X + X + X + X + X (1)
where X1 = working capital/asset, X2 = retained earnings/assets, X3 = EBIT/assets,
The level of accuracy of the Z-score, that is, its ability to forecast correctly the solvency or insolvency of the companies, has been widely studied: The accuracy has been considered very high if the forecast was performed with one or two years before the insolvency. On the contrary, the level of accuracy decreased if the forecasting referred to a more distant period. The model requires assignment of a score to the companies analysed and comparison to the cut-off score (i.e., the Z cutoff of 2,675), which represents the discriminant or referring parameter. Based on this comparison, it was theoretically possible to classify a firm as healthy or insolvent. The model was not so dichotomous in that it produces a gray area (defined by a range of scores from 1.81 to 2.99) when used for predictive purposes. Despite the determination of a cut-off point, an identified range of values were defined as an uncertainty zone for which an opinion about the bankruptcy probability for firms whose Z-score cannot be given with any accuracy. Altman’s (1968) work has been widely appreciated as innovative. When his use of indices was criticised, Altman answered that these warn about the coming of insolvency but cannot reveal the reasons for it, so that subjective interpretation is still needed.
b The logistic model represents the second approach analysed. It considers a
qualitative dependent and dichotomous variable that describes whether the company belongs to one of two categories: healthy (Y = 0) or insolvent (Y = 1). Meanwhile, all indices were considered independent variables. This model then uses a specific version of the regression called the linear probability model, which uses values assumed by the function that vary between 0 and 1 and reveal the probability that a will be classified as healthy or insolvent. The model was based on the assumption of the existence of a relation between the probability of a firm to become insolvent and the values assumed by a set of financial indicators that were considered strongly related to the insolvency event. The function was built considering the incidence of each independent variable, which requires determination of their specific correlation with the insolvency event. Zavgren (1985) provided a relevant application of the logistic regression used in this context.
c Other studies have attempted to widen the range of information considered by the models. One of these was the A-score model, which differs considerably from the other methods previously described, as it considers information in addition to the financial indices for the going concern assessments. This model was developed by Argenti in 1976 based on a the idea that crisis cannot be considered a sudden event and analysing the companies’ situations from three perspectives. The first of these concerned weaknesses in corporate governance and management, the second was potentially serious mistakes made by management, and the last concerns visible finance as well as non-financial symptoms of forthcoming crisis. This model recognises different weights for the various relevant factors with their sum being 100%. Implementation of this model by analysts requires their subjective judgment as they must choose, among others to give a full score only for the factors they considered to be determinant of the specific situation studied and a zero score to all others (Candelo, 2005; Teodori, 1989). If the A-score resulted in a level of less than 25, the company had to be considered as operating in a safe going concern situation, whereas if it resulted more than 35, the insolvency risk had to be considered consistent.
2.2 Innovative models
The development of artificial intelligence has important consequences in many fields, among which is the issue of going concern matters. The techniques belong to a specific section of artificial intelligence called machine learning, or automatic learning. This last is based on a specific concept. On receipt of outside information related to various concrete situations that are part of a certain domain, the system will identify common characteristics among the categories and develop generalisations for the selection criteria, so that they can also be applied to different cases than those used in the learning process. It is worth to recall briefly the main approaches used by those innovative inductive models (Cestari, 2009).
1 Decision trees (Frydman et al., 1985) are a graph, composed according to complex ordered relationships, each represented by one or more leaves, which originate from the decision knots. Each knot indicates that the test is performed on a specific feature. Each possible result that can be achieved with the test originates from a branch a knot that lends vitality to a subtree or subset. A leaf constitutes the terminal part of a tree and allows one to distinguish a category of individuals.
2 Case-based reasoning (CBR; Kolodner, 1992) is a form of reasoning, based on experience acquired in similar cases already addressed, to solve a particular problem and find a solution. The concept on which this technique is based is not needed necessarily to identify and generalise the knowledge acquired in a particular field but instead to recover a variety of cases that have already been analysed in the past and archived, leaving them available to ensure that they can be used as a resource for problems that may appear in the future. To solve a problem, it is not necessary to understand the various causes that constitute it but only to observe the behaviour adopted in the past in similar situations and the way the problem been faced and resolved.
3 Neural networks (Boritz and Kennedy, 1995) represent an automatic learning technique. They are composed of a large number of elementary units, each of which is connected with the other, and are able to do simple calculations. The result of this technique derives from a group of units that interact with each other according to various entity terms. In the economic and financial area, the networks confer several advantages, including the ability to describe adequately the phenomena, high flexibility and adaptability. However, among the networks’ disadvantages is an absence of a theory that defines the optimal architecture to be considered in the various problems faced and the learning parameters. In addition, neural networks cannot guarantee the analyst’s comprehension of the operation and the significance of the results.
4 Genetic algorithms (Holland, 1975; Kingdon and Feldman, 1995; Varetto, 1998) are processes of optimisation inspired by concepts of natural evolution proposed by Darwin, in which there are two inevitable processes: genetic selection and reproduction. The first identifies which of the components of the population survive and reproduce, and the second one includes the genetic recombination. Natural algorithms start from those principles, which are used to solve a problem; they will not act on a specific solution but on a set of solutions, with the aim to evolve them until they reach optimal levels.
3 The turnaround index
When a company faces economic distress or crisis, assessment of the going concern principle has great importance relative to the set of actions being implemented. When in fact a risk for the going concern of the business is considered, it becomes fundamental to the definition of strategies that will enable the institution to regain vitality. The process of reorganisation and restructuring of a company in crisis is defined as turnaround, which is the process that first identifies the causes that led to the crisis and subsequently develops a strategy that allows the firm to regain its profitability. The definitions of turnaround in the doctrine are numerous and varied (Castrogiovanni and Burton 2000; Guatri, 1986; Schendel et al., 1978; Slatter and Barlow, 2003; Sudarsanam and Lai, 2001), but in all cases, it is considered a process that helps the company to overcome a crisis situation. Activity needed before the company starts a turnaround process includes assessment of how convenient it is for a firm to choose it as an alternative to the liquidation or sale of the company. To evaluate the convenience of a recovery strategy, a double comparison is required:
• first, between the benefits that the company can glean from a recovery and the resources needed to implement such a process
• second, to be performed in case the first comparison yields a positive difference, between the recovery net benefits and the benefits of liquidation of the company. It is a relevant juncture and a difficult choice is needed that involves not only significant financial issues but also psychological ones. Indeed, on one hand, entrepreneurs’ choices are often characterised by low rationality levels, and, on the other hand, more relevant variables need to be considered, such as the potential effects of the recovery on stakeholders including, first of all, employees. Moreover, time pressure affects the efficacy of the process. The alternative to a turnaround process that is considered inappropriate is the burdensome resolution to close and liquidate the company with the sale of single assets or business units or, at best and if possible, the sale of the whole business to third parties.
The composition of a well-structured turnaround plan represents the heart of the recovery process. The plan is a document in which the policies to be undertaken and the effects that they generate are formalised. In addition, the plan is the instrument needed to legitimise management’s future actions and behaviours as it discloses management ideas and decisions. When presented to stakeholders, the plan becomes the instrument by which to clarify the preferred recovery strategy and to try to reach an agreement about it. Heal-all strategies do not exist. Each plan must be composed with careful consideration of the companies’ condition, which implies that one must asses, among other things, the reasons for the economic and financial disarray, business characteristics, competitors’ conditions, and impact and sustainability of the recovery process compared to the company’s equity and turnover.
The earlier a turnaround urgency is perceived, the higher is the probability of avoiding the liquidation option. It is then clear that turnaround process assessments are needed and that instruments that are able to help label situations as soon as possible should be implemented both to help managers make decisions on time and to help stakeholders better judge whether the proposed solution is to be preferred, as, if it is formulated on time, could grant a better way out.
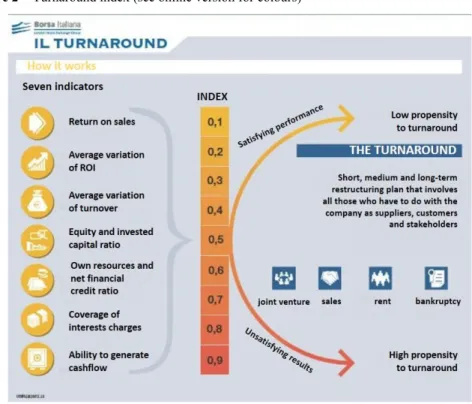
The present research focuses on this matter and on the use of a specific measurement tool that has been proposed in recent years: the so-called turnaround index. It takes into consideration company performance as well as financial and asset composition. The index can assume values between 0.1 for companies that achieve satisfying performance with a low turnaround urgency, and 0.9, for companies that register, on the contrary, unsatisfying performance with a high turnaround urgency. To determine the turnaround index, various financial indicators are mainly considered:
1 return on sales (ROS) 2 ROI deviation 3 turnover deviation 4 equity/total asset ratio 5 debt/equity ratio 6 interest coverage ratio 7 cash flow from operations.
In Italy, the model has been promoted by Borsa Italiana (see http://www.borsaitaiana. it/turnaround) but no specific scientific studies have been implemented to verify its usefulness in the Italian context (see Figure 2).
Figure 2 Turnaround index (see online version for colours)
4 Research question, sample and methodology
We have pointed out that the earlier a turnaround urgency is perceived, the higher is the probability of avoiding the liquidation option. The research then tries to test the usefulness of the turnaround index to assess turnaround urgency. The analysis is conducted to the Italian context, in which the Stock Exchange Authority, Borsa Italiana, has disclosed its positive judgement of the tool and where the recent worldwide recession is still claiming victims so that the number of subjects potentially interested in using the tool may be particularly high.
The sample considered is structured as follows:
a 164 companies listed in the all-share index of the Italian Stock Exchange1 were
considered. Data were extracted using the Bloomberg database. Some companies were not considered as:
1 belonging to bank and insurance industry because of their particular activity, which would have implied a different interpretation of the financial indexes examined
2 not all the information needed was available.
The basket of selected companies seemed nonetheless adequate to the purpose. b A restricted group of four companies (Pininfarina, Bioera, Bialetti, and Stefanel)
was chosen from the selected ones. The sample was restricted by identifying four companies that belong to different sectors. The causes of the financial imbalance are, as reported, declining demand for its products, which led to liquidity deficit and then compromises in the integrity of loans for acquisition strategies and expansions implemented before the beginning of the crisis of 2007. These have had or still have going concern problems: the first pair, Pininfarina and Bioera, have almost overcome the crisis situation, and the second pair, Bialetti and Stefanel, still face an uncertain situation. More detail is provided below.
1 Pininfarina was founded in 1930 in Turin by Battista Pininfarina, also known as Pinin. The company was designed to build special car bodies for individual customers or in small production runs. In the 1930s, automobiles were reserved for a minor elite, but Pinin felt immediately the diffusion and so he embraced the cause of modernity and aerodynamics. After World War II, Pinin and his son Sergio started the production of a new model Lancia, the design of which marked a decisive turning point in automotive style. The Pininfarina style conquered Enzo Ferrari their relationship defined some of the most beautiful cars ever built and evolved constantly for many years. After Pinin’s death in 1966, Sergio, became the chairman of the company. He continued the formal quality of design and style. In the mid-1970s, Sergio attested the necessity to separate the Centro Studi e Ricerche from the industrial division to give greater visibility to the creative sector and to offer its clients more design service from a tailor-made centre. In 1986, the company was listed in the stock exchange. Pininfarina’s industrial expansion continued throughout the world with the development of a range of industrial design services for automotive styling with
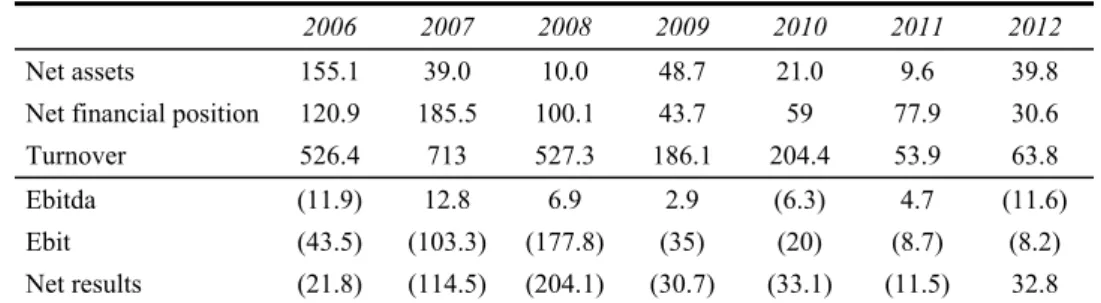
many clients and partners (e.g., Maserati, Ferrari, Motorola, Alfa Romeo). At the end of 2006, the negative trend of the market and the continuing crisis in the automotive industry resulted in decreased production. Starting from its roots and a solid reputation achieved during 80 years of its history, Pininfarina had to redesign its business model and its strategy for the future with a focus on the three main pillars: industrial design service, sustainable mobility and brand extension. Because of performance deterioration in 2008, Pininfarina signed an agreement with the bank for debt restructuring. A turnaround process started at that point, first by undersigning a recovery and resolution plan with banks. Strategic issues then had to be faced during the following years when the company tried to focus more on the core business. In fact, Pininfarina faced the crisis especially with strategic repositioning. It modified its core business, which traditionally had been based on the production of automotive orders and focused instead on engineering services and the electric car market. The company also significantly reduced the number of employees and the debt position with the sale of shares (see Table 1).
Table 1 Pininfarina 2007/2012 financial indices
2006 2007 2008 2009 2010 2011 2012
Net assets 155.1 39.0 10.0 48.7 21.0 9.6 39.8
Net financial position 120.9 185.5 100.1 43.7 59 77.9 30.6
Turnover 526.4 713 527.3 186.1 204.4 53.9 63.8
Ebitda (11.9) 12.8 6.9 2.9 (6.3) 4.7 (11.6)
Ebit (43.5) (103.3) (177.8) (35) (20) (8.7) (8.2)
Net results (21.8) (114.5) (204.1) (30.7) (33.1) (11.5) 32.8 2 Bioera was created in 2004 from a union of companies that specialised in the
production and sale of organic and herbal products, natural cosmetics and food supplements. Since 2007, because of a series of difficulties related to the expansion occurred as the result of acquisitions that caused significant liquidity problems. The restructuring plan was based on a growth path supported by financial resources obtained thanks to the share capital increase obtained by offering a wider range of products and improvement of services offered to customers by strengthening the distribution network and growth in foreign markets. In 2008, the financial situation was worsening because of the difficulty of obtaining credit and poor liquidity that generally relates to the Italian context. In 2009, the company started a turnaround process, which was finalised two years later when the court approved a pre-insolvency agreement with creditors. Since 2011, financial figures show improvements in the situation. Bioera managed to overcome the crisis thanks to the growing demand for organic products that have allowed it to sustain sales and then to find more favourable agreements with banks and the possibility of new investments for the
Table 2 Bioera Group 2007–2012 financial indexes
2007 2008 2009 2010 2011 2012
Net assets 31.0 27.7 (10.4) (9.7) 17.9 18
Net financial position 38.8 41.4 42.9 25.4 3.5 1.9
Turnover 112.9 119.4 120.7 69.7 44.6 47.1
Ebitda 6.5 5.5 1.4 1.2 8.7 3.7
Ebit 4.0 2.3 (10.7) (0.5) 8.2 3.2
Net income 0.3 (2.4) (12.8) (3.1) 11.3 0.2
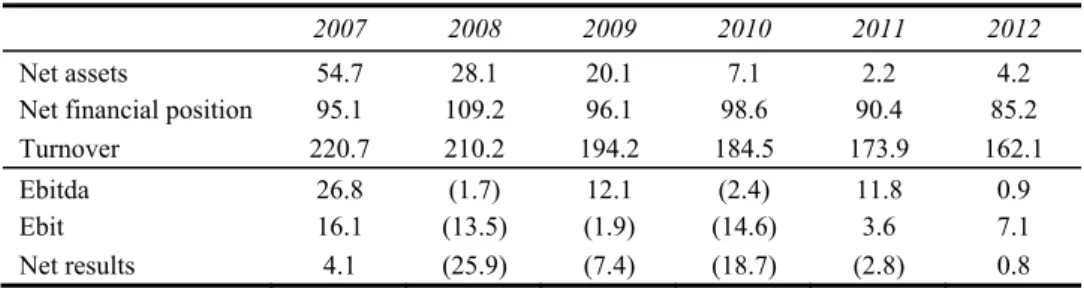
3 Bialetti is a well-known group for the production and distribution of home products, such as cooking tools and in particular for coffee machines. The company was founded in 1919 when Alfonso Bialetti opened a workshop to make semi-finished aluminium products. Motivated by an entrepreneurial spirit and thanks to brilliant intuition, in 1933, Bialetti introduced the Moka Express. The art decò design of this product revolutionised the way coffee is made in the home. In 1947, Francesco Ranzoni, grandfather of today’s chairman, founded a company that specialised in making aluminium saucepans: Rondine Italia. In the 1980s, this company was one of the first in Italy to use non-stick coatings and screen printing on its products. In 1993, Rondine Italia acquired Alfonso Bialetti & Co., an entrepreneurial choice that allowed many successes in subsequent years. In 2002 was the birth of the present-day Bialetti industries. The desire to be even more competitive on the market led to the acquisition of many historical brands and leaders in steel production (Girmi, Aeternum). Bialetti industries has been listed on the Italian Stock Exchange since 2007. Since 2008, the company has experienced a deterioration in financial position and economic performance. The following year a standstill agreement was achieved with major banks and a recovery and resolution plan was composed and approved for a three-years period (2009–2011). The Group was not able to achieve the goals shown in the approved plan nor to fulfil the financial parameters considered in the agreement. In 2011, a new plan, valid for the period 2011–2015, had to be implemented. In 2012, the situation was still uncertain but, despite a further decline in income, an improvement in EBIT, in part as a result of cost reduction and higher margins from sales, has been attained. Bialetti has not yet fully concluded the turnaround process as it operates in an adverse economic context characterised by decreases in demand that require continuous updates of the industrial and financial plans (see Table 3).
Table 3 Bialetti 2007/2012 financial indices
2007 2008 2009 2010 2011 2012
Net assets 54.7 28.1 20.1 7.1 2.2 4.2
Net financial position 95.1 109.2 96.1 98.6 90.4 85.2
Turnover 220.7 210.2 194.2 184.5 173.9 162.1
Ebitda 26.8 (1.7) 12.1 (2.4) 11.8 0.9
Ebit 16.1 (13.5) (1.9) (14.6) 3.6 7.1
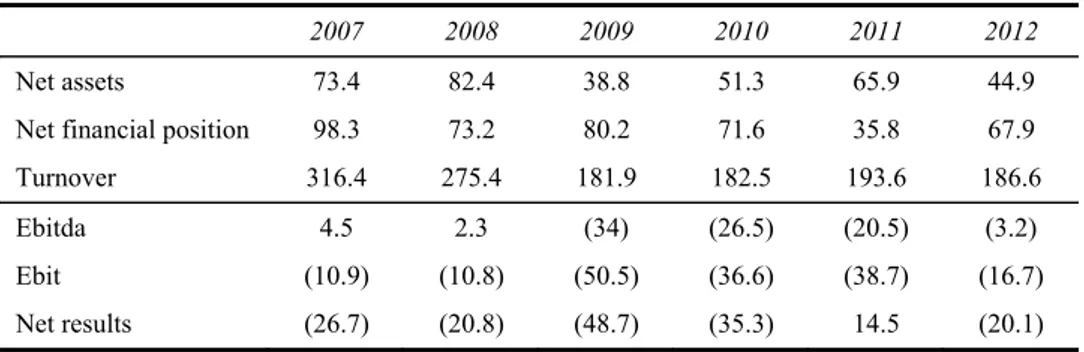
4 Stefanel has been active in the fashion industry with the Stefanel brand since 1982. Today, the company has an international dimension and operates in clothing retailing through two business units, Stefanel and Interfashion. Carlo Stefanel began to produce knitwear in 1959 in his factory, the ‘Maglificio Piave’. In 1970, his son took on the management of the company, and in 1983, Stefanel became the company name. In the 1980s, Stefanel, from a series of acquisitions and international alliances, became a large industrial group; it diversified the production of knitwear by adding sportswear, jeans, and ready-to-wear articles. In 1987, the company was listed in the Milan Stock Exchange as operating in the cloth industry. In 2006, the company started a process of repositioning the brand to focus on products with the highest rotation, to maintain inventories and to adopt more competitive prices and with more appropriate outlets for the new products. This strategy has entailed considerable costs in an already market negative context, and since 2007, the company experienced deterioration in financial position and economic performance. In 2008, the board of directors deliberated an exit from the Star segment of the Stock Exchange to enter in the standard MTA segment. In 2009, a three-year (2010–2012) Debt Restructuring Agreement was achieved. In 2012, the Group had a decrease in sales but a net improvement in Ebit and Ebitda, and the 2013 half-year results were worse than expected. The Stefanel Group is still trying to cope with the crisis using debt reduction, increasing capital, transferring shares and renewing the outlets. Unfortunately, the Stefanel context environment is characterised by strong recession (see Table 4).
Table 4 Stefanel 2007/2012 financial indices
2007 2008 2009 2010 2011 2012
Net assets 73.4 82.4 38.8 51.3 65.9 44.9
Net financial position 98.3 73.2 80.2 71.6 35.8 67.9
Turnover 316.4 275.4 181.9 182.5 193.6 186.6
Ebitda 4.5 2.3 (34) (26.5) (20.5) (3.2)
Ebit (10.9) (10.8) (50.5) (36.6) (38.7) (16.7)
Net results (26.7) (20.8) (48.7) (35.3) 14.5 (20.1)
The analysis aims to test the effectiveness of the turnaround index in identifying turnaround urgency. The test is conducted using:
1 the traditional Z-score method
2 a model inspired by the turnaround index.
The second model is based on the use of a function that allows one to rate the turnaround urgency (y) of each company whose dependent variables are represented by six selected financial indices and the coefficients of each variable (which represent the incidence of each index) has been determined using a logistic regression with R statistical software. Turnaround urgency (y) has been deducted from the independent auditor opinion
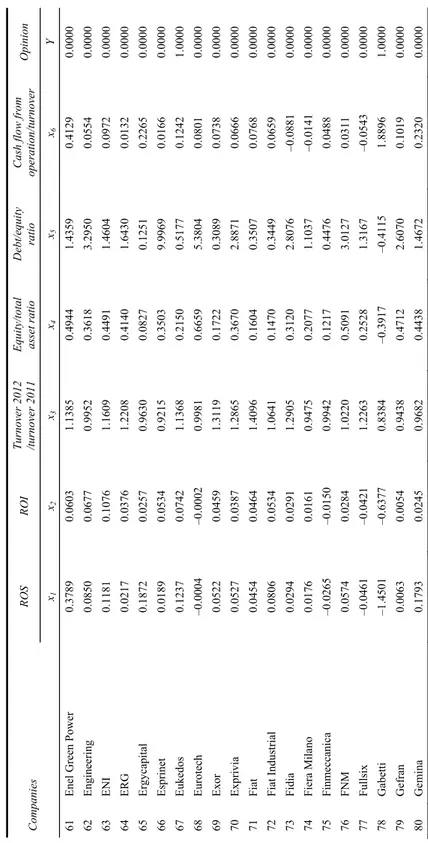
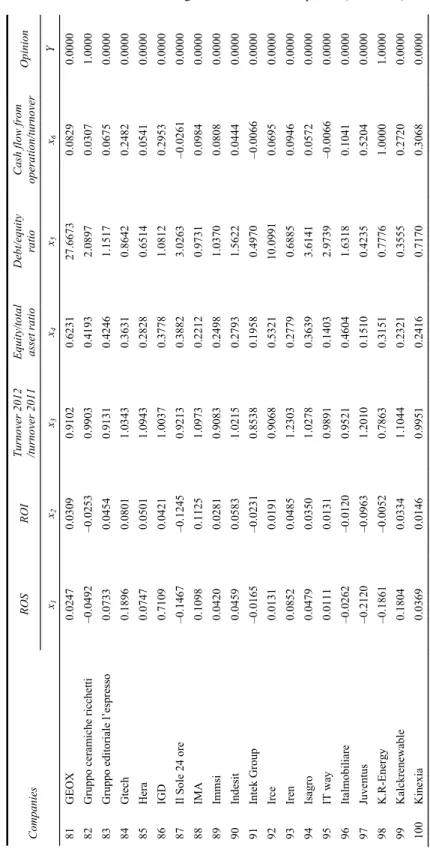
expressed in annual reports and in relation to the company’s going concern. The use of a going concern audit opinion was considered very relevant to this analysis because the problem of estimating the going concern assumption has assumed importance in recent years because of the uncertainties and risks that characterise the current economic scenarios. As stated by IAS 1, the going concern assumption is a fundamental principle in drawing up the financial statements and an aspect to be evaluated critically by the auditors as required by ISA 570. In Table 5, the last column reports the value 0 for the companies with no turnaround urgency (healthy companies) and value 1 for the companies with turnaround urgency (companies in crisis).
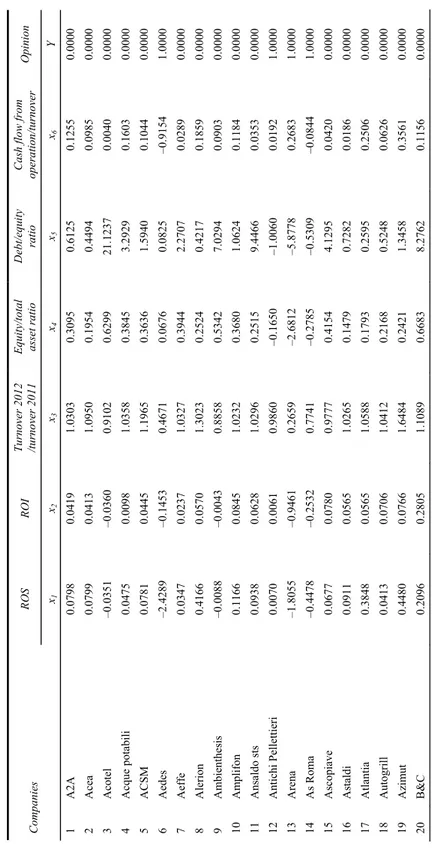
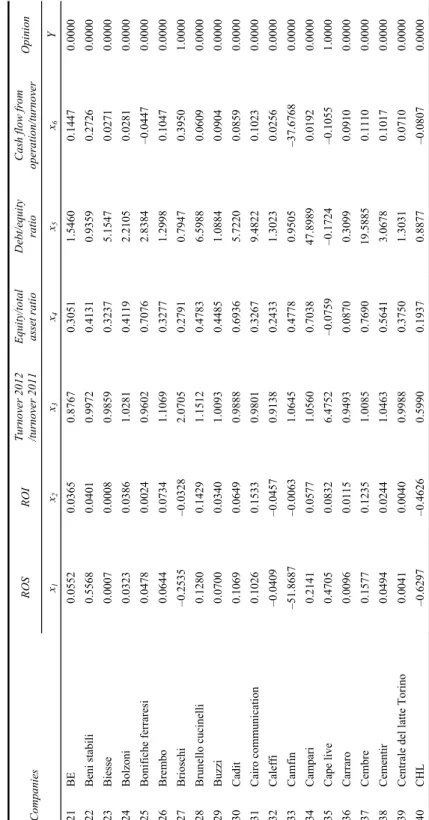
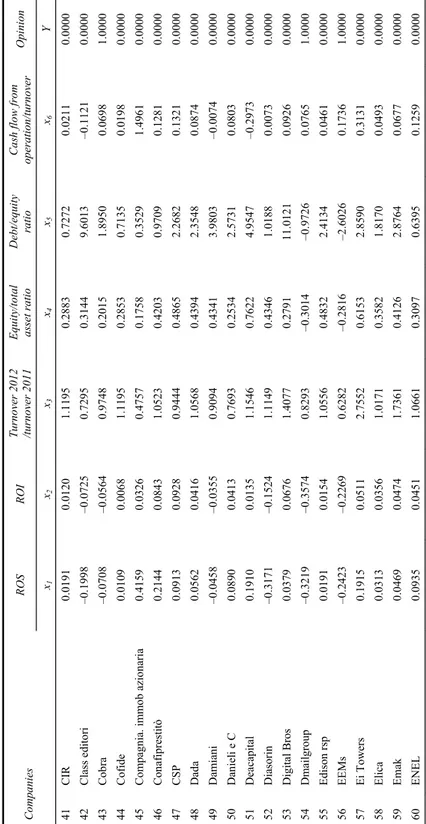
Data were extracted using the Bloomberg database for each of the 164 companies of the sample and are shown in the table and were used as an input for the logistic regression. The selected indices are the following:
• ROS (x1)
• ROI (x2)
• turnover 2012/turnover 2011 (x3)
• equity/total asset ratio (x4)
• debt/equity ratio (x5)
• cash flow from operation/turnover (x6)
• turnaround urgency (y).
The interest coverage ratio has not been included in the model because of the difficulties related to special fiscal issues in finding the necessary information for the Italian context. The remaining indices were calculated after a careful analysis of the financial statements to detect (even by the reclassification of financial statements) necessary data for the calculation of the indices.
A logistic regression using R statistical software was used to measure the correlation between the values assumed by the selected financial indices and the turnaround urgency. The model identified the various coefficients to be assigned to each function variable and the resulting function resulted the following:
1 2 3 4 5 6
0.2273 0.0143 1.0124 0.0406 0.2937 0.0040 0.0179
Y = + x − x + x − x − x − x (6)
The lower the score – (when the value tends to zero or is less than zero), the lower the turnaround urgency and the lower the uncertainties relative to going concern conditions of the company (or the better the health of the company). On the contrary, the higher the score (when the value nears 1 or is greater than 1), the higher the turnaround urgency and the higher the uncertainties relative to going concern conditions of the company (or the worse the health of the company). Compared to Z-score trends, is it possible to say that the turnaround index assumes asymmetric relevance.
Table 5 Data extracted from Bloomberg database of 164 companies RO S RO I Tu rnov er 20 12 /tu rno ver 20 11 E qui ty/tota l ass et ratio Debt/equ ity ratio Cas h flow from ope ra tion/turnover Opinion Comp anies x1 x 2 x 3 x 4 x 5 x 6 Y 1 A2A 0. 0798 0. 0419 1.03 03 0. 3095 0.6 125 0. 1255 0.0 000 2 Acea 0. 0799 0. 0413 1.09 50 0. 1954 0.4 494 0. 0985 0.0 000 3 Acotel –0. 0351 –0 .03 60 0.91 02 0. 6299 21. 1237 0. 0040 0.0 000 4 Acque pota bili 0. 0475 0. 0098 1.03 58 0. 3845 3.2 929 0. 1603 0.0 000 5 ACSM 0. 0781 0. 0445 1.19 65 0. 3636 1.5 940 0. 1044 0.0 000 6 Aedes –2. 4289 –0 .14 53 0.46 71 0. 0676 0.0 825 –0.9 154 1.0 000 7 Aeffe 0. 0347 0. 0237 1.03 27 0. 3944 2.2 707 0. 0289 0.0 000 8 Alerion 0. 4166 0. 0570 1.30 23 0. 2524 0.4 217 0. 1859 0.0 000 9 Am bienthe sis –0. 0088 –0 .00 43 0.88 58 0. 5342 7.0 294 0. 0903 0.0 000 10 Am plifon 0. 1166 0. 0845 1.02 32 0. 3680 1.0 624 0. 1184 0.0 000 11 Ans aldo sts 0. 0938 0. 0628 1.02 96 0. 2515 9.4 466 0. 0353 0.0 000 12 Antichi Pellettieri 0. 0070 0. 0061 0.98 60 –0.1 650 –1 .0060 0. 0192 1.0 000 13 Are na –1. 8055 –0 .94 61 0.26 59 –2.6 812 –5 .8778 0. 2683 1.0 000 14 As Roma –0. 4478 –0 .25 32 0.77 41 –0.2 785 –0 .5309 –0.0 844 1.0 000 15 As copiave 0. 0677 0. 0780 0.97 77 0. 4154 4.1 295 0. 0420 0.0 000 16 As tald i 0. 0911 0. 0565 1.02 65 0. 1479 0.7 282 0. 0186 0.0 000 17 Atla ntia 0. 3848 0. 0565 1.05 88 0. 1793 0.2 595 0. 2506 0.0 000 18 Autogrill 0. 0413 0. 0706 1.04 12 0. 2168 0.5 248 0. 0626 0.0 000 19 Azim ut 0. 4480 0. 0766 1.64 84 0. 2421 1.3 458 0. 3561 0.0 000 20 B&C 0. 2096 0. 2805 1.10 89 0. 6683 8.2 762 0. 1156 0.0 000
Table 5 Data extracted from Bloomberg database of 164 companies (continued) RO S R O I Tur nover 2012 /tur nover 2011 E quity /tot al as set rat io Debt/equity ratio C ash flow from oper ation/tur nov er Opinion Companies x1 x 2 x 3 x 4 x 5 x 6 Y 21 BE 0. 0552 0.0365 0. 8767 0.3051 1. 5460 0. 144 7 0.0000 22 Beni stabili 0. 5568 0.0401 0. 9972 0.4131 0. 9359 0. 272 6 0.0000 23 Bies se 0. 0007 0.0008 0. 9859 0.3237 5. 1547 0. 027 1 0.0000 24 Bolzoni 0. 0323 0.0386 1. 0281 0.4119 2. 2105 0. 028 1 0.0000 25 Bonifich e ferraresi 0. 0478 0.0024 0. 9602 0.7076 2. 8384 –0.0447 0.0000 26 Bre m bo 0. 0644 0.0734 1. 1069 0.3277 1. 2998 0. 104 7 0.0000 27 Brioschi –0.2535 –0. 0328 2. 0705 0.2791 0. 7947 0. 395 0 1.0000 28 Brune llo cuc ine lli 0. 1280 0.1429 1. 1512 0.4783 6. 5988 0. 060 9 0.0000 29 Buzzi 0. 0700 0.0340 1. 0093 0.4485 1. 0884 0. 090 4 0.0000 30 Cadit 0. 1069 0.0649 0. 9888 0.6936 5. 7220 0. 085 9 0.0000 31 Cairo communication 0. 1026 0.1533 0. 9801 0.3267 9. 4822 0. 102 3 0.0000 32 Caleff i –0.0409 –0. 0457 0. 9138 0.2433 1. 3023 0. 025 6 0.0000 33 Camfin –51. 8687 –0. 0063 1. 0645 0.4778 0. 9505 –37. 67 68 0.0000 34 Campari 0. 2141 0.0577 1. 0560 0.7038 47.8989 0. 019 2 0.0000 35 Cape live 0. 4705 0.0832 6. 4752 –0. 0759 –0.1724 –0.1055 1.0000 36 Carraro 0. 0096 0.0115 0. 9493 0.0870 0. 3099 0. 091 0 0.0000 37 Cembre 0. 1577 0.1235 1. 0085 0.7690 19.5885 0. 111 0 0.0000 38 Cementir 0. 0494 0.0244 1. 0463 0.5641 3. 0678 0. 101 7 0.0000 39 Centrale d el latte Torino 0. 0041 0.0040 0. 9988 0.3750 1. 3031 0. 071 0 0.0000 40 CHL –0.6297 –0. 4626 0. 5990 0.1937 0. 8877 –0.0807 0.0000
Table 5 Data extracted from Bloomberg database of 164 companies (continued) ROS ROI Turno ver 2012 /turno ver 2011
Equity/total asset ratio
D ebt/equ ity ra tio C as h flow fr om operation/turnover Opinion Co mpa ni es x1 x 2 x 3 x 4 x 5 x 6 Y 41 CIR 0. 01 91 0. 012 0 1 .1 195 0. 288 3 0. 7272 0. 021 1 0.0 000 42 Class ed ito ri –0. 199 8 –0 .0 725 0 .7 295 0. 314 4 9. 6013 –0 .1121 0.0 000 43 Cob ra –0. 070 8 –0 .0 564 0. 9748 0. 201 5 1. 8950 0. 069 8 1.0 000 44 Cofide 0. 01 09 0. 006 8 1 .1 195 0. 285 3 0. 7135 0. 019 8 0.0 000 45 Compag nia. im m ob azio naria 0. 41 59 0. 032 6 0 .4 757 0. 175 8 0. 3529 1. 496 1 0.0 000 46 Con afiprestitò 0. 21 44 0. 084 3 1 .0 523 0. 420 3 0. 9709 0. 128 1 0.0 000 47 CSP 0. 09 13 0. 092 8 0 .9 444 0. 486 5 2. 2682 0. 132 1 0.0 000 48 Dad a 0. 05 62 0. 041 6 1 .0 568 0. 439 4 2. 3548 0. 087 4 0.0 000 49 Damiani –0. 045 8 –0 .0 355 0 .9 094 0. 434 1 3. 9803 –0 .0074 0.0 000 50 Dan ieli e C 0. 08 90 0. 041 3 0 .7 693 0. 253 4 2. 5731 0. 080 3 0.0 000 51 Dea ca pital 0. 19 10 0. 013 5 1 .1 546 0. 762 2 4. 9547 –0 .2973 0.0 000 52 Diasorin –0. 317 1 –0 .1 524 1. 1149 0. 434 6 1. 0188 0. 007 3 0.0 000 53 Digita l Bros 0. 03 79 0. 067 6 1 .4 077 0. 279 1 11. 012 1 0. 092 6 0.0 000 54 Dm ailgroup –0. 321 9 –0 .3 574 0 .8 293 – 0.3 014 –0. 972 6 0. 076 5 1.0 000 55 E dison rsp 0. 01 91 0. 015 4 1 .0 556 0. 483 2 2. 4134 0. 046 1 0.0 000 56 E E M s –0. 242 3 –0 .2 269 0 .6 282 – 0.2 816 –2. 602 6 0. 173 6 1.0 000 57 E i T owers 0. 19 15 0. 051 1 2 .7 552 0. 615 3 2. 8590 0. 313 1 0.0 000 58 E lica 0. 03 13 0. 035 6 1 .0 171 0. 358 2 1. 8170 0. 049 3 0.0 000 59 E m ak 0. 04 69 0. 047 4 1 .7 361 0. 412 6 2. 8764 0. 067 7 0.0 000 60 E N E L 0. 09 35 0. 045 1 1 .0 661 0. 309 7 0. 6395 0. 125 9 0.0 000
Table 5 Data extracted from Bloomberg database of 164 companies (continued) RO S RO I Turnove r 2012 /turnove r 2011 E quity/tota l ass et ratio De bt/equ ity ratio Cas h flow fr om operation/turnov er Opinion Companie s x1 x 2 x 3 x 4 x 5 x 6 Y 61 E nel Green Powe r 0. 3789 0. 0603 1. 1385 0. 4944 1. 4359 0. 4129 0. 0000 62 E ngine er ing 0. 0850 0. 0677 0. 9952 0. 3618 3. 2950 0. 0554 0. 0000 63 E N I 0. 1181 0. 1076 1. 1609 0. 4491 1. 4604 0. 0972 0. 0000 64 E R G 0. 0217 0. 0376 1. 2208 0. 4140 1. 6430 0. 0132 0. 0000 65 E rgy cap ital 0. 1872 0. 0257 0. 9630 0. 0827 0. 1251 0. 2265 0. 0000 66 E sprinet 0. 0189 0. 0534 0. 9215 0. 3503 9. 9969 0. 0166 0. 0000 67 E ukedos 0. 1237 0. 0742 1. 1368 0. 2150 0. 5177 0. 1242 1. 0000 68 E uro tech –0 .0004 –0.00 02 0. 9981 0. 6659 5. 3804 0. 0801 0. 0000 69 E xor 0. 0522 0. 0459 1. 3119 0. 1722 0. 3089 0. 0738 0. 0000 70 E xpriv ia 0. 0527 0. 0387 1. 2865 0. 3670 2. 8871 0. 0666 0. 0000 71 Fiat 0. 0454 0. 0464 1. 4096 0. 1604 0. 3507 0. 0768 0. 0000 72 Fiat Indu st rial 0. 0806 0. 0534 1. 0641 0. 1470 0. 3449 0. 0659 0. 0000 73 Fidia 0. 0294 0. 0291 1. 2905 0. 3120 2. 8076 –0.08 81 0. 0000 74 Fiera M ila no 0. 0176 0. 0161 0. 9475 0. 2077 1. 1037 –0.01 41 0. 0000 75 Finm ec canic a –0 .0265 –0.01 50 0. 9942 0. 1217 0. 4476 0. 0488 0. 0000 76 FNM 0. 0574 0. 0284 1. 0220 0. 5091 3. 0127 0. 0311 0. 0000 77 Fulls ix –0 .0461 –0.04 21 1. 2263 0. 2528 1. 3167 –0.05 43 0. 0000 78 Ga betti –1 .4501 –0.63 77 0. 8384 –0.3 917 –0.4 115 1. 8896 1. 0000 79 Ge fran 0. 0063 0. 0054 0. 9438 0. 4712 2. 6070 0. 1019 0. 0000 80 Ge m ina 0. 1793 0. 0245 0. 9682 0. 4438 1. 4672 0. 2320 0. 0000
Table 5 Data extracted from Bloomberg database of 164 companies (continued) RO S R O I Turnov er 2 012 /tu rn over 2 011 Equity /total asset ratio Debt/equ ity ra tio Cash flow fr om ope ra tio n/turnov er Opinion Companies x1 x 2 x 3 x 4 x 5 x 6 Y 81 GE OX 0. 02 47 0.03 09 0.91 02 0.62 31 27. 6673 0. 082 9 0.00 00 82 Gruppo ce ram iche ric ch etti –0. 0492 –0. 0253 0.99 03 0.41 93 2.08 97 0. 030 7 1.00 00 83 Gruppo edito ri al e l’espres so 0. 07 33 0.04 54 0.91 31 0.42 46 1.15 17 0. 067 5 0.00 00 84 Gtec h 0. 18 96 0.08 01 1.03 43 0.36 31 0.86 42 0. 248 2 0.00 00 85 Hera 0. 07 47 0.05 01 1.09 43 0.28 28 0.65 14 0. 054 1 0.00 00 86 IGD 0. 71 09 0.04 21 1.00 37 0.37 78 1.08 12 0. 295 3 0.00 00 87 Il Sole 24 ore –0. 1467 –0. 1245 0.92 13 0.38 82 3.02 63 –0. 0261 0.00 00 88 IMA 0. 10 98 0.11 25 1.09 73 0.22 12 0.97 31 0. 098 4 0.00 00 89 Imms i 0. 04 20 0.02 81 0.90 83 0.24 98 1.03 70 0. 080 8 0.00 00 90 Ind esit 0. 04 59 0.05 83 1.02 15 0.27 93 1.56 22 0. 044 4 0.00 00 91 Inte k Group –0. 0165 –0. 0231 0.85 38 0.19 58 0.49 70 –0. 0066 0.00 00 92 Irce 0. 01 31 0.01 91 0.90 68 0.53 21 10. 0991 0. 069 5 0.00 00 93 Iren 0. 08 52 0.04 85 1.23 03 0.27 79 0.68 85 0. 094 6 0.00 00 94 Isagro 0. 04 79 0.03 50 1.02 78 0.36 39 3.61 41 0. 057 2 0.00 00 95 IT wa y 0. 01 11 0.01 31 0.98 91 0.14 03 2.97 39 –0. 0066 0.00 00 96 Ita lmobiliare –0. 0262 –0. 0120 0.95 21 0.46 04 1.63 18 0. 104 1 0.00 00 97 Juve ntus –0. 2120 –0. 0963 1.20 10 0.15 10 0.42 35 0. 520 4 0.00 00 98 K.R-E nerg y –0. 1861 –0. 0052 0.78 63 0.31 51 0.77 76 1. 000 0 1.00 00 99 Kalc kre newable 0. 18 04 0.03 34 1.10 44 0.23 21 0.35 55 0. 272 0 0.00 00 100 Kinex ia 0. 03 69 0.01 46 0.99 51 0.24 16 0.71 70 0. 306 8 0.00 00
Table 5 Data extracted from Bloomberg database of 164 companies (continued) RO S R O I Turno ver 2 012 /tu rn over 2 011 Equity/ tota l as set r ati o D ebt/ equ ity ratio Cas h flow from operation/tu rn ov er O pinion Companie s x1 x 2 x 3 x 4 x 5 x 6 Y 101 La Doria 0. 0440 0. 058 4 1.19 55 0.3 117 2. 1360 0. 0296 0. 000 0 102 La ndi Lo re nz o 0. 0356 0. 030 1 1.08 55 0.4 263 2. 4135 0. 1439 0. 000 0 103 La zi o –0 .13 72 –0. 0417 1.01 62 0.3 169 0. 9356 0. 2435 0. 000 0 104 Lux ottica 0. 1386 0. 116 3 1.13 88 0.4 730 1. 5103 0. 0806 0. 000 0 105 M aire tec nim ont –0 .08 78 –0. 0833 0.81 86 –0 .053 6 – 1.31 57 –0.0 624 1. 000 0 106 M A RR 0. 0626 0. 098 7 1.00 75 0.2 951 2. 9074 0. 0284 0. 000 0 107 M ediaset –0 .06 39 –0. 0326 0.87 51 0.4 106 1. 9923 0. 3514 0. 000 0 108 M erid ie –0 .05 41 –0. 0318 1.24 64 0.2 846 1. 3919 0. 0037 0. 000 0 109 M oleskine 0. 3893 0. 255 9 1.16 18 0.2 690 0. 5609 0. 2436 0. 000 0 110 M olm ed –4 .87 31 –0. 6278 1.65 99 0.6 532 1 9.37 52 –4.5 278 1 .000 0 111 M ondad ori –0 .11 26 –0. 0923 0.93 79 0.2 509 0. 7322 0. 0188 0. 000 0 112 M ondo tv o 0. 0052 0. 001 1 0.66 79 0.6 678 37 .74 48 0. 3064 0. 000 0 113 M ontefibre –0 .15 78 –0. 1712 0.90 11 0.3 060 2. 0547 –0.0 666 1. 000 0 114 M oviem ax –0 .07 31 –0. 0298 0.67 88 –0 .207 0 –28. 728 6 0. 0904 1. 000 0 115 Olidata 0. 0388 0. 040 5 1.42 36 0.0 338 0. 1721 0. 0676 1. 000 0 116 Panaria G roup –0 .04 94 –0. 0385 0.96 36 0.4 269 1. 8436 0. 0392 0. 000 0 117 Parm ala t 0. 0440 0. 052 1 1.16 39 0.7 176 8. 4983 0. 0704 0. 000 0 118 Piaggio 0. 0687 0. 065 2 0.92 73 0.2 972 0. 9704 0. 0962 0. 000 0 119 Pierre l –0 .21 37 –0. 1373 0.87 88 –0 .142 5 – 0.69 14 –0.0 735 1. 000 0 120 Piquadro 0. 0933 0. 067 7 0.87 31 0.3 778 1. 3236 0. 1066 0. 000 0
Table 5 Data extracted from Bloomberg database of 164 companies (continued) RO S R O I Turnov er 2 012 /tu rn over 2 011 Equity /total asset ratio Debt/equ ity ra tio Cash flow fr om ope ra tio n/turnov er Opinion Companies x1 x 2 x 3 x 4 x 5 x 6 Y 121 Pire lli 0. 12 86 0.10 28 1.07 37 0.31 47 0.85 59 0. 085 0 0.00 00 122 Po ligrafica ed ito rial –0. 0182 –0. 0147 0.90 58 0.19 90 0.53 20 0. 030 5 0.00 00 123 Po ligrafica S. Fa ustino –0. 0375 –0. 0538 0.98 38 0.24 87 3.04 67 –0. 0015 0.00 00 124 Po ltro ne fra u 0. 06 51 0.05 50 0.91 42 0.25 05 0.86 66 0. 074 2 0.00 00 125 Pre lios –0. 2889 –0. 0444 0.73 66 0.09 44 0.17 13 –0. 2042 1.00 00 126 Pre m uda –0. 2125 –0. 0453 0.87 74 0.31 56 0.58 80 0. 198 8 0.00 00 127 Prima ind utrie 0. 05 04 0.04 65 1.12 79 0.22 13 0.72 70 0. 043 9 0.00 00 128 Pry sm ia n 0. 06 33 0.08 26 1.03 49 0.19 26 0.57 49 0. 053 1 0.00 00 129 Ratti 0.0679 0.06 24 1.1396 0.3585 1. 9404 0.0116 0.0000 130 RCS –0. 0562 –0. 0461 0.77 00 0.09 19 0.53 77 –0. 0417 1.00 00 131 Rec orda ti 0. 20 16 0.15 36 1.08 70 0.60 85 4.01 64 0. 136 1 0.00 00 132 Ren o de Me dici 0. 00 16 0.00 18 0.91 97 0.32 93 1.52 31 0. 035 2 0.00 00 133 Rep ly 0. 10 56 0.10 99 1.12 39 0.37 55 1.94 49 0. 064 6 0.00 00 134 Rete lit –0. 1414 –0. 0269 1.10 10 0.71 54 4.83 99 0. 234 8 0.00 00 135 Sa baf 0. 06 80 0.05 10 0.87 99 0.66 33 13. 3148 0. 116 0 0.00 00 136 Sa esgette r 0. 07 97 0.05 84 0.95 85 0.58 76 3.41 59 0. 135 2 0.00 00 137 Sa filo Gro up 0. 06 29 0.04 95 1.06 66 0.57 86 5.15 22 0. 068 4 0.00 00 138 Sa ipem 0. 11 08 0.08 61 1.06 16 0.32 29 1.37 18 0. 016 8 0.00 00 139 Sa lvatore ferragam o 0. 16 85 0.25 48 1.16 89 0.39 27 4.62 56 0. 105 1 0.00 00 140 Sa ras –0. 0060 –0. 0179 1.07 75 0.30 37 1.29 24 0. 045 2 0.00 00 141 SAVE 0. 12 75 0.06 49 1.02 49 0.52 61 2.54 25 0. 117 9 0.00 00 142 Sc reen se rvice –0. 3742 –0. 1374 0.76 36 0.46 83 6.99 91 –0. 0356 1.00 00
Table 5 Data extracted from Bloomberg database of 164 companies (continued) RO S RO I Tu rnover 2012 /turnover 2011 Equity /tot al as set rat io D ebt/equ ity rat io Cas h fl ow from operation/turnov er O pinion Companie s x1 x 2 x 3 x 4 x 5 x 6 Y 143 Seat pagine gia lle –2.03 70 –0. 5629 0. 8454 0.0000 0.00 00 0.2959 1. 0000 144 Servizi Ita lia 0.0817 0.05 69 1. 0688 0.3301 2.60 59 0.1833 0. 0000 145 Sias 0.2554 0.05 59 0. 9734 0.3629 0.70 89 0.2714 0. 0000 146 Sintes i –0.09 72 –0. 0230 22.4912 0.0783 0.61 18 0.5924 1. 0000 147 Snai –0.02 71 –0. 0183 0. 9198 0.2168 0.38 65 0.0404 1. 0000 148 Snam 0.5660 0.09 35 1. 0540 0.2626 0.41 58 0.2198 0. 0000 149 Sogefi 0.0703 0.09 07 1. 1389 0.2106 0.56 80 0.0817 0. 0000 150 Sorin 0.0505 0.03 93 0. 9834 0.5964 3.22 97 0.1088 0. 0000 151 STMicroelectro nics –0.24 83 –0. 1994 0. 8702 0.6099 4.20 07 0.0730 0. 0000 152 Te lecom Italia 0.2137 0.08 13 0. 9848 0.2967 0.61 00 0.2888 0. 0000 153 Te lecom ita lia m edia –0.48 41 –0. 2561 0. 9350 –0. 0769 –0. 7551 –0. 2411 1. 0000 154 Te naris 0.2175 0.14 76 1. 0864 0.7242 7.34 35 0.1717 0. 0000 155 Te rna 0.5595 0.06 40 1. 0889 0.1845 0.28 93 0.3531 0. 0000 156 Te rni Energia 0.1068 0.03 51 0. 3352 0.2928 1.17 92 –0. 0620 0. 0000 157 Te sm ec 0.1468 0.10 48 1. 0721 0.0000 0.00 00 0.1343 0. 0000 158 Tisca li 0.0060 0.00 55 0. 8736 –0. 5746 –0. 7579 0.1874 1. 0000 159 To d’s 0.2168 0.19 46 1. 0778 0.7120 7.75 21 0.1089 0. 0000 160 Trevi fin Indus triale 0.0438 0.03 25 1. 0529 0.2954 1.42 44 0.0614 0. 0000 161 TXT 0.0942 0.07 27 1. 2032 0.4466 2.22 28 0.0833 0. 0000 162 Yoox 0.0503 0.07 46 1. 2910 0.4012 6.59 07 0.0718 0. 0000 163 Zigna go vetro 0.1527 0.13 23 1. 0258 0.3640 2.92 81 0.1407 0. 0000 164 Zu cch i –0.05 11 –0. 0442 0. 8597 0.0532 0.51 77 0.1222 1. 0000
5 Results analysis
The methods represent a way for companies that are still involved in a crisis situation or that have not completely overcome the crisis to understand whether there have been improvements over time or whether the going concern uncertainties have increased.
This section presents the results obtained from application of the two different assessment models to the four selected companies for the crucial periods:
• 2008 crisis period for the companies analysed • 2010 period of turnaround interventions
• 2012 period when Pininfarina and Bioera overcame the crisis and Bialetti and Stefanel were still implementing recovery and restructuring procedures.
5.1 Results for Pininfarina
Both models highlight an improvement from 2008 to 2012 with a score from the Z-score model that increased from 0.51 to 1.14. The value of turnaround index improved, decreasing from 0.55 to 0.27. Analysis of the single variables indicates improvement of all indices considered. Results confirm that the two tools provide a useful synthesis of the situation (see Table 6).
Table 6 Pininfarina
Indices of Pininfarina group Coefficient Pininfarina
2008 2010 2012 Z-score model
Z = 1.2x1 + 1.4x2 + 3.3x3 + 0.6x4 + 1.0x5
x1 = working capital/total assets 1.2 0.5014 0.5998 0.6486
x2 = retained profits/total assets 1.4 0 0 0.1660
x3 = ROI 3.3 –0.3029 –0.0622 –0.0415
x4 = market value equity/total of third-party debts 0.6 0.0175 0.0699 0.2524
x5 = turnover/total assets 1 0.8979 0.6347 0.3230 Score 0.5104 1.1912 1.1477 Turnaround index Y = 0.2273 + 0.0143x1 – 1.0124x2 + 0.0406x3 – 0.2937x4 – 0.0040x5 – 0.0179x6 x1 = ROS 0.0143 –0.3374 –0.0980 –0.1777 x2 = ROI –1.0124 –0.3029 –0.0622 –0.0415 x3 = turnover 2012/turnover 2011 0.0406 0.7392 1.0956 1.1834
x4 = equity/total asset ratio –0.2937 0.0170 0.0653 0.2016
x5 = debt/equity ratio –0.0040 0.0374 0.1037 0.4078
x6 = cash flow from operation/turnover –0.0179 –0.1958 –0.0630 –0.3363
5.2 Bioera
Both models highlight an improvement from 2008 to 2012 with a Z-score model score that rose from 1.93 to 2.23 and an improved value for the turnaround index, which decreased from 0.17 to 0.34 and then to 0.13. These changes attest to the reduction of the turnaround urgency for the group. Only the turnaround index noted the worst net results in 2010, during an intermediate stage of the restructuring procedure. Results confirm that both tools provide a useful synthesis of the situation. The higher sensitivity shown by the first index is possible as net incomes decrease and negative equity are considered when determining the turnaround indices not considered in the Z-score model (see Table 7). Table 7 Bioera Group
Indices Coefficient Bioera
2008 2010 2012 Z-score model
Z = 1.2x1 + 1.4x2 + 3.3x3 + 0.6x4 + 1.0x5
x1 = working capital/total assets 1.2 0.5438 0.3958 0.4679
x2 = retained profits/total assets 1.4 0 0 0.0491
x3 = ROI 3.3 0.0198 –0.0130 0.0684
x4 = market value equity/total of third-party debts 0.6 0.3119 –0.2017 0.625
x5 = turnover/total assets 1 1.0258 1.8151 1.0064 Score 1.9307 2.1261 2.2374 Turnaround index Y = 0.2273 + 0.0143x1 – 1.0124x2 + 0.0406x3 – 0.2937x4 – 0.0040x5 – 0.0179x6 x1 = ROS 0.0143 0.0193 –0.0072 0.0115 x2 = ROI –1.0124 0.0198 –0.0130 0.0684 x3 = turnover 2012/turnover 2011 0.0406 1.0846 0.5775 1.0535
x4 = equity/total asset ratio –0.2937 0.2380 –0.2526 0.3856
x5 = debt/equity ratio –0.0040 2.1641 –1.3857 1.8980
x6 = cash flow from operation/turnover –0.0179 0.0381 0.0531 –0.0199
Score 0.1725 0.3426 0.1384
5.3 Bialetti
Both models highlight an improvement from 2008 to 2012 with a score of Z-score model that increased from 1.68 to 2.009 and the value of turnaround index, which improved, decreasing from 0.28 to 0.21, which attests to the reduction of turnaround urgency for the group, although there still remain significant uncertainties about going concern. A close look at the specific values for each variable indicates that the improvement in both methods results from improvements in operating income, which increased from (13.5) to 7.1 (see Table 8).
Table 8 Bialetti Group
Bialetti Group indices Coefficient Bialetti 2008 2010 2012 Z-score model
Z = 1.2x1 + 1.4x2 + 3.3x3 + 0.6x4 + 1.0x5
x1 = working capital/total assets 1.2 0.6923 0.7133 0.6857
x2 = retained profits/total assets 1.4 0 0 0.0130
x3 = ROI 3.3 –0.0618 –0.0788 0.0441
x4 = market value equity/total of third-party debts 0.6 0.1477 0.0399 0.0268
x5 = turnover/total assets 1 0.9624 0.9962 1.0068 Score 1.6779 1.6159 2.009 Turnaround index Y = 0.2273 + 0.0143x1 – 1.0124x2 + 0.0406x3 – 0.2937x4 – 0.0040x5 – 0.0179x6 x1 = ROS 0.0143 –0.0642 –0.0791 0.0424 x2 = ROI –1.0124 –0.0618 –0.0788 0.0441 x3 = turnover 2012/turnover 2011 0.0406 0.9524 0.9501 0.9321
x4 = equity/total asset ratio –0.2937 0.1287 0.0383 0.0263
x5 = debt/equity ratio –0.0040 1.0849 0.6961 0.3952
x6 = cash flow from operation/turnover –0.0179 –0.0385 –0.0168 0.0600
Score 0.2863 0.3309 0.2122
5.4 Stefanel
The results obtained for Stefanel show a gap between the two methods: the Z-score model shows that the situation improved in 2012, whereas the turnaround index points to a worsening condition. It is not possible to establish a priori which of the results should be considered more reliable. Perusal of the annual report and a search for additional information about the group yielded that Stefanel has not yet resolved its going concern problems. The turnaround index trend seems to be more consistent for findings that are highlighted by specific analysis (see Table 9).
Table 9 Stefanel Group
Stefanel Group indices Coefficient Stefanel
2008 2010 2012 Z-score model
Z = 1.2x1 + 1.4x2 + 3.3x3 + 0.6x4 + 1.0x5
x1 = working capital/total assets 1.2 0.3902 0.3956 0.5774
x2 = retained profits/total assets 1.4 0 0 0
x3 = ROI 3.3 –0.0345 –0.1228 –0.0813
x4 = market value equity/total of third-party debts 0.6 0.3576 0.2103 0.2799
x5 = turnover/total assets 1 0.8801 0.6176 0.9085
Table 9 Stefanel Group (continued)
Stefanel Group indices Coefficient Stefanel
2008 2010 2012 Turnaround index Y = 0.2273 + 0.0143x1 – 1.0124x2 + 0.0406x3 – 0.2937x4 – 0.0040x5 – 0.0179x6 x1 = ROS 0.0143 –0.0392 –0.1989 –0.0893 x2 = ROI –1.0124 –0.0345 –0.1228 –0.0813 x3 = turnover 2012/turnover 2011 0.0406 0.8704 1.0088 0.9639
x4 = equity/total asset ratio –0.2937 0.2633 0.1736 0.2187
x5 = debt/equity ratio –0.0040 2.8219 3.6643 0.8889
x6 = cash flow from operation/turnover –0.0179 –0.0102 –0.1408 –0.1757
Score 0.2087 0.3268 0.2827
6 Conclusions
The goal of this research was to demonstrate the effectiveness of the turnaround process undertaken by four companies by applying two different methods, the Z-score model and the turnaround index.
By summarising the data collected (see Table 10), it is possible to perform a comparative analysis.
Table 10 Data synthesis
Pininfarina Bioera 08 10 12 08 10 12 Z-score 0.5104 1.1912 1.1477 1.9307 2.1261 2.2374 Turnaround 0.5576 0.3149 0.2761 0.1725 0.3426 0.1384 Bialetti Stefanel 08 10 12 08 10 12 Z-score 1.6779 1.6159 2.009 1.4491 0.8131 1.5010 Turnaround 0.2863 0.3309 0.2266 0.2087 0.3268 0.2827
The data calculated using the Z-score method shows an improvement in the time range considered for all four companies. The turnaround index instead certifies better scores for all except for Stefanel, which had a slight deterioration (from 0.2087 to 0.2827). The analysis of data contained in the first-half report for 2013 shows a worsening of some indicators especially related to Ebit and Ebitda, which certifies that the results of the Turnaround are more reliable.
For both methods, Bioera produced the best performance; in fact, the data shows that the company achieved a balanced budget.
The worst value for both methods relates to Pininfarina for 2008, when the company considered the turnaround process to be urgent.
The values reported by both methods are significant for Bialetti and Stefanel, which also reported the intermediate trend adequately.
Even in this case, the turnaround index is more accurate because detected even the slight worsening of Bioera reported in 2010 as a result the bankruptcy of the Natfood company that belongs to the group.
From the values calculated by the zero score for each year, it is evident that in all cases (even for the companies that seem to have overcome the crisis) the results lower compared to the cut-off score of 2.765 (established by Altman) that should represent the threshold over which the company is considered healthy or better a company that does not have going concern uncertainties.
With the exception of Bioera and Bialetti for 2012 only, all Z-score values calculated are less than the minimum value of 1.81, which indicates insolvent companies. Particularly significant, for some considerations, are the values of Pininfarina, which evidence a serious state of insolvency, according to Altman’s theory, but which are not reflected in reality, because, as noted above, the group’s turnaround achieved satisfactory economic and financial performance. For Pininfarina, the value calculated by the turnaround index is more significant because it takes a value close to 0.1, which indicates that company reached its balance.
It is difficult to say whether the research results are sufficient to establish the validity of the model. It is fairly well established that data calculated with indices are more truthful about the health status of the analysed companies. The use of the models represents a support for the turnaround process analysis. The assessment models considered here can provide a good indication of the company turnaround urgency.
The difference between the two models arises from their different structures:
• It is not possible to say which method is better for estimation of the state of health of the company as the two methods depend on many variables that are interrelated. The two models show a good level of consistency between them as the results are generally aligned.
• The turnaround index is based on logistic regression whereas the Z-score model is based on the discriminant analysis. In fact, although the discriminant analysis supposes that the companies are taken from two different sets and assess of the membership of each company as belonging to one of the two categories, the logistic model hypothesises that firms are taken randomly from a single population to which they belong so as to estimate a given characteristic of the same. Therefore, this last does not estimate the membership of an enterprise in a group but the characteristics (turnaround urgency) of the group to which the firm belongs.
• The turnaround index, for 164 companies, has been found to improve the precision level for a large number of companies; the Z-score was determined considering 66 companies.
This research assesses the usefulness of turnaround index for determination of the health estimation of a company and its going concern assumption. As such, there many areas for improvement and for further research. In particular, we recognise that our study is subject to some important limitations. The first and most obvious is the samples considered. To investigate the effectiveness of the model, it would be more appropriate to consider all of the listed companies and their performance for a wider period of time. The restricted sample also is limiting because each company that is subject to a turnaround process develops tools to overcome the crisis. The tools are designed for the various stages in which the company might be and are not readily comparable in terms of accounting.
Further investigation to test the turnaround index for a larger number of situations that may help to recognise the test significance may be necessary. The future steps of the analysis must expand the sample to reach a statistical expression in which, apart from quantitative factors, some qualitative factors of the crisis also should be considered. Our contribution is to produce an empirical study about a current economic topic using an approach established by the Italian Stock Exchange, whose international literature do not consider the same settings. In the literature, numerous studies have attempted problem analysis and crisis forecasting. This study provides innovative view relative to the past, when attention was only on asset liquidation to recover claims. At present, the turnaround objective is not only to recover the performance of a company in crisis but also to return it to its previous performance and possibly to improve it by enhancing the value of intangible assets.
References
Altman, E.I. (1968) ‘Financial datios, discriminant analysis and the prediction of corporate bankruptcy’, The Journal of Finance, September, Vol. 23, No. 44, pp.589–609.
Andrew, W. (1986) ‘Logit versus discriminant analysis: a specification test and application to corporate bankruptcies’, Journal of Econometrics, Vol. 31, No. 2, pp.151–179.
Argenti, J. (1976) Corporate Collapse: The Causes and Symptoms, Holsted Press, McGraw Hill, London.
Balcaen, S. and Ooghe, H. (2006) ‘35 years of studies on business failure: an overview of the classic statistical methodologies and their related problems’, British Accounting Review, Vol. 38, No. 1, pp.63–93.
Beaver, W. (1966) ‘Financial ratio as predictors of failure, empirical research in accounting: selected studies 1966’, Journal of Accounting Research, Vol. 4, p.71.
Beaver, W. (1968) ‘Alternative accounting measures as predictors of failure’, The Accounting Review, Vol. 43, No. 1, pp.113–122.
Boritz, E. and Kennedy, D. (1995) ‘Effectiveness of neural network types for prediction business failure’, Expert Systems with Application, Vol. 9, No. 4, pp.503–512.
Candelo, E. (2005) ‘Il modello Argenti-scores’ [Argenti-scores model], Turnaround Strategy, p.83, Egea, Milan.
Castrogiovanni, G. and Burton, G. (2000) ‘Business turnaround process following acquisition: reconsidering the role of retrenchment’, Journal of Business Research, Vol. 48, No. 1, pp.25–34.
Cestari, G. (2009) La diagnosi precoce della crisi aziendale. Analisi del processo patologico e modelli predittivi [Pathological Process Analysis and the Predictive Models], Giuffrè, Milan. Fischer, R.A. (1936) ‘The use of multiple measurements in taxonomic problems’, Annals of
Eugenics, Vol. 7, Part II, pp.179–188.
Frydman, H., Altman, E.I. and Kao, D. (1985) ‘Introducing recursive partitioning for financial classification: the case of financial distress’, The Journal of Finance, Vol. 40, No. 1, p.271. Guatri, L. (1986) ‘Turnaround: Declino, crisi e ritorno al valore [Turnaround: Decline, Crisis and
Return to Value], Giuffrè, Milano.
Holland, J.H. (1975) Adaptation in Natural and Artificial Systems, University of Michigan Press, Oxford, England.
Holmen, J. (1988) ‘Using financial ratios to predict bankruptcy: an evaluation of classics models using recent evidence’, Akron Business and Economic Review, Vol. 19, No. 1, pp.52–63. Kingdon, J. and Feldman, K. (1995) ‘Genetic algorithms and application to finance’, Applied
Kolodner, J.L. (1992) ‘An introduction to case-based reasoning’, Artificial Intelligence Review, Vol. 6, No. 1, pp.3–34.
Madonna, S. and Cestari, G. (2010) ‘I modelli di scoring nella previsione delle insolvenze’ [‘Scoring models for insolvency previsions’], in Danovi, A. and Quagli, A. (Eds.): Crisi Aziendali e processi di risanamento [Corporate Crisis and Recovery Processes], p.151, Ipsoa, Milan.
Marco, G. and Varetto, F. (1994) ‘Corporate distress diagnosis: comparison using linear discriminant analysis and neural networks (the Italian experience)’, The Journal of Banking and Finance, Vol. 18, No. 3, pp.505–530.
McGough, T.P. (1974) ‘Evaluation of a company as a going concern’, The Journal of Accountancy, December, Vol. 138, No. 6, pp.50–55.
Schendel, D.G., Patton, R. and Riggs, J. (1978) ‘Corporate turnaround strategies: a study of profit decline and recovery’, Journal of General Management, Vol. 3, No. 3, pp.3–11.
Slatter, S. and Barlow, L.D. (2003) Leading Corporate Turnaround, Wiley, Chichester.
Sudarsanam, S. and Lai, J. (2001) ‘Corporate financial distress and turnaround strategies: an empirical analysis’, British Journal of Management, September, Vol. 12, No. 3, pp.183–199. Teodori, C. (1989) Modelli di previsione nell’analisi economico aziendale [Prevision Models in the
Company Economic Analysis], Giappichelli (Ed.), Torino.
Varetto, F. (1998) ‘Genetic algorithms application in the analysis of insolvency risk’, Journal of Banking & Finance, October, Vol. 22, Nos. 10–11, pp.1421–1439.
Varetto, F. (1999) ‘Metodi di previsione delle insolvenze: un’analisi comparata’ [‘Insolvency prevision models: a comparative analysis’], Il rischio creditizio, p.13, UTET, Torino.
Zavgren, C. (1985) ‘Assessing the vulnerability to failure of American industrial firms: a logistic analysis’, Journal of Business Finance and Accounting, Vol. 12, No. 1, pp.19–46.
Notes