Use of the Monte Carlo in state-‐of-‐the-‐art
PWR design: study of tilt in the NEA UAM
PWR benchmark and development and
testing of new algorithms within Monte
Carlo eigenvalue calculations employing
the source-‐iteration method
Kenneth William Burn
Report RdS/2013/057 l’energia e lo sviluppo economico sostenibile
USE OF THE MONTE CARLO IN-‐STATE-‐OF-‐THE-‐ART PWR DESIGN: STUDY OF TILT IN THE NEA UAM PWR BENCHMARCK AND DEVELOPMENT AND TESTING OF NEW ALGORITHMS WITHIN MONTE CARLO EIGENVALUE CALCULATIONS EMPLOYING THE SOURCE-‐ITERATION METHOD
Kenneth William Burn (ENEA) Settembre 2013
Report Ricerca di Sistema Elettrico
Accordo di Programma Ministero dello Sviluppo Economico -‐ ENEA Piano Annuale di Realizzazione 2012
Area: Produzione di energia elettrica e protezione dell'ambiente
Progetto: Sviluppo competenze scientifiche nel campo della sicurezza nucleare e collaborazione ai programmi internazionali per il nucleare di IV Generazione
Obiettivo: Sviluppo competenze scientifiche nel campo della sicurezza nucleare Responsabile del Progetto: Felice De Rosa, ENEA
Use of Monte Carlo in State-of-the-Art PWR Design: Study of Tilt in
the NEA UAM PWR Benchmark and Development and Testing of
New Algorithms within Monte Carlo Eigenvalue Calculations
employing the Source-Iteration Method.
Descrittori
Tipologia del documento:
Collocazione contrattuale: Accordo di programma ENEA-MSE su sicurezza nucleare e
reattori di IV generazione
Reattori ad acqua leggera, PWR, Metodo Montecarlo, Neutronica
Argomenti trattati:
Sommario
This report is a continuation of two submitled last year (PAR2011). One concerned the collaboration between ENEA and IRSN (Institut de Radioprotection etde SOreté Nucléaire) dealing with safety issues related tothe thick steel reflector of a typical large size GEN 111+
reactor designo The other dealt with developments in Monte Carlo algorithms for eigenvalue calculations. These developments partially fed off the PWR modelling, some of which isatthe limit of current methodologies and computer capacity. As far as the PWR modelling is concerned, focus was on the phenomenon of flux tilt. Monte Carlo calculations were run on a 2-dimensional model of a NEA benchmark using the same water density variation as previously (±1.50% change inwater density inthe outer assemblies of opposite quadrants). Results were obtained for the power variation in the whole quadrants for four situations: heavy steel reflector and conventional baffle+water reflector, with and without flux tilt. Aiso inali four cases the power distribution per assembly was calculated.
These calculations were in support of extensive deterministic calculations carried out at IRSN. As far as the Monte Carlo algorithms were concerned, the development was continued from the PAR2011 report. At that stage, superhistories had been inserted in MCNP. The next stage of modifying the fixed source OSA patch to work in the eigenvalue mode and then combining the result with the superhistory patch had been proposed but not realized. The algorithm has now been finished and includes some new options (tallying and variance reduction according towhich fission generation it is) aswell as a variable number offission generations per superhistory
andthe option of varying the v-value toensure a reasonable supply ofchildren at each normalization. The algorithm has been tested on some realistic thermal and fast fission problems, with both in- and ex-core tallies.
Note Copia n. In carico a: NOME NOME 2 FIRMA NOME 1 FIRMA
o
EMISSIONE,}. W.B" Franca Padoani J7e~ce Def}osa
10/09/2013 f---+-,r...r---,'--r----t:---=:-=--+-T-.rf---+-+---j
r
:
.-
/
1/
S
0(().Q/~CìWDJ;//Ju
,
f./
'
--'
FIRMA
REDAZIONE CONVALIDA APPROVAZIONE
DESCRIZIONE DATA
REV.
Sommario
Questo rapporto è la continuazione di due sottomessi lo scorso anno (PAR2011). Uno di questi riguardava la collaborazione tra ENEA ed IRSN in merito a problemi di sicurezza correlati al riflettore spesso in acciaio di un tipico reattore di GEN III+ di grandi dimensioni. L’altro riguardava alcuni sviluppi degli algoritmi Monte Carlo per calcoli di autovalori. Questi sviluppi hanno tratto spunto dalla modellizzazione dei reattori PWR, che in alcune sue parti è al limite delle attuali metodologie e della capacità degli attuali calcolatori. Per quanto concerne la modellizzazione dei PWR, l’attenzione è stata posta sul fenomeno del flux tilt. Sono stati effettuati calcoli Monte Carlo per un modello bidimensionale di un benchmark NEA usando la stessa variazione di densità usata precedentemente (variazione di +/- 1.50% in densità negli assembly esterni di quadranti opposti). I risultati sono ottenuti in termini di variazione di potenza in tutti i quadranti per quattro casi: riflettore pesante in acciaio o riflettore di acqua e baffle convenzionale, con o senza flux tilt. Per tutti e quattro i casi sono state ottenute anche le distribuzioni di potenza. Questi calcoli sono stati fatti a supporto di uno studio estensivo con metodi deterministici svolto da IRSN.
Per quanto concerne gli algoritmi Monte Carlo, lo sviluppo consiste in una continuazione di quanto esposto nel Rapporto del precedente PAR2011. In quell’occasione il metodo delle superstorie era stato implementato nel codice MCNP. Lo step successivo di modificare la patch del DSA a sorgente fissa per funzionare in modalità di autovalore e poi di combinare il risultato con la patch delle superstorie era stato proposto ma non realizzato. L’algoritmo è ora stato completato ed include alcune nuove opzioni (tallying e riduzione della varianza a seconda della generazione di fissione), così come un numero variabile di generazioni di fissione per superstoria, nonché l’opzione per variare il valore di ν per assicurare una presenza ragionevole di neutroni-figli ad ogni normalizzazione. L’algoritmo è stato testato su alcuni casi realistici di reattori a fissione termici e veloci, con tally sia di tipo in-core che ex-core.
1. Introduction
This report is divided into two parts: analysis of some safety issues of current PWR designs with Monte Carlo methods and some developments in Monte Carlo algorithms to treat eigenvalue problems. The two parts represent a continuation of the two reports: “Continuing Analysis with Monte Carlo Techniques of the Impact of the Heavy Reflector of a Typical Large Size GEN III+ Reactor Design on Some Safety Features: Completion of the Ex-Core Detector Calculations from PAR2010 and Examination of the Impact on the Phenomenon of Flux Tilt”1 and “Development of Monte Carlo Algorithms for Eigenvalue Calculations”2, which were submitted under PAR-2011.
The first part of this work has been performed within the framework of an agreement between ENEA and IRSN (Institut de Radioprotection et de Sûreté Nucléaire). The particular area of the activity deals with safety issues concerning the thick steel reflector of a typical large size GEN III+ reactor design and in particular the differences caused by this reflector compared with current PWR designs.
The second part deals with new developments in the Monte Carlo treatment of the source-iteration approach to eigenvalue calculations.
Both parts of the work will be published in the literature in due course. Therefore for copyright reasons this report is by necessity in a summary form. It describes the work that was done without giving the results and conclusions. For these the reader must turn to the literature.
2. Flux tilt: comparison of effect of a heavy steel reflector compared with a conventional baffle-water configuration
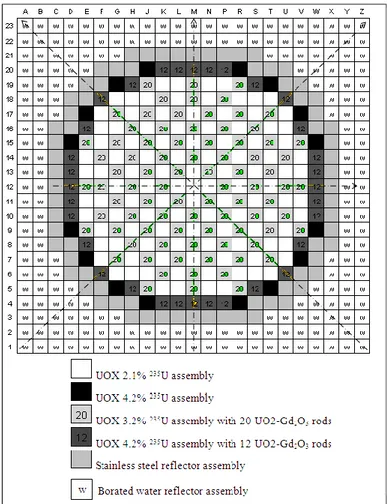
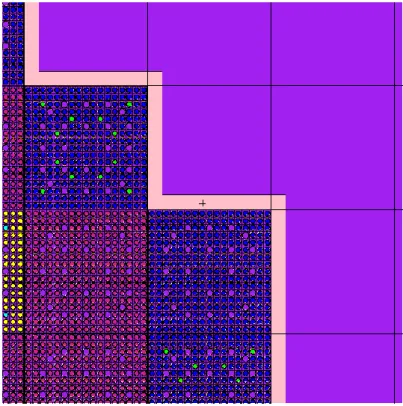
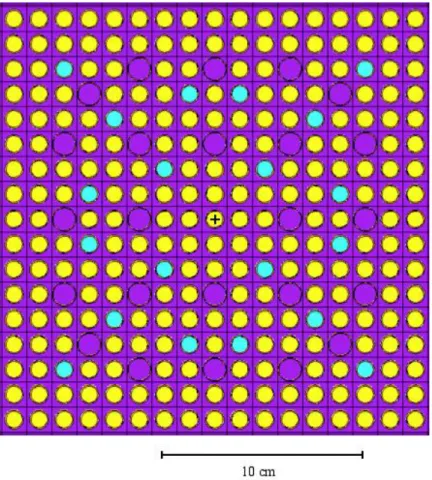
The configuration adopted was based on the UAM LWR NEA Benchmark3. The UOX core was adopted (Ref. 3, Fig. 35), with four types of assembly: 2.1% 235U enrichment with no Gd rods, 4.2% 235U enrichment with no Gd rods, 3.2% 235U enrichment with 20 Gd rods and 4.2% 235U enrichment with 12 Gd rods. Fig. 35 from Ref. 3 is reproduced below as Fig. 1. As can be seen in Fig. 1, the steel reflector was modelled by inserting steel in the assembly positions at the active zone boundary. The conventional baffle configuration was mocked-up by substituting the stainless steel reflector assemblies in Fig. 1 with assemblies containing a thickness of 2.54 cm steel immediately adjacent to the outer fuel assemblies with the rest, borated water. Fig. 2 shows a detail of the outer active zone with the conventional scheme.
Each assembly consisted of a standard 1717 array with guide tubes and Gd rods when present (see Ref. 3, Fig. 13). Geometry was assumed 2-dimensional (i.e. infinite in the axial direction). Conditions were at HFP with the temperatures given in Fig. 11 of Ref. 3. Data employed was based on JEFF3.14 libraries.
It should be mentioned that all data to describe the geometric configuration was from Ref. 3 apart from the pin lattice of assembly type 3 (Fig. 13 of Ref. 3) where a symmetric configuration was used5. Rather than employ a full 360° radial cross section as shown in Fig. 1, a reflection surface was employed – a plane in the NW-SE direction. As is well known,
exploiting symmetry removes some of the higher eigenmodes and both increases the speed of convergence to the asymptotic solution and reduces correlations between fission cycles.
Figure 2: Conventional Baffle and Borated Water Reflector for Flux Tilt Study
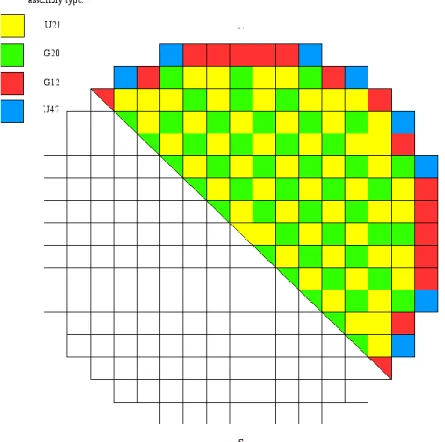
Fig. 3 shows the assembly configuration of the active assemblies only, with the reflection surface. In this figure, “U21” represents the assemblies with 2.1% 235
U enrichment with no Gd rods, “G20” represents the assemblies with 3.2% 235U enrichment with 20 Gd rods, “G12” represents the assemblies with 4.2% 235U enrichment with 12 Gd rods, and “U42” represents the assemblies with 4.2% 235U enrichment with no Gd rods.
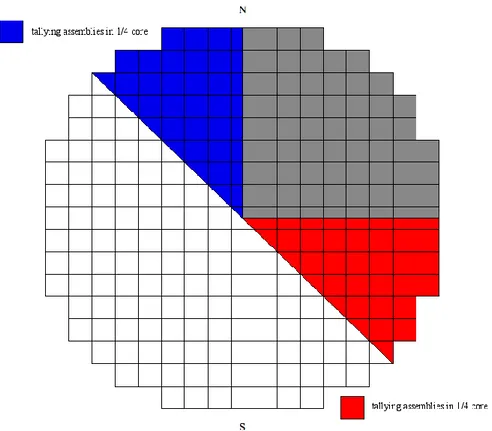
The basic configuration as shown in Fig. 3 had the same water density in all assemblies: “notilt”. Flux tilt was induced by varying the density of the water in the assemblies shown in Fig. 4: +1.5% in the SE direction and -1.5% in the NW direction. (The values of ±1.5% were established from the previous work on flux tilt in PAR2011.) With these four options: notilt / tilt and heavy steel reflector / conventional baffle, the power was calculated in the SE and NW quadrants of the active zone as shown in Fig. 5 and compared with the average value. Furthermore the power was also calculated in each of the assemblies shown in Fig. 3.
All calculations performed at ENEA employed the code MCNP (ver. 5-1.4)6. The results are being compared with those found by IRSN using an independent deterministic approach and will be found in the literature in due course.
Figure 3: Active Assembly Configuration with the Reflection Surface for Flux Tilt Study
Figure 5: Core Quadrants in which the Power was calculated for Flux Tilt Study
3. Development and Testing of New Algorithms within Monte Carlo Eigenvalue Calculations employing the Source-Iteration Method
The objective of this work was to introduce variance reduction into the source-iteration scheme in eigenvalue calculations so as to calculate a limited number of small, or localized responses, both in- and ex-core. We should note that with the standard form of MCNP, one can introduce any of the variance reduction tools that are available for a fixed source, in eigenvalue calculations. However such variance reduction tools are designed for fixed sources and their operation is not assured in the eigenvalue mode.
In the PAR2011 report2, the introduction of a superhistory option as a patch in MCNP was described. This was a first step in treating problems requiring variance reduction. Since then:
- an option to adjust the -value to ensure a supply of children at each normalization in the case that keff differs appreciably from unity (and there are a large number of fission
generations in each superhistory) has been inserted.
- the DSA patches7 designed to run in the fixed source mode, have been modified to run in the eigenvalue mode and have been combined with the superhistory option.
- some input and output quantities were differentiated according to the fission generation:
- the responses were subdivided according to the fission generation (or group of fission generations);
- similarly the variance reduction parameters (in the DSA, 2–dimensional energy/space cell importances or weight lines) were differentiated according to the fission generation (or group of fission generations).
As discussed at length in8, the key to the approach is to simultaneously optimize the variance reduction parameters to a local response and to the fundamental mode, appropriately segmented. Thus there are a number of options available to the user:
1) How to segment the fundamental mode into responses that then form part of the optimization.
2) How many fission generations to include in a superhistory. 3) Which fission generations to include in which tally.
4) How to differentiate the variance reduction parameters according to which fission generation it is within a superhistory.
These issues are discussed in Ref. 8. Based also on previous experience9, a superhistory consisting of 10 fission generations was adopted, and tallies of all responses were made in all superhistories.
A number of test problems were run to test the new algorithm. All the results, discussion and conclusions from these test problems are given in Ref. 8. The test problems are summarized as follows:
1. PWR 2-D Problem
This was based on the UAM LWR NEA Benchmark3. The local tally was the fission rate in the central pin (see Fig. 6) of one of the peripheral assemblies (see Fig. 7).
Figure 6: PWR 2–D Problem showing Central Pin of the Assembly (marked with a cross) employed as the Local Detector
Figure 7: PWR 2–D Problem showing Position of Assembly with Local Detector and Core Subdivision for Variance Reduction
2. PWR 3-D Problem
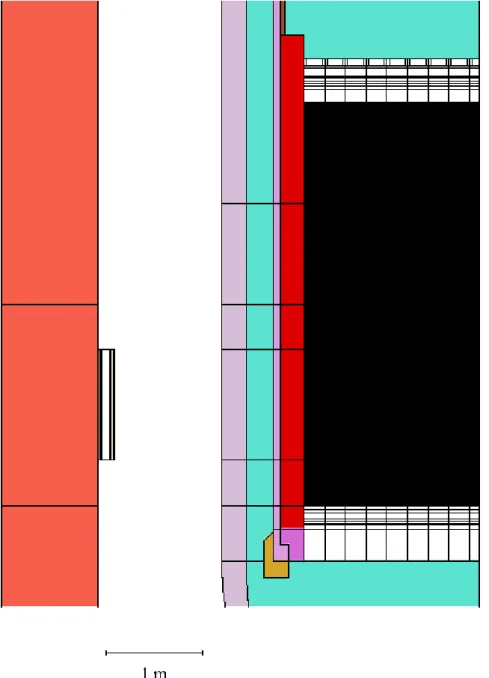
This was also based on the UAM LWR NEA Benchmarkbut with generic plenum zones and top and bottom plates added, together with a bottom plate support ring (see Fig. 8).
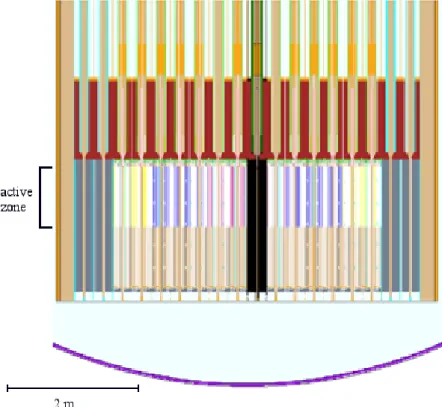
Figure 8: PWR 3–D Problem showing a ½ Core Vertical Section with Plena Zones, Top and Bottom Plates and Ex–Core Detector in the PV Well
The local response was the fission heating in a central axial segment of the central pin of the central assembly (see Fig. 9). The axial segment was of variable height, starting at around 50 cm and reducing to 8 cm. At first variance reduction parameters were generated and employed that were independent of the fission generation within the superhistory. Then a dependence was introduced.
A comparison was made with the classic importance formalism (see for example 10) and a further verification was made over 2500 fission generations that the fundamental mode was maintained with the new algorithm.
Figure 9: PWR 3–D Problem showing Position of Assembly with Local Detector and First Radial Core Subdivision for Variance Reduction
3. Liquid Lead-Cooled FR
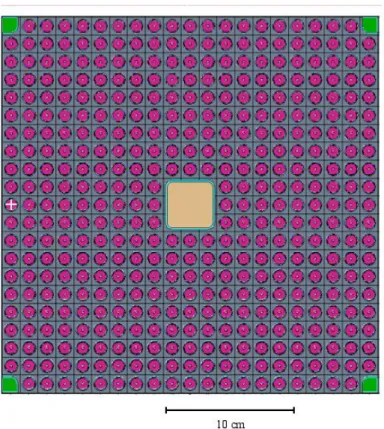
This problem is loosely based on ELSY11. A radial section of the core assembly configuration (active zone only) is shown in Fig. 10. The local tally was chosen as the fission heating in an axial segment ±1.5 cm around the core mid–plane in a single pin of the right– hand of the two central assemblies. This pin in its assembly is shown in Fig. 11. An axial section is shown in Fig. 12.
Figure 10: Lead–Cooled FR Problem showing Assembly Configuration and Radial Core Subdivision for Variance Reduction
Figure 11: Lead–Cooled FR Problem showing Pin (Marked with Cross) on Left Side of Right Hand Central Assembly employed as the Local Detector
Figure 12: Lead–Cooled FR Problem showing a Full Core Vertical Section with Active Zone, Plena Zones, Nozzle Zones, etc. above and below Active Zone
4. PWR-3D Ex-Core Problem
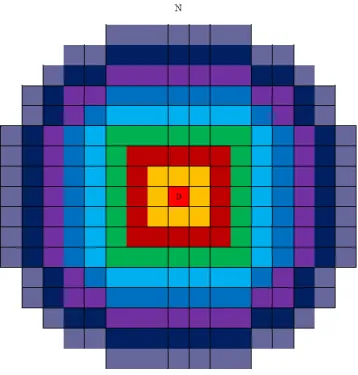
This was the same problem as problem 2 above but the local response was that of an ex-core neutron detector placed in the PV well (see Fig. 8 above). The ex-ex-core detector can also be seen in a 1/8 radial section (Fig. 13). (Note the calculations were carried out on a 360° segment.) The core subdivision for variance reduction is shown in Fig. 14 and that for tallying the fundamental mode in Fig. 15. Note in these figures that the ex-core detector is in the East direction.
Figure 13: PWR 3–D Ex–Core Problem showing a 1/8 Core Horizontal Section with Ex–Core Neutron Detector in the PV Well
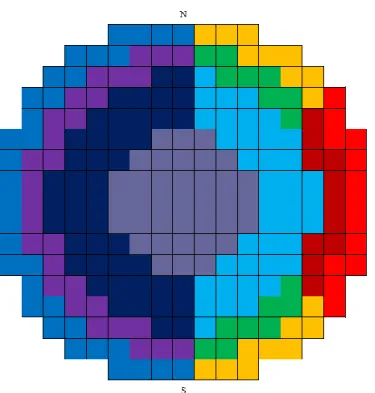
Figure 14: PWR 3–D Ex–Core Problem showing 9 Radial Subdivisions of Active Zone for Variance Reduction
Figure 15: PWR 3–D Ex–Core Problem showing 5 Radial Subdivisions of Active Zone for “Global” Tallying
4. Concluding Remarks
The first phase of the activity concerning the flux tilt in the UAM LWR NEA Benchmark has been completed. The Monte Carlo results will be compared with the deterministic results, part of a much larger activity concerning flux tilt being prosecuted by A. Sargeni and G. Bruna of IRSN. Results of the effect of the heavy steel reflector on the flux tilt and comparison between Monte Carlo and deterministic will be published in due course.
The results, discussion and conclusions of employment of the new algorithm for variance reduction in Monte Carlo source-iteration eigenvalue calculations is currently being published.
References
1. K. W. Burn, “Continuing Analysis with Monte Carlo Techniques of the Impact of the Heavy Reflector of a Typical Large Size GEN III+ Reactor Design on some Safety Features: Completion of the Ex-Core Detector Calculations from PAR2010 and Examination of the Impact on the Phenomenon of Flux Tilt”, Rapporto Tecnico ENEA NNFISS-LP2-084 (2012)
2. K. W. Burn, “Development of Monte Carlo Algorithms for Eigenvalue Calculations”, Rapporto Tecnico ENEA NNFISS-LP2-083 (2012)
3. K. Ivanov, M. Avramova, S. Kamerow, I. Kodeli, E. Sartori, “Benchmark for Uncertainty Analysis in Modeling (UAM) for Design, Operation and Safety Analysis of LWR’s: Volume I: Specification and Support Data for the Neutronics Cases (Phase I)”, Nuclear Energy Agency Committee on Safety of Nuclear Installations, NEA/NSC/DOC(2011) 4. O. Cabellos, Y. Rugama, “Processing and validation of JEFF3.1 library in ACE format at
10 different temperatures”, International Conference on Nuclear Data for Science and Technology, 2007 (DOI: 10.1051/ndata:07225)
5. A. Sargeni, Private Communication
6. X–5 MONTE CARLO TEAM, “MCNP – A General Monte Carlo N–Particle Transport Code, Version 5”; “Vol. I: Overview and Theory”: LA–UR–03–1987, “Vol. II: User’s Guide”: LA-CP-03-0245, “Vol. III: Developer’s Guide”: LA-CP-03-0284; Los Alamos National Laboratory (April 2003, rev. March 2005)
7. K.W. Burn, “Optimizing Monte Carlo to Multiple Responses: the Direct Statistical Approach, 10 Years On”, Nucl. Technol. 175, 138 (2011)
8. K.W. Burn, “Optimizing Variance Reduction in Monte Carlo Eigenvalue Calculations that employ the Source Iteration Approach”, to be published
9. R.J. Brissenden, A.R. Garlick “Biases in the Estimation of Keff and Its Error by Monte
Carlo Methods”, Ann. Nucl. Energy 13-2, 63 (1986)
10. C.J. Solomon, A. Sood, T.E. Booth, “A Weighted Adjoint Source for Weight–Window Generation by Means of a Linear Tally Combination”, Proc. Int. Conf. Advances in
Mathematics, Computational Methods, and Reactor Physics, Saratoga Springs, NY, ANS
(3–7 May 2009)
11. L. Cinotti, G. Locatelli, H.A. Abderrahim, S. Monti, G. Benamati, K. Tucek, D. Struwe, A. Orden, G. Corsini, D. Le Carpentier, “The ELSY Project”, Proc. of PHYSOR 2008, Interlaken (Switzerland), September 14-19, 2008
Acknowledgements
G. Bruna and A. Sargeni (IRSN) coordinated the activity on the flux tilt.