www.nature.com/scientificreports
Highly anomalous accumulation
rates of C and N recorded by a relic,
free-floating peatland in Central
Italy
Claudio Zaccone
1, Daniela Lobianco
2, William Shotyk
3, Claudio Ciavatta
4, Peter G. Appleby
5,
Elisabetta Brugiapaglia
6, Laura Casella
7, Teodoro M. Miano
2& Valeria D’Orazio
2Floating islands mysteriously moving around on lakes were described by several Latin authors almost two millennia ago. These fascinating ecosystems, known as free-floating mires, have been extensively investigated from ecological, hydrological and management points of view, but there have been no detailed studies of their rates of accumulation of organic matter (OM), organic carbon (OC) and total nitrogen (TN). We have collected a peat core 4 m long from the free-floating island of Posta Fibreno, a relic mire in Central Italy. This is the thickest accumulation of peat ever found in a free-floating mire, yet it has formed during the past seven centuries and represents the greatest accumulation rates, at both decadal and centennial timescale, of OM (0.63 vs. 0.37 kg/m2/yr), OC (0.28 vs. 0.18 kg/m2/yr) and TN
(3.7 vs. 6.1 g/m2/yr) ever reported for coeval peatlands. The anomalously high accretion rates, obtained
using 14C age dating, were confirmed using 210Pb and 137Cs: these show that the top 2 m of
Sphagnum-peat has accumulated in only ~100 years. As an environmental archive, Posta Fibreno offers a temporal resolution which is 10x greater than any terrestrial peat bog, and promises to provide new insight into environmental changes occurring during the Anthropocene.
Floating mires are peculiar environments consisting of emergent vegetation rooted in highly organic buoyant mats that rise and fall with changes in water level. The whole floating mass is generally divided into a mat root zone
and an underlying mat peat layer1; the release of gases due to the decomposition of organic matter (OM) is
gener-ally the main cause of buoyancy2. Floating mires are distributed world-wide; they range from small, free-floating
islands to extensive, stationary, vegetated mats which may cover hundreds of hectares of water3. Large areas of
floating marsh occur along rivers and lakes in Africa, the Danube delta in Romania, the Amazon River in South America, and in the Mississippi delta in USA, whereas smaller areas occur also in The Netherlands, Australia and
Canada4–6. Their thickness and buoyancy can vary considerably and depend upon both below-ground biomass
allocation and morphology of the constituent plant species6, as well as on abiotic factors such as salinity and
hydrology7. Free-floating mires (able to support the weight of at least one person) normally show a thickness
ranging from 40 to maximum 200–250 cm. Studying floating mats from the Louisiana delta plain, Swarzenski
et al.4 found a relatively consistent thickness among mats of different ages, thus suggesting that they may reach a
maximum thickness beyond which vertical accretion is balanced by loss of OM through decomposition8.
The fascinating sight of an island floating and moving mysteriously on a lake naturally intrigued people from time immemorial. In fact, this phenomenon was already described, among others, by Seneca (4 bc-ad 65) in his Naturales quaestiones, and by Pliny the Elder (ad 23–79) in his Naturalis historia. Latin authors have left us 1Department of the Sciences of Agriculture, Food and Environment, University of Foggia, via Napoli 25, 71122
Foggia, Italy. 2Department of Soil, Plant and Food Sciences, University of Bari “Aldo Moro”, via Amendola 165/A,
70126 Bari, Italy. 3Department of Renewable Resources, University of Alberta, 348B South Academic Building, T6G
2H1, Edmonton, Canada. 4Department of Agricultural Sciences, Alma Mater Studiorum University of Bologna, viale
Fanin 40, 40127 Bologna, Italy. 5Department of Mathematical Sciences, University of Liverpool, Liverpool L69 3BX,
United Kingdom. 6Department of Agricultural, Environmental and Food Sciences, University of Molise, via Francesco
De Sanctis, 86100 Campobasso, Italy. 7Italian National Institute for Environmental Protection and Research, via
Vitaliano Brancati 60, 00144 Roma, Italy. Correspondence and requests for materials should be addressed to C.Z. (email: [email protected])
Received: 29 September 2016 Accepted: 18 January 2017 Published: 23 February 2017
suggestive descriptions of floating islands, including those in Lacus Cutiliensis (now Lago di Paterno) and in Lacus Vadimonis (now a marshy pond), reporting details about their size and shape, buoyancy and vegetation.
But the status of “flotant” has been defined transitory9; in fact, these small isles often disappear, in most of the
cases because a transition from free-floating islands to firm land during decades, or their sinking, is likely to
occur10. That is probably why none of the free-floating islands described by Latin authors as occurring in several
lakes (e.g., Cutiliensis, Mutinensis, Statoniensis, Lydia Calaminae, Vadimonis) are extant today.
Several papers have been published about natural floating islands, mainly focusing on hydrological4,5 and
eco-logical5,7,11 aspects, as well as on their management9,12 or utilization to improve water quality. A fascinating and
valuable review of the writings on floating islands, including their distribution, modes of formation, composition, buoyancy and movements, and role in human society (control and management, habitation, artificial islands, and
mythological and esoteric aspects) was provided by Van Duzer13, who begins his treatise with a reproduction and
translation of a 1711 dissertation by the German priest Georg Christophy Munz on floating islands (Exercitatio
academica de insulis natantibus). At the same time, numerous questions are still unanswered, including the role
of free-floating islands in the global C and N cycles.
Accumulation rates (AR) of both organic C (OC) and total N (TN) have been extensively investigated along
the bog-to-fen gradient; peatlands accumulate 20–30 gC/m2/yr over the long-term14–16, with bogs generally
show-ing higher rates of C accumulation than fens17, and 0.5–0.9 gN/m2/yr (refs 18 and 19), with fens having higher
rates of N accumulation than bogs19,20. In contrast, there have been no studies regarding the long-term AR of OC
and TN in free-floating systems. A few studies focusing on net ecosystem exchange measures on a short term timescale (daily, seasonal, annual) and/or in laboratory conditions demonstrated that floating mats may represent a net C source21,22.
Here we provide the first, high resolution record of OC and TN AR obtained from a 4 m-deep free-floating mire. The floating island of Posta Fibreno is one of the few surviving in southern Europe. With the exception of
a 3 m-deep floating mat (mainly rhizomes of Scirpus californicus) located in a collapsed crater on Easter Island23,
there are no reports in the contemporary scientific literature about free-floating mires having a comparable thick-ness. The latitude and the sub-Mediterranean climate of Posta Fibreno make it an ecological rarity. Investigating this unique environment, we provide new insights toward understanding OM biogeochemistry in free-floating systems, as well as the first inventories, chronologies and AR of OC and TN for this ecosystem. Finally, we assess the potential of this peculiar ecosystem to be used as high-resolution archive of environmental changes and human activity impact for the past centuries.
“La Rota”, A Fascinating Free-floating Mire
The protected area of “Lake of Posta Fibreno” (Supplementary Information) represents a refuge site for boreal
species24. Here, a free-floating island known as “La Rota”, a relic mire in Central Italy, moves erratically on the
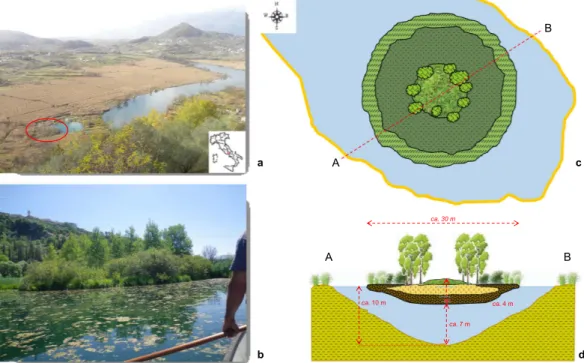
water surface of a submerged doline (sinkhole) annexed to the easternmost edge of the lake (Fig. 1a,b). This island
Figure 1. The Posta Fibreno free-floating island (“la Rota”). (a) View of the Posta Fibreno lake, with a red
circle surrounding the free-floating island (photo by C.Z.). The map in the bottom right corner was created using QGIS v. 2.14 software (http://www.qgis.org/it/site/). (b) the Posta Fibreno free-floating island (photo by C.Z.). (c,d) Schematic representation of the studied free-floating mire (drawn by C.Z.). The 400-cm deep peat profile was collected from the central domed area of the floating island.
www.nature.com/scientificreports/
migrates as a consequence of either the wind or currents induced by subsurface springs. The floating island has a diameter of ~30 m, a submerged thickness of almost 3 m, and the vegetation is arranged in concentric belts, from the Carex paniculata palisade to the Sphagnum palustre center, the latter surrounded by Populus tremula trees which have appeared in the last twenty years (Fig. 1c,d). Here, some of the southernmost European populations of S. palustre occur25.
At Posta Fibreno, the deep water layer below the base of the island (~7 m; Fig. 1d) probably prevented the transition from free-floating island to firm land, thus allowing it to wander on the surface of the lake for centuries.
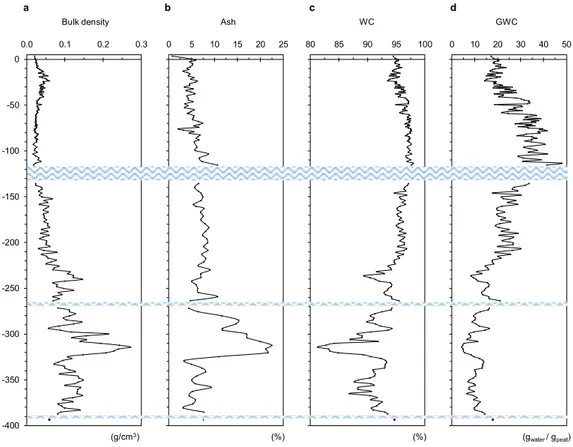
The top 220–230 cm of this free-floating mire consists almost exclusively of S. palustre moss, with stems and leaves of Graminaceae and Cyperaceae species that become more abundant between 100 and 230 cm; below this depth, silty peat rich in stems and leaves of Graminaceae and Cyperaceae species, with abundant roots and limited (< 1%) Sphagnum, occurs (Supplementary Figs S1 and S2). The top 220 cm of the island also shows com-pletely different physical (density, ash content, water content) and chemical (pH, EC) properties compared to the bottom 180 cm of depth (Fig. 2; Supplementary Table S1 and Fig. S3). Further details are provided in the Supplementary Information.
Three thin water layers occur at depths of 117–135 cm, 267–270 cm and 388–392 cm (Supplementary Fig. S1); replicate cores showed that these discontinuities were not created during coring.
OC and TN inventory and corresponding short and long-term AR.
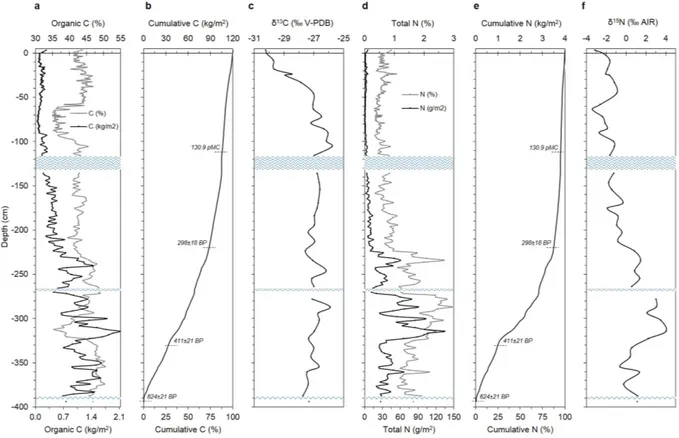
Organic C concentrations along the profile range between 35 and 50%; with the exception of two zones, i.e., between 60–90 cm and 300–325 cm, OC concentrations are quite constant throughout the profile (avg., 43 ± 4%) (Fig. 3; Supplementary Table S1). At thesame time, the average mass of OC stored per unit of surface strongly increases with depth (i.e., 0.13 ± 0.05 kg/m2
in the top 100 cm, 0.37 ± 0.11 kg/m2 between 100 and 200 cm; 0.84 ± 0.32 kg/m2 between 200 and 300 cm, and
1.26 ± 0.34 kg/m2 down to 400 cm of depth) (Fig. 3a). This results in a cumulative OC of 119 kg/m2 of mire
sur-face (corresponding to 245 kgOM/m2), 50% of which stored in the bottom 110 cm; in contrast, the top 100 cm
account for 11% of the OC accumulated in the whole profile (Fig. 3b). The δ 13C signature increases almost linearly
throughout the top 110 cm (from − 30.2 to − 25.8‰), whereas it remains around − 27.0 ± 0.4‰ along the bottom
290 cm of depth (Fig. 3c). Less negative δ 13C values detected below 110 cm of depth suggest the occurrence of a
more decomposed peat, as OM decay generally results in a 13C-enriched residual material as bacteria
preferen-tially metabolize the lighter, 12C-rich fraction.
Total N concentration (avg., 1.0 ± 0.6%) increases with depth, showing values almost always < 1% (avg., 0.6 ± 0.2%) throughout the first 220 cm, and much higher in the remaining 180 cm (avg., 1.8 ± 0.5%), with
Figure 2. Variation of physical properties of peat with depth. The figure illustrates the variation of bulk
density (a), ash content (b), water content (WC) (c) and gravimetric water content (GWC) (d) trend throughout the 400-cm deep peat profile. Blue wavy lines represent water lenses occurring throughout the profile. More details are reported in Supplementary Information.
maximum concentrations ranging between 2.1 and 2.9% at 272–321 cm of depth (Fig. 3; Supplementary Table S1).
As for OC, the average mass of TN stored per unit of surface area also increases with depth (i.e., 1.7 ± 0.9 g/m2
in the top 100 cm, 6.2 ± 2.7 g/m2 between 100 and 200 cm; 34.2 ± 23.2 g/m2 between 200 and 300 cm, and
48.8 ± 26.8 g/m2 down to 400 cm of depth) (Fig. 3d). This results in a cumulative TN of 4.1 kg/m2 of mire surface,
50% of which stored in the bottom 100 cm, whereas the top 100 cm account for less than 5% of the TN
accumu-lated in the whole profile (Fig. 3e). The δ 15N shows values ranging from − 3.4 to + 4.0‰ (Fig. 3f; Supplementary
Table S1). The significantly higher δ 15N values recorded below 200 cm of depth underline, besides a change of the
main peat-forming species, a preferential loss of 14N molecules through kinetic fractionation during biological
transformation26, and thus reflect a greater degree of decomposition26–28.
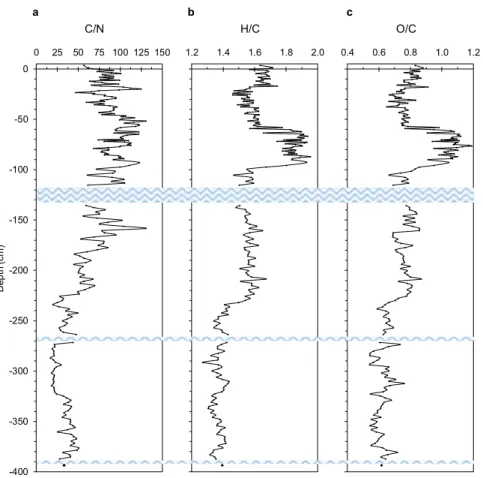
Peat OM accumulated throughout the free-floating island profile is also characterized by a completely differ-ent degree of humification. Here, C/N, H/C and O/C ratios, which are positively correlated among each other
(p < 0.001) and negatively with density and δ 15N (p < 0.001) (Supplementary Fig. S3 and Table S2), generally
decrease with depth, suggesting the occurrence of more humified materials below 220 cm of depth (Fig. 4). The occurrence of very well preserved (almost undecomposed) Sphagnum material in the top 100 cm, and a more humified OM below ca. 200 cm of depth, is very clear also from FT-IR spectra (Supplementary Fig. S3 and Table S4). In fact, peat samples selected from the first 100 cm are characterized by a number of absorption
bands that typically occur in the top, few centimeter-deep layers of Sphagnum-dominated peatlands29,30, whereas
below 200 cm of depth, FT-IR spectra suggest that OM undergone a more pronounced decomposition process (Supplementary Information).
Several authors reported increases of peat thickness due to the Sphagnum growth in the order of 0.07–0.60 kg/
m2/yr, corresponding to 0.03–0.24 kgC/m2/yr, although these values refer to different environmental
condi-tions as well as laboratory incubacondi-tions22,31,32. Here, using radiocarbon (Supplementary Table S3) and 210Pb
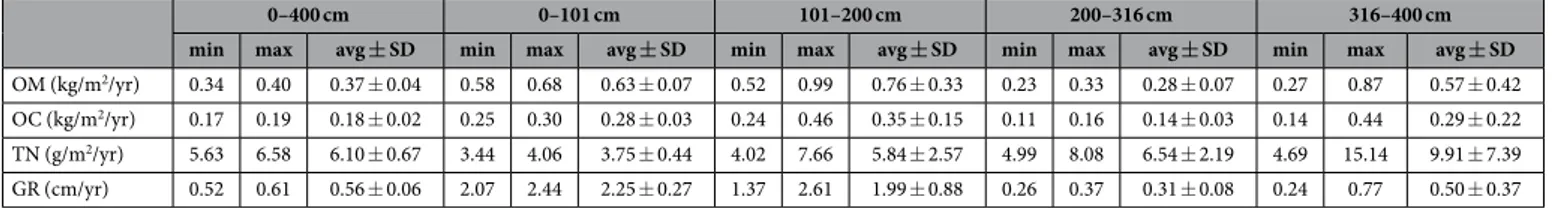
(Supplementary Tables S5 and S6) age dates, we estimated average peat AR on both short and long-term times-cales (Table 1). The top 100 cm, corresponding to the last ~50 yr of peat formation (AD 1964–2012), show an
average AR of 0.28 ± 0.03 kgOC/m2/yr (0.63 ± 0.07 kgOM/m2/yr), that is 3x higher than that reported by Manies
et al.33 for a coeval (< 60 yr) layer of a boreal, moss-dominated rich fen, and an average AR of 3.75 ± 0.44 gTN/
m2/yr, that is higher than that generally found in bogs, but in the range of AR of a variety of mires33. Quite similar
values of AR were found also between 100 and 200 cm of depth, corresponding to a timescale spanning from ca. 1919–1964 (Table 1). So that, 2 m of Sphagnum peat accumulated in ~100 years. Below 200 cm, the average AR of
OM and OC strongly decreases (0.28 ± 0.07 and 0.14 ± 0.03 kg/m2/yr, respectively), whereas that of TN increases
(6.54 ± 2.19 gTN/m2/yr), probably as a consequence of both decomposition and changes in the botanical
Figure 3. Carbon and nitrogen distribution with depth. The figure illustrates the variation of total and
cumulative concentration, as well as of its isotope signature, of both organic C (a–c) and total N (d–f) throughout the 400-cm deep peat profile. Blue wavy lines represent water lenses occurring throughout the
profile. In panels (b) and (e), selected conventional 14C age dates are reported (for details, see Supplementary
www.nature.com/scientificreports/
composition of peat-forming plants. Then, higher AR of both elements (0.29 ± 0.22 kgOC/m2/yr and 9.91 ± 7.39
gTN/m2/yr) were recorded from 315 down to 400 cm of depth (AD 1292–1396 to AD 1492–1602) (Table 1).
This results in estimated, average long-term (700 yr) AR of 0.17–0.19 kgOC/m2/yr and 5.6–6.6 gTN/m2/yr
(Table 1). While long-term OC AR found here is 3–4x higher than that reported by Manies et al.33 for a 1,400 yr
old boreal, moss-dominated rich fen (0.044 ± 0.005 kgC/m2/yr), long-term TN AR is 2x higher than the above
mentioned fen (2.66 ± 0.14 gN/m2/yr; ref. 33), 6–7x higher than that reported for bogs (0.87 gN/m2/yr) by Wang
et al.19 and 11–13x higher than that previously found for peatlands, in general (~0.5 gN/m2/yr; ref. 18). Moreover, while the decadal AR of OC was expected to be higher than the long-term one (1.4x), the decadal AR of TN was
surprisingly lower (0.5x). The average long-term AR of bulk OM (0.34–0.40 kg/m2/yr; Table 1) is comparable
to that reported by Zoltai34 for subarctic peatlands (0.332 kgOM/m2/yr) and ~35% lower than that reported for
boreal peatlands (0.566 kgOM/m2/yr) during the < 1,500 yr period. So, even in sub-Mediterranean climate
con-ditions, characterized by two months summer drought, free-floating islands are important sinks of both elements, with AR comparable with, or higher than, other peatland ecosystems.
How fast can Sphagnum peat accumulate?
14C age dating revealed that the peat column has accumu-lated in less than 700 yr (624 ± 21 yr BP; Cal AD 1293–1396) (Supplementary Table S4), resulting in an average growth rate (GR) of 0.52–0.61 cm/yr (Table 1): this value is, on average, 10x higher than normal in northern European bogs (0.02–0.08 cm/yr; ref. 35). As peat growth and increasing float thickness/weight might result in the separation of some peat material from the bottom of the island, the possibility that the island may have lost deeper older material cannot be excluded. What is surprising is that the top 110 cm, consisting of perfectly preservedSphagnum material, is modern (130.9 ± 0.3 pMC) (Supplementary Table S4), and that, according to Goodsite et al.36, probably accumulated during the last ~50 yr (age also confirmed by 210Pb chronology; Supplementary Table S6). In fact, in the top 200 cm, the estimated average GR is ca. 2 cm/yr (Table 1). One peculiarity of this island is that the annual GR can be measured and not just estimated; in fact, within the top 20–30 cm, Sphagnum moss is separated by an annual input of leaves of Populus tremula (Supplementary Fig. S6). The average GR esti-mated at Posta Fibreno is extremely high (10x) compared with corresponding values from European continental
peatlands, where the top 100 cm represents up to 2,200 yr of peat accumulation35,37,38, and GR averaging around
0.04–0.06 cm/yr. 0.4 0.6 0.8 1.0 1.2 O/C 1.2 1.4 1.6 1.8 2.0 H/C -400 -350 -300 -250 -200 -150 -100 -50 0 0 25 50 75 100 125 150 C/N De pth (c m) a b c
Figure 4. Main atomic ratios variability with depth. The figure illustrates the trend of C/N (a), H/C (b) and
O/C (c) throughout the 400-cm deep peat profile. Blue wavy lines represent water lenses occurring throughout the profile.
The reason for such as abnormal GR in the top 200 cm may lie in the particular environment hosting the free-floating isle (Supplementary Information). Sphagnum mosses lack stomata, rhizoids and water conducting tissues; consequently, their growth, nutrition and vitality depend on the chemical composition of the surrounding
water39. Generally speaking, since most Sphagnum species are sensitive to both high pH and increased
concentra-tions of calcium (Ca) and bicarbonate (HCO3−) in pore water and surface water, their growth in floating systems
is generally more complicated than in bogs40. Harpenslager et al.22, investigating the growth of four different
Sphagnum species on peat floating on Ca- and HCO3−–rich water under laboratory conditions, found that most of them increased their initial biomass (by 600% in the case of S. palustre) and proportionally lowered the pH dur-ing a 12-weeks experiment. This is probably what occurred in the unbuffered and acidic first meter of the Posta Fibreno profile. Here, the high GR combined with low decomposition rate resulted in a fast build-up of the peat layer which slowly reduced the influence of the underlying calcareous water, thus creating an ombrotrophic envi-ronment. In fact, this free-floating island can be classified as a transitional mire with a secondary ombrotrophic local dominance induced by buoyancy. More details about the possible formation of the island and the ecology of
S. palustre are reported in the Supplementary Information. The elevated concentration of dissolved CO2 occur-ring in the water of the karst lake (Supplementary Information) could also have played a positive effect on both
photosynthetic and GRs, as hypothesized by several authors41,42.
Implications for paleo-environmental reconstructions and geochemical studies.
While cores from terrestrial peatlands, and ombrotrophic bogs in particular, have been often (and successfully) used torecon-struct climate and vegetation changes, as well as historical human activity during millennia43–48, almost no
stud-ies are present in literature about the use peat profiles from free-floating mires for such environmental studstud-ies. Reporting the pollen stratigraphy from a 300-cm deep floating mat located in a caldera on the Easter Island, Butler
et al.23 found several anomalous radiocarbon ages throughout the profile; as the possibility that studied mat “flipped over” on more than one occasion could not be ruled out, they questioned the reliability of floating mats as chronological indicators or archives of vegetation changes.
At Posta Fibreno, this phenomenon was not observed; on the contrary, having this island a very high GR (0.5–0.6 cm/yr) compared to terrestrial peatlands (0.02–0.08 cm/yr), it shows a great potential to be used as archive of environmental changes. At the best of our knowledge, such a high detail has been never obtained in coeval peat archives.
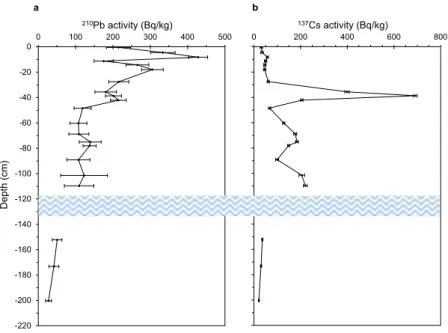
Moreover, 210Pb and 137Cs activity recorded in selected samples throughout the profile (Fig. 5; Supplementary
Table S5) shows a coherent trend, confirming the reliability of this possible record. Although 210Pb activity
var-ied sometimes irregularly with depth, the general trend was a relatively steady decline in activity, from a maxi-mum of 428 ± 26 Bq/kg in the near-surface samples to around 25 Bq/kg in the deepest sample analyzed (Fig. 5a;
Supplementary Table S5), suggesting that the uppermost 200 cm of the core spans a period of around four 210Pb
half-lives (~90–100 yr) (Supplementary Table S6). This is in agreement with 14C measurement carried out on
samples PF2#97 and PFB1#09 (Supplementary Table S4) and is supported by calculations of the mean AR (0.07 g/
cm2/yr or 2.2 cm/yr) determined from the mean gradient of the 210Pb profile49 (Supplementary Table S6). The
137Cs record (Fig. 5b) shows three distinct peaks (around 39, 75 and 110 cm of depth). The most prominent of
these, at ca. 39 cm, records the fallout from the 1986 Chernobyl accident, whereas the two deeper peaks, at ca. 75 and 110 cm, may both date from the period of maximum fallout from the atmospheric testing of nuclear weapons in the early to mid-1960s (Supplementary Table S6 and Fig. S7). The separation of the peaks suggests a period
of more rapid peat accumulation at that time. In support of this, it may be noted that 210Pb concentrations are
relatively uniform over this part of the record. Further, the 14C results suggest near synchronous dates for samples
PF2#97 and PFB1#09. More details are reported in Supplementary Information.
As most of the suitable natural archives, including peat bogs and glacial ices, are restricted to the alpine zone, and considering that the free-floating mire of Posta Fibreno probably consists of the southernmost European
population of Sphagnum25, i.e., one of the southernmost potential peat archives of Europe, it promises to provide
new, high resolution reconstructions of atmospheric deposition and environmental change.
0–400 cm 0–101 cm 101–200 cm 200–316 cm 316–400 cm
min max avg ± SD min max avg ± SD min max avg ± SD min max avg ± SD min max avg ± SD
OM (kg/m2/yr) 0.34 0.40 0.37 ± 0.04 0.58 0.68 0.63 ± 0.07 0.52 0.99 0.76 ± 0.33 0.23 0.33 0.28 ± 0.07 0.27 0.87 0.57 ± 0.42
OC (kg/m2/yr) 0.17 0.19 0.18 ± 0.02 0.25 0.30 0.28 ± 0.03 0.24 0.46 0.35 ± 0.15 0.11 0.16 0.14 ± 0.03 0.14 0.44 0.29 ± 0.22
TN (g/m2/yr) 5.63 6.58 6.10 ± 0.67 3.44 4.06 3.75 ± 0.44 4.02 7.66 5.84 ± 2.57 4.99 8.08 6.54 ± 2.19 4.69 15.14 9.91 ± 7.39
GR (cm/yr) 0.52 0.61 0.56 ± 0.06 2.07 2.44 2.25 ± 0.27 1.37 2.61 1.99 ± 0.88 0.26 0.37 0.31 ± 0.08 0.24 0.77 0.50 ± 0.37 Table 1. Estimated average accumulation rates of peat organic matter (OM), organic C (OC) and total N (TN) at both long-term (0–400 cm; ca. 700 yr) and short-term (from 1964 ± 4 to 2012, i.e. 0–101 cm; from 1919 ± 10 to 1964 ± 4, i.e. 101–200 cm) timescales. Corresponding, estimated average growth rates (GR) are also reported*. *The following age dates have been used for the estimation of minimum and maximum values of accumulation and growth rates: AD 1964 ± 4 for PF B1#04 (at ca. 101 cm), AD 1919 ± 10 for PF B3#03 (at ca. 200 cm), AD 1492–1602 for PF B5#11 (at ca. 316 cm), and AD 1292–1396 for PF B6#19 (at ca. 385 cm)
www.nature.com/scientificreports/
Methods
A complete, 400-cm deep peat profile was collected on 18th July 2012 from the central domed area of the Posta
Fibreno free-floating island (41°41′ 41.8″ N; 13°41′ 30.3″ E; 290 m a.s.l.), where the surface peat layers are clearly elevated up to ~1 m beyond the edge of the isle. The uppermost 100-cm core (core PF2) was collected using a Wardenaar sampler; constructed entirely using a Ti-Al-Mn alloy, it allows removing a monolith 15 × 15 × 100 cm and minimizes compression. The remaining 300-cm were collected using a stainless steel Belarus corer, provid-ing semi-cylindrical peat sections which are 50 cm long and 10 cm wide (Supplementary Fig. S1). Belarus cores (from PFB1 to PFB6) were collected in staggered intervals from two adjacent holes to provide a complete vertical
peat profile, while avoiding the depths affected by the nose cone of the corer itself50. Once collected, Wardenaar
and Belarus cores were photographed, wrapped in polyethylene cling film, placed in specifically-built boxes, brought to the lab and frozen at − 18 °C. Wardenaar and Belarus cores were then cut while frozen in 1.0 ± 0.1 cm and 2.0 ± 0.2 cm slices, respectively, using a stainless steel band saw in the ultra-clean SWAMP lab (University of Alberta, Edmonton, Canada). The edges (~1 cm) were trimmed away from each slice.
Plant macrofossils were isolated from 1.5-cm3 subsamples removed from each even slice (~2 cm intervals).
Four-to-five subsamples were then merged to obtain a significant amount of material to be analyzed; as a con-sequence, obtained final samples were representative, on average, of 11 ± 4 cm thick layers. Subsamples were dispersed in cold water; when the complete dispersion was achieved, samples were washed over 300 and 180-μ m
sieves to retain the larger fraction51. The identification and estimation of the abundance (volume percentage or
absolute numbers) of peat-forming vegetation and charcoal particles was performed in Petri dishes (63.5 cm2)
using a low-power Nikon microscope at 10–20x magnification. All identifiable and uncharred plant remains were picked out with a delicate brush and placed in another Petri dish containing a solution of distilled water, glycerol and 2% formalin (1:1:1) (ref. 52). In identifying macrofossils, the modern vegetation present on the island and in the area was taken into account.
Twelve samples were selected throughout the whole profile, prepared and analyzed for radiocarbon at the Beta
Analytic Inc. laboratory (Miami, USA). Details about specimens analyzed for 14C dating by accelerator mass
spec-trometry (AMS) and pre-treatments carried out are reported in Supplementary Table S4. Generally speaking, in selecting material for AMS radiocarbon dating, Sphagnum remains (stems, branches and leaves) were preferred. For some samples, other above ground plant remains (stems, leaves) or silty peat were used to attain the
mini-mum mass required for dating. The resulting 14C ages were calibrated using IntCal13 calibration curves53 and the
clam software package54.
In addition to 14C, 21 dried samples were analyzed for 210Pb, 226Ra and 137Cs by direct gamma assay in the
Liverpool University Environmental Radioactivity Laboratory using an Ortec HPGe GMX series coaxial low
background intrinsic germanium detector55. 210Pb was determined via its gamma emissions at 46.5 keV, 226Ra by
the 295 keV and 352 keV γ -rays emitted by its daughter isotope 214Pb, and 137Cs by its emissions at 662 keV. The
spectra were also examined for the 59.5 keV 241Am photo-peak but, in all samples analyzed, emissions from this
radionuclide were found to be below the minimum level of detection (~0.002 Bq). The absolute efficiencies of the detectors were determined using calibrated sources and sediment samples of known activity. Corrections were
0 200 400 600 800 137Cs activity (Bq/kg) -220 -200 -180 -160 -140 -120 -100 -80 -60 -40 -20 00 100 200 300 400 500 210Pb activity (Bq/kg) a b Depth (cm)
Figure 5. Concentrations of fallout radionuclides with depth. The figure illustrates the concentration of
total 210Pb (a) and radiocaesium (b) throughout the top, 200 cm deep, section of the peat profile. The blue wavy
line represents the water lens occurring throughout the profile. Supported 210Pb (i.e., 226Ra) concentrations are
extremely low (typically < 2 Bq/kg), reflecting the highly OM content of the peat. Consequently, unsupported
(fallout) 210Pb concentrations are scarcely distinguishable from total 210Pb concentrations. More details are
made for the effect of self-absorption of low energy γ -rays within the sample56. 210Pb dates then were calculated
using the Constant Rate of Supply (CRS) model57.
Bulk density was calculated by dividing the volume of each peat sample by the corresponding dry weight, determined drying samples at 105 °C for 24 hr. The ash content, expressed as a percentage of the initial dry weight, was determined on the outside edges of each peat sample by combustion in a muffle furnace at 550 °C for 12 hr. The water content was determined using equations (1) and (2):
= − ×
WC W D
W 100 (1)
w w
w
where WC is the water content (in %), while Ww and Dw are the wet and the dry weight (at 105 °C), respectively;
=
GWC W
D (2)
m w
where GWC is the gravimetric water content (as gwater/gpeat), Wm is the mass of water and Dw is the weight of dry
peat.
pH and EC were determined on unfiltered porewater samples collected using the squeezing technique
pro-posed by Shotyk and Steinmann58; a Philips pH meter equipped with a Hanna Instruments HI 1230 probe was
used for the pH determination, whereas EC was measured through a XS Cond 510 conductivity meter.
Total C, H, N and S concentrations in peat samples were determined by dry combustion using an ele-mental analyzer (Fisons EA1108, Milan, Italy). The instrument was calibrated using both BBOT [2,5-Bis-(5-tert-butylbenzoxazol-2-yl)-thiophen] and Phenanthrene Enriched standard (Fison/Carlo Erba Italia s.p.a.). Total organic C was determined by difference between total C and inorganic C (TOC = TC–IC), the latter one determined, using the same elemental analyzer, on peat samples pre-dried at 420 °C for 12 h. In this case, urea was used as standard. Oxygen content was calculated by difference: O% = 100 - (C + H + N + S)%. All samples were analyzed in triplicate, and obtained data corrected for ash and moisture content. Ratios between elements (i.e., C/N, H/C and O/C) have been determined as atomic ratios, considering as C concentration those of the TOC. Total C and N mass per unit area has been calculated as the product of their concentration (mg/g), bulk density
(g/cm3) and thickness of each slice (cm); then, their content has been integrated over the depth of the core, and
expressed as mass per unit area of the bog surface (kg/m2).
Isotopic ratios 13C/12C and 15N/14N were determined on selected peat samples (n = 45) by Continuous
Flow-Isotope Ratio Mass Spectrometry (CF-IRMS, Delta Plus, ThermoFisher) coupled with an elemental analyser (CHNS-O mod. EA 1110 ThermoFisher). The Elemental Analyser was interfaced with the IRMS through the Conflo III (Thermo) dosing the samples and the reference gasses (N2 and CO2). The pyrolyser was equipped with a PorapackQS (GC column). Isotopic values were expressed in δ (‰) relative to V-PDB (Vienna-Pee Dee
Belemnite) for carbon (δ 13C), and AIR (Atmospheric nitrogen) for nitrogen (δ 15N), according to equation (3):
δ(‰)=[(Rsample/Rstandard)−1]×1000 (3)
where Rsample and Rstandard are the 13C/12C or 15N/14N ratios of sample and standard, respectively. All analyses were
carried out in triplicate. For δ 13C determination, peat samples were subjected to acid fumigation59 before the
analysis to exclude the influence of carbonates.
The FT-IR spectra were acquired on selected peat samples (n = 60) in transmittance mode using a Thermo Nicolet Nexus FTIR Spectrophotometer equipped with Nicolet Omnic 6.0 software. Potassium bromide pellets were obtained by pressing, under vacuum, a homogenized mixture of 400 mg of infrared grade KBr and 1 mg of
dry sample. Spectra were recorded in the range 4000–400 cm−1, with a 2 cm−1 resolution and with 64 scans for
each acquisition.
Elemental analysis, CF-IRMS and FT-IR were carried out on dried and finely milled peat material; grinding was done using a Retsch agate ball mill (PM 400, Haan, Germany) with 250 mL jars containing three 30 mm balls at 300 rpm for four × 2.3 minutes (first forward, then reverse, then forward, then reverse).
Statistical correlations were performed using the Statistica Version 7 software (StatSoft Inc., 2004). Significant differences were calculated on the basis of the Tukey’s test, considering a significance level of p < 0.05.
References
1. Gaudet, J. J. Uptake, accumulation, and loss of nutrients by papyrus in tropical swamps. Ecology 58, 415–422 (1977). 2. Hogg, E. H. & Wein, R. W. Seasonal change in gas content and buoyancy of floating Typha mats. J. Ecol. 76, 1055− 1068 (1989). 3. Mallison, C. T., Stocker, R. K. & Cichra, C. E. Physical and Vegetative Characteristics of Floating Islands. J. Aquat. Plant Manage. 39,
107–111 (2001).
4. Swarzenski, C. M., Swenson, E. M., Sasser, C. E. & Gosselink, J. G. Marsh mat flotation in the Louisiana delta plain. J. Ecol. 79, 999–1011 (1991).
5. Sasser, C. E., Gosselink, J. G., Swenson, E. M. & Evers, D. E. Hydrologic, vegetation, and substrate characteristics of floating marshes in sediment-rich wetlands of the Mississippi river delta plain, Louisiana, USA. Wetl. Ecol. 3, 171–187 (1995).
6. Sasser C. E., Gosselink, J. G., Swenson, E. M., Swarzenski, C. M. & Leibowitz, N. C. Vegetation, substrate and hydrology in floating marshes in the Mississippi river delta plain wetlands, USA. Vegetatio 122, 129–142 (1996).
7. Battaglia, L. L., Denslow, J. S. & Hargis, T. G. Does woody species establishment alter herbaceous community composition of freshwater floating marshes? J. Coastal Res. 23, 1580–1587 (2007).
8. Clymo, R. S. The limits of peat growth. Philos. Trans. R. Soc. Lond. B 303, 605–654 (1984). 9. Russell, R. J. Flotant. Geogr. Rev. 32, 74–98 (1942).
10. Clark, M. W. Biophysical characterization of floating wetlands (flotant) and vegetative succession of a warm-temperate aquatic ecosystem. Ph.D. Dissertation (University of Florida, Gainesville, USA, 2000).
www.nature.com/scientificreports/
11. Haraguchi, A. Effect of flooding-drawdown cycle on vegetation in a system of floating peat mat and pond. Ecol. Res. 6, 247–263 (1991).
12. Gippel, C. J. Hydrological management of a lake with floating islands near Pirron Yallock, Victoria, Australia. J. Environ. Manage. 37, 219–238 (1993).
13. van Duzer, C. Floating Islands: A Global Bibliography [with an Edition and Translation of G. C. Munz’s Exercitatio academica de
insulis natantibus 1711. (Cantor Press, Los Altos Hills, 2004).
14. Roulet, N. Peatlands, carbon storage, greenhouse gases, and the Kyoto Protocol: Prospects and significance for Canada. Wetlands 20, 605–615 (2000).
15. Turunen, J., Tomppo, E., Tolonen, K. & Reinikainen, A. Estimating carbon accumulation rates of undrained mires in Finland – application to boreal and subarctic regions. Holocene 12, 69–80 (2002).
16. Yu, Z., Beilman, D. W. & Jones, M. C. In Carbon Cycling in Northern Peatlands (eds A. J. Baird, L. R. Belyea, X. Comas, A. S. Reeve & L. D. Slater) 55–69 (American Geophysical Union, Washington, 2013).
17. Tolonen, K. & Turunen, J. Accumulation rates of carbon in mires in Finland and implications for climate change. Holocene 6, 171–178 (1996).
18. Loisel, J. et al. A database and synthesis of northern peatland soil properties and Holocene carbon and nitrogen accumulation.
Holocene 24, 1028–1042 (2014).
19. Wang, M., Moore, T. R., Talbot, J. & Pierre, J. H. R. The cascade of C:N:P stoichiometry in an ombrotrophic peatland: from plants to peat. Environ. Res. Lett. 9, 024003 (2014).
20. Trumbore, S. E., Bubier, J. L., Harden, J. W. & Crill, P. M. Carbon cycling in boreal wetlands: A comparison of three approaches. J.
Geophys. Res. 104, 27673–27682 (1999).
21. Scott, K. J., Kelly, C. A. & Rudd, J. W. M. The importance of floating peat to methane fluxes from flooded peatlands. Biogeochemistry 47, 187–202 (1999).
22. Harpenslager, S. F. et al. Simultaneous high C fixation and high C emissions in Sphagnum mires. Biogeosciences 12, 4739–4749 (2015).
23. Butler, K., Prior, C. A. & Flenley J. R. Anomalous radiocarbon dates from Easter Island. Radiocarbon 46, 395–405 (2004). 24. Casella, L., Agrillo, E. & Spada, F. The floating island of Posta Fibreno: an example of a relic mire in Central Italy. Ann. Bot., 9 pp
(2010).
25. Cortini Pedrotti, C. Check list of the mosses of Italy. Fl. Medit. 2, 119–221 (1992).
26. Nadelhoffer, K. J. & Fry, B. In Stable isotopes in ecology and environmental science (eds K. Lajtha & R. H. Michener) 22–44 (Blackwell, Oxford, 1994).
27. DeNiro, M. J. & Hastorf, C. A. Alteration of 15N/14N and 13C/12C ratios of plant matter during the initial stages of diagenesis: studies
utilizing archaeological specimens from Peru. Geochim. Cosmochim. Acta 49, 97–115 (1985).
28. Zaccone, C. et al. Evaluating the ‘conservative’ behaviour of stable isotopic ratios (δ 13C, δ 15N, and δ 18O) in humic acids and their
reliability as paleoenvironmental proxies along a peat sequence. Chem. Geol. 285, 124–132 (2011).
29. Zaccone, C., Miano, T. M. & Shotyk, W. Qualitative comparison between raw peat and related humic acids in an ombrotrophic bog profile. Org. Geochem. 38, 151–160 (2007).
30. Zaccone, C., Sanei, H., Outridge, P. M. & Miano, T. M. Studying the humification degree and evolution of peat down a Holocene bog profile (Inuvik, NW Canada): A petrological and chemical perspective. Org. Geochem. 42, 399–408 (2011).
31. Gerdol, R. The growth dynamics of Sphagnum based on field measurements in a temperate bog and on laboratory cultures. J. Ecol. 83, 431–437 (1995).
32. Hajek, T. Habitat and species controls on Sphagnum production and decomposition in a mountain raised bog. Boreal Environ. Res. 14, 947–958 (2009).
33. Manies, K. L., Harden, J. W., Fuller, C. C. & Turetsky, M. R. Decadal and long-term boreal soil carbon and nitrogen sequestration rates across a variety of ecosystems. Biogeosciences 13, 4315–4327 (2016).
34. Zoltai, S. C. Estimating the age of peat samples from their weight: a study from west-central Canada. Holocene 1, 68–73 (1991). 35. Aaby, B. & Tauber, H. Rates of peat formation in relation to degree of humification and local environment, as shown by studies of a
raised bog in Denmark. Boreas 4, 1–17 (1975).
36. Goodsite, M. E. et al. High-resolution AMS 14C dating of post-bomb peat archives of atmospheric pollutants. Radiocarbon 43,
495–515 (2001).
37. Poto, L. et al. The first continuous Late Glacial - Holocene peat bog multi-proxy record from the Dolomites (NE Italian Alps).
Quatern. Int. 306, 71–79 (2013).
38. Shotyk, W., Blaser, P., Grünig, A. & Cheburkin, A. K. A new approach for quantifying cumulative, anthropogenic, atmospheric lead deposition using peat cores from bogs: Pb in eight Swiss peat bog profiles. Sci. Total Environ. 249, 281–295 (2000).
39. Clymo, R. S. & Hayward, P. M. In Bryophyte Ecology (ed. A. J. E. Smith) 229–289 (Chapman & Hall, 1982). 40. Clymo, R. S. Growth of Sphagnum – Some Effects of Environment. J. Ecol. 61, 849–869 (1973).
41. Lamers, L. P. M., Farhoush, C., van Groenendael, J. M. & Roelofs, J. G. M. Calcareous groundwater raises bogs; the concept of ombrotrophy revisited. J. Ecol. 87, 639–648 (1999).
42. Raven, J. A. & Colmer, T. D. Life at the boundary: photosynthesis at the soil–fluid interface. A synthesis focusing on mosses. J. Exp.
Bot. 67, 1613–1623 (2016).
43. Aaby, B. Cyclic climatic variations in climate over the past 5500 years reflected in raised bogs. Nature 263, 281–284 (1976). 44. van Geel, B. A palaeoecological study of Holocene peat bog sections in Germany and the Netherlands. Rev. Palaeobot. Palynol. 25,
1–120 (1978).
45. Pheiffer-Madsen, P. Peat bog records of atmospheric mercury deposition. Nature 293, 127–130 (1981).
46. Shotyk, W. et al. History of atmospheric lead deposition since 12,370 14C yr BP from a peat bog, Jura Mountains, Switzerland. Science
281, 1635–1640 (1998).
47. Charman, D. Peatlands and environmental change (eds Wiley & Sons, Chichester, UK, 2002).
48. Zaccone, C., Gallipoli, A., Cocozza, C., Trevisan, M. & Miano, T. M. Distribution patterns of selected PAHs in bulk peat and corresponding humic acids from a Swiss ombrotrophic bog profile. Plant Soil 315, 35–45 (2009).
49. Appleby, P. G. In Tracking Environmental Change Using Lake Sediments (eds Last W. M. & Smol J. P.) 171–203 (Kluwer Academic, 2001).
50. Givelet, N. et al. Suggested protocol for collecting, handling and preparing peat cores and peat samples for physical, chemical, mineralogical and isotopic analyses. J. Environ. Monit. 6, 481–492 (2004).
51. Wasylikowa, K. In Handbook of Holocene Palaeoecology and Palaeohydrology (ed B. E. Berglund) 571–590 (John Wiley & Sons, 1986).
52. Watts, W. A. In Biology and Quaternary Environments (eds D. Walker & J. C. Guppy) 53–67 (Australian Academy of Science, 1978). 53. Reimer, P. J. et al. IntCal13 and Marine13 Radiocarbon Age Calibration Curves 0–50,000 Years cal BP. Radiocarbon 55, 1869–1887
(2013).
54. Blaauw, M. Methods and code for ‘classical’ age-modelling of radiocarbon sequences. Quat. Geochronol. 5, 512–518 (2010). 55. Appleby, P. G. et al. 210Pb dating by low background gamma counting. Hydrobiologia 141, 21–27 (1986).
56. Appleby, P. G., Richardson, N. & Nolan, P. J. Self-absorption corrections for well-type germanium detectors. Nucl. Inst. & Methods B 71, 228–233 (1992).
57. Appleby, P. G. & Oldfield, F. The calculation of 210Pb dates assuming a constant rate of supply of unsupported 210Pb to the sediment. Catena 5, 1–8 (1978).
58. Shotyk, W. & Steinmann, P. Pore-water indicators of rainwater-dominated versus groundwater-dominated peat bog profiles (Jura Mountains, Switzerland). Chem. Geol. 116, 137–146 (1994).
59. Harris, D., Horwath, W. R. & van Kessel, C. Acid fumigation of soils to remove carbonates prior to total organic carbon or carbon-13 isotopic analysis. Soil Sci. Soc. Am. J. 65, 1853–1856 (2001).
Acknowledgements
C.Z. thanks the Municipality of Posta Fibreno, Managing Authority of the Regional Natural Reserve of Lake Posta Fibreno, for allowing peat cores sampling, and the Staff of the Regional Natural Reserve. C.Z. is especially indebted to Enzo Ruma for introducing us to “La Rota” and for his continuous feedbacks, Tommy Noernberg, University of Alberta, Canada, for the help during the peat coring, and Dr. Paola Gioacchini, University of Bologna, Italy, for CF-IRMS measurements.
Author Contributions
C.Z. designed and granted funding for this study, interpreted the results and wrote most of the manuscript. C.Z. and W.S. collected the peat core, that was then prepared by C.Z. and D.L in the ultra-clean SWAMP lab (University of Alberta, Edmonton, Canada) led by WS. D.L., V.D. and C.Z. carried out most of the physical,
chemical and spectroscopic analyses. C.C. led IRMS analysis. P.G.A. led 137Cs, 210Pb and 241Am measurements.
E.B. analyzed and described the botanical composition of peat samples. L.C. described the (paleo)ecology of the island. All authors contributed to the final version of the paper.
Additional Information
Supplementary information accompanies this paper at http://www.nature.com/srep Competing financial interests: The authors declare no competing financial interests.
How to cite this article: Zaccone, C. et al. Highly anomalous accumulation rates of C and N recorded by a relic,
free-floating peatland in Central Italy. Sci. Rep. 7, 43040; doi: 10.1038/srep43040 (2017).
Publisher's note: Springer Nature remains neutral with regard to jurisdictional claims in published maps and
institutional affiliations.
This work is licensed under a Creative Commons Attribution 4.0 International License. The images or other third party material in this article are included in the article’s Creative Commons license, unless indicated otherwise in the credit line; if the material is not included under the Creative Commons license, users will need to obtain permission from the license holder to reproduce the material. To view a copy of this license, visit http://creativecommons.org/licenses/by/4.0/