ORIGINAL PAPER
Social exclusion and financial distress: evidence from Italy
and Spain
Chiara Mussida1 · Maria Laura Parisi2
Received: 30 May 2020 / Accepted: 30 March 2021 © The Author(s) 2021
Abstract
This paper analyzes the phenomenon of severe material deprivation (SMD) in rela-tion to socio-economic characteristics of Italian and Spanish households. Italy and Spain have registered very different shares of severe material deprivation (house-holds that cannot afford a minimum acceptable way of life, which is a social exclu-sion problem) since the 2008–2009 economic crisis, despite having similar experi-ences of poverty as measured in monetary terms. The analysis divides SMD into low-severe (basic or secondary or financial deprivations), medium-severe (when household suffer of two categories of deprivation) and acute-severe (when house-holds suffer from all deprivations) and finds many interesting features associated with these categories. For example, temporary work does not shield a household from acute SMD, especially in the south of both countries, and maximum work intensity does not protect against financial distress in Italy and the Spanish South. These findings should stimulate policymakers, as local policies are needed to allevi-ate social exclusion.
Keywords Severe material deprivation · Households · Italy · Spain
JEL Classification I24 · I32 · J12
* Chiara Mussida [email protected]
Maria Laura Parisi [email protected]
1 Department of Economic and Social Sciences, Università Cattolica del Sacro Cuore, via Emilia Parmense, 84, 29122 Piacenza, Italy
1 Introduction
This paper analyzes the phenomenon of severe material deprivation from a com-parative perspective, investigating its association with the socio-economic charac-teristics of Italian and Spanish households. Severe material deprivation has found a renewed importance with its inclusion in the poverty and social exclusion goal of the Europe 2020 strategy (European Commission 2012). Together with the indica-tors for at-risk-of-poverty and household work intensity, severe material deprivation (SMD) is thus one the EU’s tools for measuring social exclusion and is defined as the process of excluding persons from the minimum way of life acceptable in their respective countries (EU Council of Ministers 1985). The SMD indicator is a condi-tion of multidimensional poverty: deprivacondi-tion of a set of resources and funccondi-tioning that are naturally related to the concept of permanent income, i.e., the level of liv-ing standard that an individual reaches over her lifetime (Ayala et al. 2011). SMD is equivalent to a low standard of living along several dimensions (e.g., Eurostat set 4 dimensions on a 1–9 scale, as explained below). In other words, SMD provides “a more expansive view of households’ wellbeing”, as Ayala et al. (2020) phrase it.
Quantitative non-monetary indicators are combined to give a picture of SMD. The Social Protection Committee for the Europe 2020 strategy adopted these indi-cators to quantify the percentage of households that cannot afford some of the fol-lowing nine items considered by most people to be desirable or even necessary to achieve an adequate lifestyle (Fusco et al. 2013): (1) avoiding arrears (in mortgage or rent, utility bills, or hire purchase instalments), in other words, to make ends meet; (2) a 1-week annual holiday away from home; (3) a meal with meat, chicken, fish, or a vegetarian equivalent every second day; (4) coping with unexpected expenses; (5) buying a telephone; (6) a washing machine; (7) a color TV; (8) a personal car; (9) keeping the home adequately warm. A “deprivation score” ranging from zero to nine counts the number of items a household cannot afford. A person is said to be severely materially deprived if she/he lives in a household with a score greater than or equal to four. Note that the four-item threshold for SMD does not vary from year to year and accommodates naturally for differences in price levels in different parts of a country.
Although the theoretical motivations of multidimensional poverty measures are sound, there are some drawbacks when using the SMD count indicator because its operationalization may be difficult: the number and choice of the items, their hetero-geneity, their validity, the aggregation of the indexes, and the reliability of the scale can be critical (see, e.g., European Commission 2012; Guio & Marlier, 2013).1
In order to reduce the potential drawbacks of the SMD indicator, in this paper we choose to define three components of deprivation by categorizing the nine items into three groups (following suggestions from the existing literature regarding item
1 In an attempt to verify the validity of such indexes, a new measure of material and social deprivation has been formulated (for details, see Guio et al. 2012 and Guio et al. 2017). This is now used by individ-ual member states and by the Commission to monitor material and social deprivation and might officially replace the standard material deprivation indicator.
homogeneity; see Sect. 2) as follows: (1) deprivation of basic needs related to items (1), (2), (3), and (9) (we call this category B—basic); (2) deprivation of secondary needs related to items (5), (6), (7), and (8) (category S—secondary); (3) depriva-tion due to financial distress related to item (4), (category D—financial distress). Unlike the Eurostat SMD score, we rank the levels of deprivation from low-severe, if households fall into a single category, to medium-severe, when households fall into two categories, to acute-severe if a household falls into the three categories of material deprivation (i.e., if it flagged items in each of the three categories).
Empirical evidence reveals that during the Great Recession, all European coun-tries experienced a reduction in employment and per capita income. And yet, the reforms the European Commission suggested regarding social and tax transfer sys-tems lost some of their effectiveness, poverty diffusion enlarged, and deprivation spread amongst a large number of families. In 2017, 7.7% of European households reported having great difficulty making ends meet; among these, 8.8% were sin-gle-female households and 8.6% were households with dependent children (Euro-stat 2020).2 The extent of deprivation was particularly striking for Italy and Spain,
two Southern European countries harshly hit by the Great Recession.3 These two
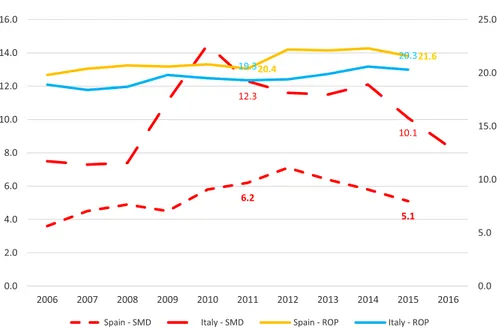
countries represent an interesting case study since stylized facts suggest that despite belonging to the same region, even before the onset of the 2008–2009 crisis they reported heterogeneous percentages of households under severe material deprivation conditions, both far from the European average, despite having similar at-risk-of-poverty rates4 (see Fig. 5 in “Appendix”). In 2006, Eurostat estimated that 9.9% of
the European population was severely materially deprived. At the time, the official Eurostat SMD indicator was below the EU average in Italy (6.4%), and even more so in Spain (4.1%). This difference increased after the crisis: in 2017, when the EU share was 6.6%, the percentage for Spain was still below average (5.1%), while the share for Italy was above average and almost twice as much as the Spanish share (10.1%).5
Why do countries that are similar in their economies and labor markets show different patterns of severe material deprivation? Series of the risk-of-poverty rate and SMD suggest a positive correlation in Italy while the association looks weaker in Spain, especially before the Great Recession (Ayala et al. 2011; Martínez &
2 Figures available from Eurostat: https:// appsso. euros tat. ec. europa. eu/ nui/ show. do? datas et= ilc_ mdes0
9& lang= en
3 In fact, in 2017 9.5% of Spanish households reported great difficulty in making ends meet, in compari-son to 8.6% of Italian households. This gap is even larger for households with dependent children and for single-female households (Eurostat 2020).
4 The at-risk-of-poverty rate is defined as the fraction of people living with an equivalized income below 60% of the national median income. Equivalized income is defined as the total disposable income (after taxes and social transfers) divided by an equivalized household size calculated according to the modified OECD scale. Such a scale assigns a weight of 1.0 to the first adult, 0.5 to the second and each subsequent person aged 14 and over, and 0.3 to each child under 14. We use this definition in our income quintile distribution in the regression analysis, as explained later. The at-risk-of-poverty rates were 20.3% in Italy and 19.3% in Spain in 2006 and 21.6% in Italy and 20.3% in Spain in 2017.
5 Figures available from Eurostat: for at-risk-of-poverty rates, see. https:// appsso. euros tat. ec. europa.
eu/ nui/ submi tView Table Action. do; for SMD, see https:// appsso. euros tat. ec. europa. eu/ nui/ submi tView Table Action. do (Fig. 5 in “Appendix” shows SMD and at-risk-of-poverty rates for Italy and Spain for the period of 2006–2017).
Navarro, 2016). The correlation indeed varies significantly across European coun-tries (Salcedo & Izquierdo Llanes, 2019). That is why we should observe stronger income-related aspects of deprivation, such as financial distress, in Italy compared to Spain. A second explanation of the difference involves household preferences and priorities regarding what they consider essential or optional to their lifestyle, even with respect to food consumption (e.g., Gracia & Albisu, 2001). If we rely on coun-try data on quality of life, 27% of individuals in Italy report having a low level of satisfaction with respect to their own finances [with a score going from 5.7 (out of 10) in 2013 to 6.4 in 2018, close to the EU average)], compared to 32.5% of Spanish individuals (Eurostat, 2019). The overall index of life satisfaction, on the other hand (despite being an immaterial concept), reports an equivalent percentage of unsatis-fied people in both countries (15.7%). Third, the difference can be related to house-hold characteristics, such as size, labor market status, gender, education, and home ownership (see, for instance, Poggi, 2007).
First, we qualitatively assess the distribution of household features between the two countries. Second, we analyze whether severe material deprivation is associated with labor market status and household circumstances (economic household fea-tures, i.e., the number of employed persons in the household, the number of tempo-rary workers, and the (average) work intensity status of the household). While there is a significant literature on the determinants of income poverty, there are fewer studies relating severe deprivation with economic household features in different countries. In this paper, we aim to fill this gap. Moreover, we analyze whether the gender and education level of the head of household affect the relative probability of being severely deprived (at all intensities).
In the years following the financial crisis, in Europe the economic and politi-cal debate has focused on how to respond to the issue of alleviating (poverty and) SMD. Policy schemes such as the minimum insertion income in Spain have shown their weaknesses after the crisis, and sparse interventions in health care, educa-tion, and employment have been undertaken, with only rare actions towards poverty and social exclusion, such as the successful initiative in the Comunidad Valenciana (Martìnez-Lòpez 2019). The discussion on policy interventions to combat SMD is still open, with the issues debated strongly both in Italy and in Spain, and this paper offers some evidence to help design and implement more targeted strategies.
The paper proceeds as follows. Section 2 offers a review of the existing literature on SMD. Section 3 describes the microdata and the indicators used in our analysis of SMD in Italy and Spain. Section 4 introduces the econometric methodology, and Sect. 5 discusses the empirical results. Section 6 offers some concluding remarks and policy recommendations.
2 Literature review
Since the Great Recession, awareness of the limitations of the conventional income poverty approach has increased and more attention has been given to the role that non-monetary measures of material deprivation can play in improving our under-standing of poverty and social exclusion, with the aim of designing more effective
anti-poverty policies (Whelan & Maître, 2012). Moreover, material deprivation indicators are useful for country comparisons because contrary to relative monetary poverty indicators, they reflect absolute aspects of poverty (Dudek, 2019).
The literature on (severe) material deprivation can be divided into two main strands: one analyzes the relationship between the indicators for material depriva-tion and at-risk-of-poverty (e.g., Fusco et al. 2010; Whelan et al. 2001, 2002, 2004) across countries, and the other elaborates on the measurement and determinants of material deprivation (e.g., Bárcena-Martín et al. 2014; Whelan & Maître, 2012), offering cross-country comparisons.
Regarding the relationship between material deprivation (and its categories or dimensions) and poverty, the evidence for European countries is mixed (Salcedo & Izquierdo Llanes, 2019). Whelan et al. (2004), for instance, use the European Com-munity Household Panel (ECHP) dataset to understand the ways in which the deter-minants of material deprivation and poverty, as well as their persistence over time, differ. The factors investigated include education, employment status, social class, household type, marital status, and illness. Italy and Spain are among the nine coun-tries in the sample. The findings suggest that employment precariousness, the num-ber of children, marital status (divorced), single parenthood, and female gender are related to material deprivation persistence over time, while social class and educa-tion are more related to poverty persistence. Notably, however, the indicator of pov-erty and the indicator of material deprivation in that paper do not identify the same set of households (individuals) as poor.
Whelan et al. (2002) instead analyze the extent of persistent poverty across coun-tries and how it relates to different lifestyle deprivations. They use ECHP panel data, and the unit of analysis is the individual. They examine 11 European countries including Italy and Spain. They consider five categories of material deprivation: “basic lifestyle deprivation” (lack of resources to buy food and clothing, holidays not even once per year, worn-out furniture, experience of arrears for scheduled pay-ment); “secondary lifestyle deprivation” (lack of resources to buy a car, a phone, a color TV, a video recorder, a microwave, a dishwasher); “housing facilities” (lack of resources for services, such as the availability of a bath or shower, an indoor toilet, and running water); “housing deterioration” (existence of a leaking roof, dampness, rotting floors and windows); and “environmental problems” (noise, pollution, van-dalism, crime, inadequate space and light). They find that on average across coun-tries, the persistently poor have basic deprivation scores that are 0.89 standardized units higher than all other individuals (0.95 in Italy, 0.96 in Spain). They also have secondary deprivation scores that are 0.72 standardized units higher than other indi-viduals (0.49 in Italy, 0.91 in Spain). The persistently poor are exposed to a rela-tively higher risk of deprivation. It is clear that many factors other than persistent income poverty play a role in determining deprivation and that these factors vary across types of deprivation.
Fusco et al. (2010) analyze the relationship between income poverty and material deprivation in 25 European countries, aiming to identify the most important fac-tors that determine the risk of being income poor and/or materially deprived. The analysis focuses on the 2007 cross-sectional European Union Statistics on Income and Living Conditions (EU-SILC) individual data. National correlations, at the
individual level, between the level of equivalized income and the intensity of mate-rial deprivation, are all below − 0.5, and this is in line with findings obtained in pre-vious research (e.g., Ayllón et al., 2007; Layte et al., 2001). These results show that there is definitely a link between income poverty and material deprivation measures but that income alone can fail to identify individuals who may be excluded from “the minimum acceptable way of life in the Member State to which they belong” (and vice versa: deprivation alone can fail to identify income-poor people). The explanatory variables used to characterize material deprivation and income poverty are factors related to needs and resources. Factors related to needs include character-istics such as the household structure or the presence of individuals in poor health in the household, which increase the level of resources necessary for a household to maintain its standard of living. Factors related to resources are those that impact on the level of current income, such as the work attachment of household members or the presence of highly educated persons in the household. According to Fusco et al.’s (2010) results, income poverty and material deprivation measures are clearly associated.
Finally, Whelan et al. (2001) find a weak relationship between poverty and mate-rial deprivation. Matemate-rial deprivation is measured by five dimensions: basic lifestyle deprivation; secondary lifestyle deprivation (includes items that are less likely to be considered essential); housing facilities or housing services such as the availability of a bath or shower, an indoor flushing toilet, and running water, which are essential; housing deterioration or the existence of problems such as a leaking roof, damp-ness, or rotting window frames and floors; and environmental problems. In general, the relationship between the two measures is weak because of vague definitions and updating of the dimensions of deprivation.
Regarding measurement and the determinants of material deprivation, Whelan and Maître (2012) stress the importance of non-monetary aspects, because of the limitations on income and related poverty measures. The authors analyze and pin-point the importance of examining several dimensions of material deprivation, such as basic needs like consumption, household health, neighborhood environment, and access to public facilities. They use 2009 EU-SILC cross-sectional data, and the analysis is carried out at the household level. They find that basic deprivation, which is enforced deprivation related to decisively basic items (such as meals, clothes, holidays), is the most important dimension of deprivation and turns out to be the most reliable measure for comparative analysis in Europe. This indicator shows the strongest relationship to any of the deprivation aspects from household income to subjective economic stress. The most important determinants of deprivation are household characteristics and household socio-economic factors, compared to macro-economic factors related to average levels of disposable income and income inequality.
Bárcena-Martín et al. (2014) assess to what extent differences in individual char-acteristics such as gender, age, housing deprivation, education, the employment sta-tus of household members, the presence of unemployed and/or inactive people in the household, self-employed individuals, individuals working few hours, the type of household (micro-level perspective), and country-specific factors, such as cultural attitudes and institutions (macro-level perspective), can explain country differences
with respect to material deprivation. Their findings suggest that macro-perspective variables are much more relevant in explaining country differences in material dep-rivation compared to micro-level ones.
To conclude, the available literature has inspired us to explore the determinants of the main categories or dimensions of severe material deprivation and to investi-gate why two Southern European countries similar in many respects differ substan-tially in their indicators of severe material deprivation. From the first strand of lit-erature, we learn that despite the relationship between income poverty and material deprivation being mixed, material deprivation has found renewed importance as a measure of social exclusion. Moreover, to understand the phenomenon, it is impor-tant to analyze several dimensions or components of severe material deprivation, primarily because these dimensions show different correlations with income poverty (e.g., Whelan et al. 2001; Whelan et al., 2002; Whelan and Maitre 2012). From the second strand, we get a clear picture of the main determinants of severe material deprivation, both at the household and at the individual level. We are interested, in particular, in the economic features of households suffering from severe material deprivation at increasing intensities.
3 Data and indicators
We use data from the EU-SILC survey, which is based on a methodology and defini-tions that have been standardized across most members of the European Union (see Eurostat, 2010 for information and technical details about the EU-SILC database). The topics covered by the survey are living conditions, income, social exclusion, housing, work, demographics, and the education of individuals. We select cross-sec-tional data for Italy and Spain for the year 2017, corresponding to the income year 2016.
As explained in Sect. 1, we are interested in quantifying the intensity of severe material deprivation. We decided to group the survey items together (deprivation categories) for at least two reasons. First, as explained in the Introduction, the SMD indicator suffers from some important drawbacks, one being the heterogeneity of the items considered. Second, the literature (see Sect. 2) suggests the importance of grouping the survey items into categories or dimensions of deprivation according to their homogeneity. This allows for a more precise investigation of the phenom-enon of SMD. We choose to group the survey items into the following categories of deprivation according to their homogeneity: (1) deprivation of basic needs related to items (1), (2), (3), and (9) (we call this category B—basic); (2) deprivation of secondary needs related to items (5), (6), (7), and (8) (category S—secondary); (3) deprivation due to financial distress related to item (4), (category D—financial
dis-tress). We rank the levels of deprivation from low-severe, if households fall into a
single category (B, S, or D), to medium-severe, when households fall in two com-bined categories ( B ∩ S, B ∩ D, S ∩ D ), to acute-severe, if a household falls into the three categories of material deprivation (i.e., if it flagged items in each of the three categories, B ∩ S ∩ D ). In this way, we are able to capture the severity of SMD for each household.
Table 1 shows the (weighted) estimated percentage of households flagging (i.e., not having the ability to pay for) each item included in the SMD calculation, for Italy and Spain, to offer a measure of both their within-country importance and of the differences between countries.
The capacity to afford a 1-week holiday away from home is the most important item of the Basic category, and especially in Italy: 43% of Italian households can-not afford to pay for a 1-week holiday away, compared to 34.3% of Spanish house-holds. Again, for Italy, the capacity to afford a meal and the ability to keep one’s home warm are relatively important, while their relevance is negligible in Spain. As a result, the category of basic needs is more frequently flagged in Italy compared to Spain, with an estimated share of 0.133 in Italy compared to 0.098 for Spain. The secondary needs category is the least relevant in both countries (share of 0.009 in Italy and 0.013 in Spain). The most important category is financial distress, that is, the inability to afford unexpected expenses, with a share of 0.383 in Italy and 0.366 in Spain. As noted previously, deprivation in Italy is almost twice as high as in Spain (10.1% for Italy, and 5.1% for Spain). These differences between countries in terms of the overall SMD, and especially between the categories of SMD, inspired the investigation of their main determinants.6
The dependent variable in our econometric analysis is a categorical indicator for SMD. It includes seven categories, taking non-deprivation as the base category. The first three categories are those explained above (B, S, D), to which we add four non-overlapping combinations of categories (basic and secondary B ∩ S , basic and distress B ∩ D , secondary and distress S ∩ D , and basic, secondary, and distress
B∩ S ∩ D).
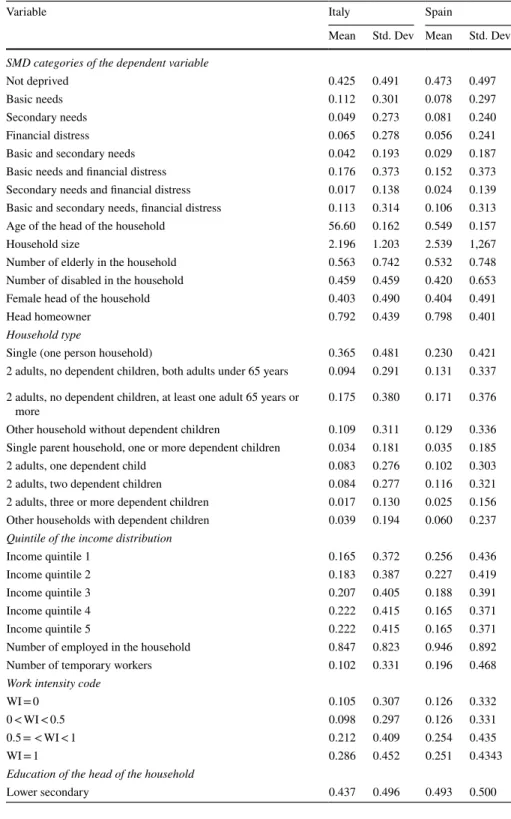
Table 7 in “Appendix” shows that the percentage of not materially deprived households is higher in Spain (47.3%) than in Italy (42.5%). Among the households experiencing deprivation, we find that 17.6% in Italy and 15.2% in Spain suffer from both basic needs and financial distress, while 11.3% of Italian households and 10.6% of Spanish households suffer from deprivation in all categories analyzed, that is, they experience the acute-severe form of SMD.
Inspired by the existing literature (see Sect. 2), among the variables of interest we choose gender, education, and homeownership of the head of household, and labor market features of the household such as the number of employed members, the number of temporary workers, and the average work intensity.7 Other control
7 Work intensity measures the share of worked months over the total workable months for all working-age household members, defined as members between 18 and 59 years old, with the exclusion of students in the age group between 18 and 24 years.
6 The fact that the financial distress component and some of the basic needs items are similar in the Italian and Spanish data while the aggregate data is so different may hide some heterogeneity among deprivations between individuals, with a composition effect. Unfortunately, this set of EU-SILC items related to deprivation is available only at the household level; therefore, we can exploit only household heterogeneity in both countries.
variables include household size, average age, the presence of elderly persons (aged 65 years or more), the number of disabled members, urbanization, and country and region dummies. Considering that the burden of SMD differs by household type, we also control for the type of household. The EU-SILC data allows controlling for nine types of households.8 Finally, we account for the relationship between income and
SMD by including controls for quintiles of the distribution of the equivalized house-hold income.9 We discuss the results only for the variables of interest.
4 Methodology
The form of our dependent variable naturally requires a multinomial logit method of estimation. The log-odds of outcome m, given a set of K conditional variables and with respect to a base outcome b, can be expressed by the following (1):
Where categories m ∈ {NonSMD, B, S, D, B ∩ S, B ∩ D, S ∩ D, B ∩ S ∩ D} are mutu-ally exclusive and b = base outcome = non-SMD (not in material deprivation). Refer-ring to our classification of items explained in Sect. 1, households that flagged items about basic needs deprivation but no other items fall into category B. In category S fall households that flagged questions about secondary deprivation only, and D includes households in financial distress (only). We then add four combinations of the three main categories, B ∩ S, B ∩ D, S ∩ D, B ∩ S ∩ D , according to the items flagged by each household. The coefficient 𝛽k,m∕b for k = 1 … K measures the change
in the log-odds of outcome m given a one-unit increase in the explanatory variable
xk∀k . From (1), it is possible to derive the predicted probability of falling into a cat-egory of deprivation and its relative risk ratio, conditional on household characteris-tics and region/countries dummies.
In the results section, we report and discuss the estimated ̂𝛽k,m∕b , the relative risk
ratios, and the predicted probabilities for the four outcomes B, S, D, B ∩ S ∩ D , for the sake of brevity.
(1)
lnP(y = m|x)
P(y = b|x) = 𝛽0,m∕b+ 𝛽1,m∕bx1+ ⋯ + 𝛽K,m∕bxK+ 𝜀,
8 Household types: single; 2 adults without dependent children, both adults under 65 years of age; 2 adults without dependent children, with at least one adult 65 years or over; other household without dependent children; single-parent household with one or more dependent children; 2 adults, one depend-ent child; 2 adults, two dependdepend-ent children; 2 adults, three or more dependdepend-ent children; other household with dependent children (Table 7).
9 Issues of endogeneity or reverse causality cannot be raised here as far as income quintiles: SMD is not means testing and is not clearly associated with current income.
5 Discussion of the results
Table 2 below reports the β-coefficients, standard errors of the estimates, and rela-tive risk ratios of the variables of interest resulting from model (1) estimation.10
Table 3 reports the unconditional predicted probabilities of the dependent varia-ble outcomes, as a test of model fit. Such probabilities show that even if the explana-tory variables have significant effects (as the LR-test is significant at the 1% level), much of the variation in SMD outcomes is not explained (pseudo R2 = 0.188). In the
following subsections, we offer a discussion according to the categories of the most relevant determinants of SMD, which we divide into employment and economic fea-tures of the households (Sect. 5.1), and gender and education of the head of house-hold (Sect. 5.2).
5.1 Employment and economic features of households 5.1.1 Employment and temporary work
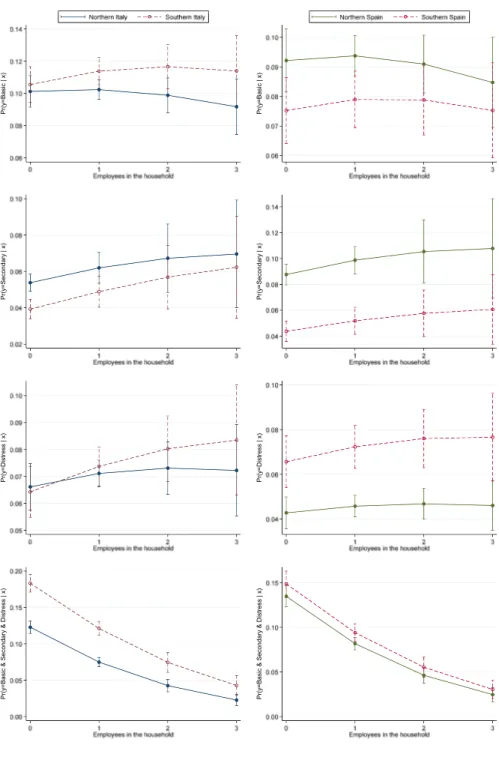
From Table 2, we note that the number of employees in a household is negatively associated with all categories of deprivation, while the number of temporary workers increases the risk of all deprivations. We explore these findings by offer-ing additional evidence (Tables 4 and 8; Figs. 1, 2). It is interesting to note that in the two countries, there is some discrepancy regarding the labor market features of households. Table 4 shows that households with only 1 permanent worker are more common in Italy than in Spain (38% versus 31.7% of households, respec-tively). On the other hand, Spanish households with two workers (either employees or self-employed) are more common than in Italy (25.7% in Spain versus 19.4% in Italy). For three or more working members, the frequency is 3.9% of all households in Spain and 2.6% in Italy. In order to quantitatively assess the probability of depri-vation for different numbers of permanent workers, Fig. 1 shows the predicted prob-ability from model (1) for increasing numbers of permanent workers in the house-hold. The probability of experiencing basic needs deprivation is hump-shaped when the number of permanent workers increases. The estimated probability goes from as low as 7.5% in the south of Spain (with zero employees) to 12% in the south of Italy (with three or more workers), and northern regions are in between. This evidence shows that employment shields households at least from the risk of basic needs deprivation. On the other hand, the number of permanent workers is associ-ated with an increasing probability of experiencing secondary deprivation for both countries, as suggested by the literature (e.g., Berthoud & Bryan, 2011; Eurostat,
10 As a robustness check, we estimated a multilevel mixed-effects model to investigate to what extent differences in household characteristics (level one) and country-specific factors (level two) can explain country differences in the proportion of households suffering from material deprivation. The results indicate that our estimates are robust to the methodology applied to these data, whether a multinomial or multilevel mixed-effects model; for this reason, we do not report this robustness check in the paper. Nonetheless, results are available upon request.
Pr(y =Basic | x) Pr(y =Basic | x) Pr(y =Secondar y| x) Pr(y =Secondar y| x) Pr( y= Distress |x ) Pr( y= Distress |x ) Pr(y =Basic &S econdar y& Distress |x ) Pr(y =Basic &S econdar y& Distress |x ) Pr( y= Ba si c |x ) Pr( y= Second ar y | x ) P r( y=Distress |x ) Pr( y= Ba sic & Se conda ry & D is tre ss |x)
2012). The estimated probability goes from as low as 4% in the south of Italy (with zero employees) to 11% in northern Spain (with three or more employees). Employ-ment seems to not protect households from secondary needs deprivation, especially in Spain. Again, the probability of being only financially distressed grows with the number of permanent workers in the south of Italy and the south of Spain (from 6.5% with zero workers to 8.5% with three or more). The same probability is quite stable for northern regions in both countries (on average, 5%). Finally, a clear nega-tive path exists between the probability of falling into B ∩ S ∩ D when the number of workers increases, and this is an important shield effect of employment against acute-severe material deprivation. For example, the south of Italy has a probability as high as 20% with zero workers, which drops to less than 5% with three or more. The role of employment in reducing the severity of SMD is supported by the exist-ing literature (see, for instance, Addabbo et al., 2015). These findexist-ings suggest that further attention should be paid to the strengthening of active labor market policies that can improve job matching and reduce structural unemployment exacerbated by the Great Recession, both in Italy and Spain (Pinelli et al., 2017).
Table 4 also shows that 14.3% of Spanish households include one temporary worker, versus 8.6% of Italian households. Moreover, 2.2% of Spanish households include 2 temporary workers, versus 0.7% of Italian households. These numbers
Table 1 Estimated shares for severe material deprivation on each item in Italy and Spain
Average share for each deprivation category is shown in bold
Weighted estimates and standard errors for the items and components of SMD Source: Authors’ calculations on EU-SILC 2017 data
Item Share Italy St. err Italy Share Spain St. err. Spain
Basic needs (B) 0.133 0.007 0.098 0.005
Capacity to afford paying 1 week holiday away
from home 0.430 0.009 0.343 0.007
Capacity to afford a meal with chicken, meat, fish (or vegetarian equivalent) every second day
0.134 0.007 0.037 0.003
Ability to keep home adequately warm 0.152 0.007 0.008 0.004
Arrears on mortgage or rent payment 0.026 0.002 0.038 0.003
Arrears on utility bills 0.048 0.003 0.074 0.004
Arrears in hire purchase instalments or other
loan payments 0.005 0.001 0.002 0.002
Arrears total 0.061 0.004 0.093 0.005
Secondary needs (S) 0.009 0.001 0.013 0.001
Do you have a telephone? 0.004 0.001 0.002 0.001
Do you have a colour tv? 0.002 0.001 0.001 0.000
Do you have a washing machine? 0.002 0.001 0.002 0.001
Do you have a car? 0.027 0.003 0.047 0.003
Financial distress (D) 0.383 0.008 0.366 0.007
Capacity to face unexpected financial expenses 0.383 0.008 0.366 0.007 Severely materially deprived households 0.101 0.005 0.051 0.004
Table
2
Es
timation r
esults f
or model (1): β coefficients and r
elativ e r isk r atios Basic Secondar y Dis tress B ∩ S ∩ D β SE rrr β SE rrr β SE rrr β SE rrr Female head 0.119*** 0.043 1.126 0.872*** 0.055 2.392 0.109** 0.051 1.116 0.944*** 0.047 2.569 Homeo wner − 0.335*** 0.052 0.715 − 0.652*** 0.069 0.521 − 0.549*** 0.057 0.578 − 1.736*** 0.054 0.176 #w or kers − 0.242*** 0.051 0.785 − 0.168* 0.099 0.846 − 0.173*** 0.064 0.841 − 0.925*** 0.075 0.397 #tem por ar y 0.426*** 0.051 1.531 0.305*** 0.109 1.356 0.138** 0.064 1.148 0.873*** 0.071 2.395
Household type—base outcome type 5 Type 6(a)
− 0.165* 0.096 0.848 − 0.941*** 0.255 0. 390 − 0.124 0.119 0.883 − 1.480*** 0.125 0.228 Type 7 − 0.201** 0.096 0.818 − 1.424*** 0.252 0.241 0.055 0.136 1.057 − 1.894*** 0.126 0.150 Type 8 − 0.139 0.153 0.870 − 1.000** 0.504 0.368 − 0.125 0.216 0.882 − 2.027*** 0.217 0.132 Type 9 0.049 0.137 1.050 − 0.369 0.317 0.691 0.115 0.164 1.122 − 1.159*** 0.162 0.314 Type 10 − 0.180 0.135 0.835 − 0.431 0.466 0.650 − 0.025 0.184 0.976 − 1.990*** 0.194 0.137 Type 11 − 0.331** 0.180 0.718 − 0.070 0.683 0.932 − 0.072 0.256 0.931 − 2.371*** 0.259 0.093 Type 12 − 0.161 0.265 0.851 1.534 0.942 4.635 0.083 0.372 1.087 − 1.984*** 0.366 0.138 Type 13 − 0.044 0.222 0.957 − 0.563 0.793 0.570 0.174 0.313 1.190 − 2.165*** 0.331 0.115 Quintile of t he income dis tr
ibution – base outcome Income q
uintile 1 Income q uintile 2 − 0.206*** 0.065 0.814 − 0.106 0.083 0.900 − 0.177* 0.078 0.837 − 0.624*** 0.062 0.536 Income q uintile 3 − 0.492*** 0.066 0.611 − 0.299*** 0.082 0.742 − 0.481*** 0.079 0.618 − 1.273*** 0.068 0.280 Income q uintile 4 − 0.846*** 0.070 0.429 − 0.747 0.088 0.474 − 0.700*** 0.081 0.496 − 1.831*** 0.079 0.160 Income q uintile 5 − 1.079*** 0.075 0.340 − 0.970*** 0.093 0.379 − 1.090*** 0.089 0.336 − 2.283*** 0.095 0.102 W or k int
ensity code—base outcome WI
= 0 0 < WI < 0.5 0.211** 0.088 1.235 − 0.037 0.184 0.963 0.117 0.115 1.124 − 0.196* 0.115 0.822 0.5 ≤ WI < 1 0.212** 0.092 1.236 0.327** 0.156 1.386 0.226** 0.112 1.253 0.118 0.112 1.125 WI = 1 − 0.109 0.107 0.897 − 0.009 0.158 0.991 0.266** 0.128 1.305 − 0.325*** 0.115 0.723 Out of ag e WI − 0.278*** 0.095 0.758 0.161 0.154 1.174 0.039 0.128 1.040 0.477*** 0.109 1.611
*𝛼 ≤ 1 0 % , ** 𝛼 ≤ 5 % , *** 𝛼 ≤ 1
% . The base outcome is t
he ‘N
ot depr
iv
ed’ g
roup. Contr
ols include all t
he v ar iables in T able 7 no t r epor ted her e f or t he sak e of br evity . Sour ce: A ut hors ’ calculations on EU-SIL C 2017 dat a Table 2 (continued) Basic Secondar y Dis tress B ∩ S ∩ D β SE rrr β SE rrr β SE rrr β SE rrr Education of t he head of t he household—base outcome N one, element ar y or lo wer secondar y education Secondar y education − 0.380*** 0.047 0.684 − 0.419*** 0.068 0.657 − 0.277*** 0.058 0.758 − 1.201*** 0.059 0.301 Ter tiar y education − 0.763*** 0.058 0.466 − 0.434*** 0.075 0.648 − 0.553*** 0.067 0.575 − 2.041*** 0.086 0.130 Region—base outcome N or ther n It al y Centr al It aly 0.471*** 0.055 1.601 − 0.159* 0.085 0.853 − 0.132* 0.073 0.876 − 0.017 0.072 0.983 Sout her n It aly 0.470*** 0.060 1.600 0.133 0.091 1.142 0.387*** 0.071 1.472 1.002*** 0.066 2.723 Nor ther n Spain − 0.256*** 0.059 0.774 0.781*** 0.069 2.185 − 0.525*** 0.073 0.592 0.163** 0.067 1.177 Centr al Spain − 0.861*** 0.093 0.423 0.684*** 0.090 1.981 − 0.051 0.086 0.950 − 0.018 0.088 0.982 Sout her n Spain − 0.309*** 0.085 0.734 0.060 0.118 1.062 0.041 0.092 1.042 0.372*** 0.087 1.451 Cons tant − 0.242 0.165 − 0.918*** 0.323 0.391** 0.197 2.305*** 0.183
reflect official data. According to Spanish Ministry of Labor statistics (Encuesta
Anual Laboral), in 2017 29% of Spanish workers had a temporary contract
(rang-ing from 24.6% in Aragòn to 41.9% in Andalucìa). The OECD claimed that addressing the “abuse” of temporary contracts was a top priority for the Spanish government (OECD 2018). Indeed, a high and persistent share of temporary jobs increases unemployment risks, especially for the youth, and reduces productivity and wage growth (OECD Reform Agenda for 2017: overview and country notes). In the same year, Italy was less exposed to such phenomena given that only 15.4% of dependent employees were temporary (OECD 2020),11 mainly because
tem-porary employment was reduced during the Great Recession (Piazzalunga & Di Tommaso, 2019). In this paper, we show that households with temporary workers suffer from another important risk, i.e., the probability of being severely materi-ally deprived. The probability of being deprived of needs that we classified as basic increases by about 2 percentage points in both countries with an increasing
Table 3 Observed and predicted probabilities of outcomes of the dependent variable
Source: Authors’ calculations on EU-SILC 2017 data n Observed % Predicted probabil-ity % Italy Spain Not deprived 15,926 44.32 59.1 56.5 62.8 Basic (B) 3562 9.91 12.8 13.6 11.0 Secondary (S) 2207 6.14 17.0 12.3 21.5 Distress (D) 2230 6.21 7.9 8.1 7.4 B∩ S 1333 3.71 10.8 12.0 7.9 B∩ D 6009 16.71 26.9 26.8 27.2 S∩ D 696 1.94 4.8 4.3 5.4 B∩ S ∩ D 3975 11.06 31.2 32.1 29.8 Total 35,938 100
Table 4 Distribution of households with employees/self-employed and temporary workers
a The category ‘3+’ include households with 3, 4, 5, and 6 employees or self-employed, and temporary workers. Source: Authors’ calculations on EU-SILC 2017 data
Employees/
self employed Italy % Spain % Temporary workers Italy % Spain %
0 8883 40.0 5315 38.8 0 20,150 90.6 11,405 83.2
1 8445 38.0 4352 31.7 1 1908 8.6 1963 14.3
2 4304 19.4 3517 25.6 2 150 0.7 307 2.2
3+a 593 2.6 529 3.9 3+a 17 0.1 38 0.3
Total 22,225 100 13,713 100 Total 22,225 100 13,713 100
Pr(y =Basic | x) Pr(y =Basic | x) Pr(y =Secondary | x) Pr(y =Secondary | x) Pr(y =Distres s| x) Pr(y =Distres s| x) Pr(y =Basic &S econdar y& Distres s|x ) Pr(y =Basic &S econdar y& Distres s|x ) Pr( y= Ba si c | x ) Pr( y= Seconda ry | x ) P r( y= Distress |x) Pr( y= Ba si c & Se conda ry & D is tre ss |x)
number of temporary workers. Moreover, the probability of experiencing depri-vation in in the three categories B ∩ S ∩ D increases from 10% to about 22% in Spain and from about 13% to almost 25% in Italy (in the south of Italy, the prob-ability goes from 15% to about 28%, as shown in Fig. 2). It turns out that tempo-rary work is risky and slightly more detrimental in Italy (especially in the south) than in Spain for households in the acute-severe deprivation category. This is in line with the existing literature. Whelan et al. (2001, 2004), for instance, find that temporary workers, the unemployed, and inactive people have a high likelihood of deprivation.
In order to evaluate whether employment is a protecting factor from deprivation, we compare Italy and Spain by testing whether an additional permanent (or tem-porary) worker in a household helps reduce the probability of deprivation. Table 8 in “Appendix” reports the marginal effects and the chi-square tests. One of the main findings is that an additional worker in the household reduces the probability of acute-severe deprivation (deprivation in the three categories at the same time,
B∩ S ∩ D ), but more in Spain than in Italy. If we focus on the south only, house-holds with an additional permanent worker in Italy have higher probability of falling into low-severe deprivation than in Spain, but they are more able to reduce the prob-ability of falling into acute–severe deprivation.
As far as an additional temporary worker, in Italy we find a higher impact on the risk of falling into basic needs deprivation than in Spain. The impact on the risk of falling into secondary needs deprivation or into B ∩ S ∩ D is higher for Spanish households. Finally, the impact is negative on the probability of being financially distressed and much higher in absolute value for Italy. This result is particularly noticeable in the south. The latter analysis reveals that employment is not a homo-geneous protective factor against deprivation, as households with temporary workers are less exposed to financial distress while households with permanent workers are less exposed to acute-severe deprivation.
Finally, we include in our set estimates controls for household economic condi-tions, i.e., quintiles of the equivalized household income distribution (Table 2). For all levels of severe material deprivation, we find that increasing income is associated with a reduction in the probability of deprivation, in line with expectations.12
5.1.2 Work intensity
The existence of employment in the household has a heterogeneous impact on the probability of falling into deprivation, as discussed in Sect. 5.1.1 and shown in Table 2. A plausible explanation is that some workers participating in the EU-SILC report working less than their potential or full-time capacity. Degree of work intensity has been an important issue, especially following the Great Recession when companies implemented labor hoarding through a variety of agreements with
12 We also performed a sensitivity analysis to explain the relationship between income and deprivation. We estimated logit models with standard deprivation measures that are dummy variables for material and severe material deprivation (i.e., SMD = 1 if the household flagged at least 4 items). The results confirm that income is negatively associated with deprivation.
workers (sharing contracts, short-term working schemes, wage cushions, involun-tary part-time, compensatory leave, etc.; for a survey of European countries after the crisis see Eurofound, 2013). More generally, work intensity is a byproduct of job quality, work organization, technological progress, work–family balance, individual health status, and labor demand (Díaz-Chao et al., 2016). However, it is an impor-tant deterrent of falling below the poverty line (Fusco et al., 2010). In Italy, two reforms of the labor market in 2012 and 2014 resulted in lower work intensity and high job instability (Filandri et al., 2020). Although Filandri et al. (2020) show that subjective poverty is related to job instability rather than work intensity, we show that work intensity of any degree is associated with deprivation.
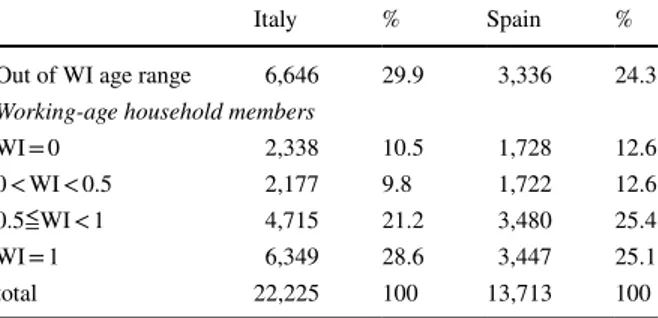
We measure the work intensity of each individual as the share of worked months over the full workable months in a year. It is possible to measure work intensity only for individuals of working age (15–64), while the remaining persons fall into the out-of-age category, as in Table 5. About 60% of the sampled individuals (more than 70% of households) in both countries are working-age individuals. In Italy, 10.5% of working-age individuals declared that they did not to work in the observed period. The analog is 12.6% for Spain. Moreover, 9.8% of Italians reported working for less than 50% of the full workable period, versus 12.6% of Spanish individuals; 21.2% of Italians reported working more than 50% but less than 100% of the full workable period, versus 25.4% in Spain; finally, only 28.6% of Italian individuals worked the full workable period, while 25.1% of Spanish individuals did. The variable of inter-est is the average work intensity of individuals within a household.
Figure 3 illustrates the predicted probability of being in low-severe and B ∩ S ∩ D deprivation by work intensity and macro-region. The highest probability of experi-encing basic needs deprivation belongs to the 0 < WI < 0.5 category for all macro-regions, i.e., individuals working less than 50% of workable months in the reference period (the probability is 14% in Italy and 9% in Spain). The risk of experiencing secondary deprivation is higher for Spanish workers than Italian workers and is highest for those working more than 50% of their potential. Being in financial dis-tress seems to be an issue for households working the full workable period, and sta-tistical differences are found between northern and southern Spain. These findings might partly be due to the fact that SMD is related to permanent income, which is accumulated during one’s working life and through other sources, such as elderly
Table 5 Observed frequency of work intensity for household members
Source: Authors’ calculations on EU-SILC 2017 data
Italy % Spain %
Out of WI age range 6,646 29.9 3,336 24.3
Working-age household members
WI = 0 2,338 10.5 1,728 12.6
0 < WI < 0.5 2,177 9.8 1,722 12.6
0.5≦WI < 1 4,715 21.2 3,480 25.4
WI = 1 6,349 28.6 3,447 25.1
Pr(y =Basic | x) Pr(y =Basic | x) Pr(y =Secondar y| x) Pr(y =Secondar y| x) Pr(y =Distres s| x) Pr(y =Distres s| x) Pr(y =Basic &S econdar y& Distress |x ) Pr(y =Basic &S econdar y& Distress |x ) Pr (y =B as ic |x ) Pr (y =S ec on da ry | x ) P r( y= Di str es s |x ) Pr (y =B as ic & Se co ndar y & D is tres s |x)
pensions. The sample considered for the calculation of the WI is relatively young (from 18 to 64 years of age) and therefore might not have accumulated (a sufficient level of) permanent income (Whelan and Maitre 2010). Furthermore, the spread of precarious contracts, low-paid jobs, and underemployment during the crisis implies that the labor market has stopped being a stable source of prosperity for many peo-ple and their families. Specifically, in Italy and Spain (as confirmed by data and the existing literature; see, for instance Eurofound, 2010; Horemans et al., 2016), there was an important increase in temporary jobs and involuntary part-time jobs, which are notably countercyclical, throwing a percentage of households into deprivation. In Spain, moreover, social transfers received by working-age individuals have been poorly targeted (OECD 2018). Note that in the south of Italy there is a substantially high probability of falling into the B ∩ S ∩ D category for households working less than the full workable period or those not working at all (about 16%, on average).
We conduct a similar analysis of the work intensity marginal impact in “Appen-dix” (Table 8). We compare the impact of Italian and Spanish household work inten-sity on the probability of falling into deprivation. Low work inteninten-sity is associated with a higher probability of distress in Spain compared to Italy. Medium work inten-sity is associated with a higher probability of secondary deprivation in Spain com-pared to Italy. All other impacts are statistically equivalent.
Among the other economic features of households, one of the most relevant is home property ownership. Homeowners are at a relatively lower risk of falling into material deprivation in both countries in our analysis (Table 2). As suggested by the literature, homeowners are less likely to report material deprivation than renters (Berthoud & Bryan, 2011; Figari, 2012).
5.2 Gender and Education of the Head of Household
Gender and education are strictly connected to performance in the labor market. In fact, their different distribution across populations may help explain a portion of the different performance in Spain and in Italy. After the Great Recession, the gender pay gap increased in Italy due to structural changes in the labor market
Table 6 Distribution of households by gender and education of the household head
Source: Authors’ calculations on EU-SILC 2017 data
n—Italy % % n—Spain % % n %
Female head 8953 40.3 5535 40.4 14,488 40.3
No or low education 4093 45.7 2600 47.0
Secondary education 3276 36.6 1016 18.4
Tertiary education 1584 17.7 1919 34.6
Male head 13,272 59.7 8178 59.6 21,450 59.7
No or low education 5627 42.4 4165 50.9
Secondary education 5487 41.3 1597 19.5
Tertiary education 2158 16.3 2416 29.6
and austerity measures, e.g., wage freezes in the public sector (Piazzalunga & Di Tommaso, 2019) and cuts to minimum income and social expenditures in Spain (Pavolini et al., 2015). Such a pay gap has been found to depend on educational levels, among other factors (Mussida & Picchio, 2014). Although material dep-rivation is not based directly on income, we believe that reductions in employ-ment and income have hit women and men differently. In this paper, we show that the gender and education level of the head of household are associated with different probabilities of falling into severe material deprivation. From Table 2, we note that a female head of household is positively associated with all depriva-tion categories and that deprivadepriva-tion is negatively associated with the educadepriva-tion level of the head of household. Table 6 reports the gender composition of our sample, for total heads of household only, in the two countries. Although 52% of the sample in both countries is female, only 40.3% of the families have a female head of household. There exists a duality in the distribution of heads of house-hold with upper secondary and tertiary education. While 36.6% of female heads of household have achieved upper secondary education in Italy, only 18.4% of such heads have this level of education in Spain. On the other hand, only 17.7% of female heads of household in Italy have achieved tertiary education, compared to 34.6% in Spain. The same reversed distribution exists for male heads too. It appears that male heads of household in Italy are less educated than their Spanish counterparts.
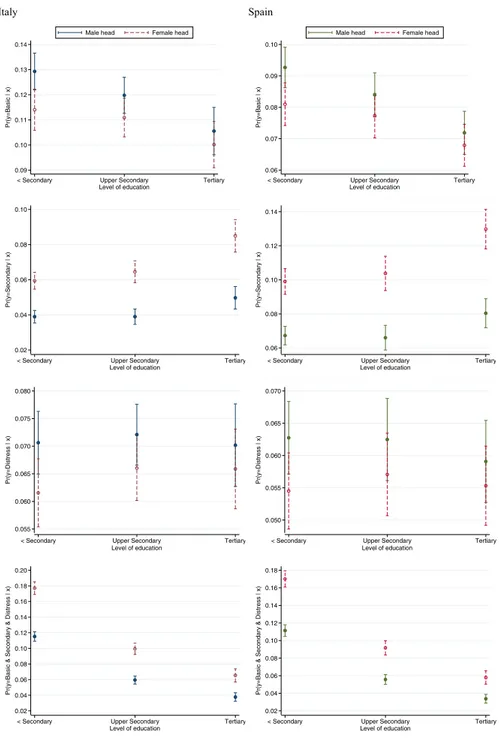
The predicted probability of each outcome by gender and education level is reported in Fig. 4. The probability of suffering basic needs deprivation is lower for households headed by females in both countries, and especially for those headed by individuals with a low level of education. In contrast, the probability of experiencing secondary deprivation is higher for households headed by females in both countries, and particularly for those headed by high-skilled women. Again, households headed by females have a higher probability of experiencing the acute-severe type of deprivation in both countries, and this effect is especially strong for less-educated individuals (probability equal to 18% in Italy and 17% in Spain). This means that when households headed by females suffer from SMD they tend to perform badly at all intensities of material deprivation. The disad-vantage of female-headed households is confirmed by the existing literature, not only for SMD but also for poverty and, more generally, social exclusion (Muss-ida & Parisi, 2020). This might partly be due to the difficulties faced by women in Southern Europe in reconciling paid work with unpaid care work within the household. According to our results, more attention needs to be paid to measures that improve women’s access to employment and facilitate the reconciliation of work and private life, such as by increasing access to care for dependent persons.
We then perform a test of equality of the coefficients of “female head of house-hold” in the regression analysis (Italian female versus Spanish female). The test rejects the hypothesis for secondary deprivation and for B ∩ S ∩ D deprivation. In fact, the marginal impact of experiencing secondary deprivation is higher in Spain (0.041) than in Italy (0.027) for female heads of household; the marginal impact of being in the B ∩ S ∩ D category is slightly higher for Spanish female (0.0345) than for Italian female heads of household (0.0318). Tests of equality of
n i a p S y l a tI 0.09 0.10 0.11 0.12 0.13 0.14 Pr(y=B asic | x)
< Secondary Upper Secondary Tertiary Level of education
Male head Female head
0.06 0.07 0.08 0.09 0.10 Pr(y=B asic | x)
< Secondary Upper Secondary Tertiary Level of education
Male head Female head
0.02 0.04 0.06 0.08 0.10 Pr(y=S econ dary | x)
< Secondary Upper Secondary Tertiary Level of education 0.06 0.08 0.10 0.12 0.14 Pr(y=S econ dary | x)
< Secondary Upper Secondary Tertiary Level of education 0.055 0.060 0.065 0.070 0.075 0.080 Pr(y=Dis tress | x)
< Secondary Upper Secondary Tertiary Level of education 0.050 0.055 0.060 0.065 0.070 Pr(y=Dis tress | x)
< Secondary Upper Secondary Tertiary Level of education 0.02 0.04 0.06 0.08 0.10 0.12 0.14 0.16 0.18 0.20
Pr(y=Basic & Seco
ndary & Distress | x)
< Secondary Upper Secondary Tertiary Level of education 0.02 0.04 0.06 0.08 0.10 0.12 0.14 0.16 0.18
Pr(y=Basic & Seco
ndary & Distress | x)
< Secondary Upper Secondary Tertiary Level of education
Fig. 4 Predicted probability of being in SMD by level of education of gender head and country. Source (for all figures): Authors’ calculations on EU-SILC 2017 data
marginal impact by decomposing the sample among the three levels of education, are also produced. The tests reject the equality hypothesis for marginal impacts on the secondary, distress, or B ∩ S ∩ D categories for individuals with secondary/ tertiary education (there is a difference in impact for female heads of household between countries: e.g., the marginal impact on the probability of experiencing secondary deprivation for Italian female graduates is 0.015, while for Spanish female graduates it is 0.011 with respect to the less educated).13
We also explore regional differences in Fig. 4, which reveals that women in southern Italy and southern Spain with a low level of education are in the worst position in terms of the predicted probability of falling into acute-severe material deprivation, B ∩ S ∩ D.
6 Conclusions
We offer a novel analysis of the role of labour market status and economic house-hold features in affecting the risk of being severely materially deprived by ranking the levels of deprivation from low-severe to acute-severe material deprivation. We choose to observe Italian and Spanish households as their SMD levels differ sub-stantially, especially after the Great Recession.
Employment is involved in material deprivation along several dimensions. We consider the number of permanent workers in the household, the number of tem-porary workers, and the average work intensity of individuals within a house-hold. Even households whose members work their full potential are at risk of severe material deprivation, although this risk is lower, on average, than the risk for other working categories. Our evidence shows that employment shields households at least from the risk of basic needs deprivation. However, it does not seem to protect from deprivation of secondary needs, especially in Spain. A clear negative path exists between the probability of falling into the acute-severe material deprivation category when the number of permanent workers in a house-hold increases, and this is an important shield effect of employment. For example, the south of Italy has a probability as high as 20% with zero permanent workers, and this drops to less than 5% with three or more permanent workers. As far as temporary work is concerned, this type of condition is risky and slightly more detrimental in Italy (especially in the south) than in Spain for households in the most severe deprivation category. The analysis reveals that employment is not a homogeneous protecting factor against deprivation, as households with temporary workers are less exposed to financial distress while households with permanent workers are less exposed to acute-severe deprivation. A plausible explanation is that some workers participating in the EU-SILC report working less than their potential or full-time capacity. Workers who work less than 50% of their capacity have the highest probability of experiencing basic deprivation compared to other
13 Note, however, that the marginal impacts for the Distress and B ∩ S ∩ D categories are negative, i.e., females with higher education seem to perform better than those with lower education in reducing the probability of being in the Distress or B ∩ S ∩ D categories.
work intensities, and more so in Italy than in Spain. Workers with a medium work capacity (higher than 50% but less than 100%) have the highest probability of experiencing secondary deprivation, and more so in Spain than in Italy. House-hold members working full time have the highest probability of facing finan-cial distress, and more so in northern Spain than in southern Spain. This finding might partly be due to the fact that SMD is related to permanent income, which is accumulated throughout one’s working life and through other sources, such as elderly pensions. The sample considered for the calculation of work intensity is relatively young and therefore might not have accumulated a sufficient level of permanent income. Moreover, workers with atypical/fixed-term contracts expose their households to an increasing risk of severe material deprivation in both coun-tries. Households headed by females have a higher probability of experiencing the acute-severe type of material deprivation in both countries, and this effect is especially strong for less-educated individuals. The gender and education level of the head of household also have a different association with SMD. In particular, women in southern Italy and southern Spain with a low level of education are in the worst position in terms of the predicted probability of experiencing acute-severe material deprivation.
The debate regarding policy interventions aimed at reducing the incidence of SMD is open, both in Italy and in Spain. In Italy, we find an ongoing discussion of the most appropriate measure to implement: an inclusion income (REI) or a citi-zenship income. Indeed, there are some issues to solve. Both measures are means-tested, and their good performance would imply a high degree of coordination among the regions of Italy. Moreover, the costs of implementation, especially for the citizenship income, which has the ambition of being universal, are very high. In Spain, there is no specific policy aiming to reduce severe material deprivation but, rather, a variety of regional means-tested benefits that contribute to reducing poverty and severe material deprivation. The system of non-contributory benefits is quite complex because many benefits provide different protections for each category, and the general risks of poverty and severe material deprivation are covered through the regional minimum income program, with a high level of disparity among territories. Moreover, the alleviating measures should not solely be means-tested.
Our results suggest that strategies for inclusion should focus on transforming temporary contracts to permanent ones and increasing the work intensity—in other words, paying much more attention to work quality and innovation—and targeted to women in vulnerable positions, such as less-educated individuals in the south with zero or low work intensity. In both countries, a higher level of coordination among regions would allow for increasing the effectiveness of the measures and reduc-ing the geographical gaps. A very recent policy measure called “Ingreso minimo
vital” (IMV) was approved by the Spanish government on May 29, 2020, and it goes
somewhat in our suggested direction. It is a national income scheme complementing the existing regional instruments aiming to lift individuals out of extreme poverty. It depends on household size, and the government estimates that 30% of individuals
6.2 5.1 12.3 10.1 20.4 21.6 19.3 20.3 0.0 5.0 10.0 15.0 20.0 25.0 0.0 2.0 4.0 6.0 8.0 10.0 12.0 14.0 16.0 2006 2007 2008 2009 2010 2011 2012 2013 2014 2015 2016
Spain - SMD Italy - SMD Spain - ROP Italy - ROP
Fig. 5 Standard SMD and at-risk of poverty rate in Italy and Spain, 2006/2017. Standard Eurostat SMD, left scale. Risk of poverty rate, right scale. Source: Authors’ calculations on Eurostat data
involved will be under 18 years of age. More importantly, beneficiaries may work and one’s salary will only partially be taken into account for the prerequisite to get the new IMV (Ministerio de Inclusiòn 2020).
Finally, we conclude that the large gap in the aggregate severe material depri-vation level in 2017 between Italy and Spain is driven by basic needs depridepri-vation (especially of the Italian South) and financial distress categories, in line with our expectations. The interesting result regarding Spanish households suffering particu-larly from secondary deprivation category along many dimensions (more than Ital-ian households) deserves a deeper analysis, which we reserve for future research. Appendix
Table 7 Descriptive statistics by country of household level variables
Variable Italy Spain
Mean Std. Dev Mean Std. Dev SMD categories of the dependent variable
Not deprived 0.425 0.491 0.473 0.497
Basic needs 0.112 0.301 0.078 0.297
Secondary needs 0.049 0.273 0.081 0.240
Financial distress 0.065 0.278 0.056 0.241
Basic and secondary needs 0.042 0.193 0.029 0.187
Basic needs and financial distress 0.176 0.373 0.152 0.373
Secondary needs and financial distress 0.017 0.138 0.024 0.139
Basic and secondary needs, financial distress 0.113 0.314 0.106 0.313
Age of the head of the household 56.60 0.162 0.549 0.157
Household size 2.196 1.203 2.539 1,267
Number of elderly in the household 0.563 0.742 0.532 0.748
Number of disabled in the household 0.459 0.459 0.420 0.653
Female head of the household 0.403 0.490 0.404 0.491
Head homeowner 0.792 0.439 0.798 0.401
Household type
Single (one person household) 0.365 0.481 0.230 0.421
2 adults, no dependent children, both adults under 65 years 0.094 0.291 0.131 0.337 2 adults, no dependent children, at least one adult 65 years or
more 0.175 0.380 0.171 0.376
Other household without dependent children 0.109 0.311 0.129 0.336 Single parent household, one or more dependent children 0.034 0.181 0.035 0.185
2 adults, one dependent child 0.083 0.276 0.102 0.303
2 adults, two dependent children 0.084 0.277 0.116 0.321
2 adults, three or more dependent children 0.017 0.130 0.025 0.156 Other households with dependent children 0.039 0.194 0.060 0.237 Quintile of the income distribution
Income quintile 1 0.165 0.372 0.256 0.436
Income quintile 2 0.183 0.387 0.227 0.419
Income quintile 3 0.207 0.405 0.188 0.391
Income quintile 4 0.222 0.415 0.165 0.371
Income quintile 5 0.222 0.415 0.165 0.371
Number of employed in the household 0.847 0.823 0.946 0.892
Number of temporary workers 0.102 0.331 0.196 0.468
Work intensity code
WI = 0 0.105 0.307 0.126 0.332
0 < WI < 0.5 0.098 0.297 0.126 0.331
0.5 = < WI < 1 0.212 0.409 0.254 0.435
WI = 1 0.286 0.452 0.251 0.4343
Education of the head of the household
Source: Authors’ calculations on EU-SILC 2017 data Table 7 (continued)
Variable Italy Spain
Mean Std. Dev Mean Std. Dev
Upper secondary 0.394 0.489 0.191 0.393
Tertiary 0.168 0.374 0.316 0.465
Level of urbanization
Densely populated area 0.324 0.468 0.516 0.500
Intermediate area 0.390 0.488 0.214 0.410
Thinly populated area 0.286 0.452 0.269 0.443
Macroarea
North 0.497 0.500 0.553 0.497
Center 0.244 0.430 0.233 0.423
South 0.258 0.438 0.214 0.410
Observations 32,225 13,713
Table 8 Impact of a marginal worker in the household on the probability to fall into deprivation
H0: m.effect(It) = m.effect(Sp). Significance levels for 𝜒-test: * 𝛼 ≤ 10% , **𝛼 ≤ 5% , ***𝛼 ≤ 1% Source: Authors’ calculations on EU-SILC 2017 data
Permanent workers Temporary workers
Italy Spain Italy Spain
Categories of
deprivation m.effect m.effect test m.effect m.effect test
Basic − 0.0025 − 0.0047 0.83 0.025 0.019 6.1**
Secondary 0.0023 0.0012 0.40 0.002 0.005 3.6*
Distress 0.0046 0.0012 25.1*** − 0.11 − 0.006 31.6***
B∩ S ∩ D − 0.0284 − 0.0327 9.37*** 0.025 0.029 12.1***
South It South Sp South It South Sp
B 0.0076 − 0.0005 14.2*** 0.015 0.017 0.48
S 0.0042 0.0019 7.51*** − 0.001 0.001 8.7***
D 0.0111 0.0058 22.5*** − 0.017 − 0.011 19.9***
B∩ S ∩ D − 0.0448 − 0.0385 4.01** 0.039 0.035 2.6
Funding Open access funding provided by Università Cattolica del Sacro Cuore within the CRUI-CARE Agreement. This research has not received funding.
Compliance with ethical standards
Open Access This article is licensed under a Creative Commons Attribution 4.0 International License, which permits use, sharing, adaptation, distribution and reproduction in any medium or format, as long as you give appropriate credit to the original author(s) and the source, provide a link to the Creative Com-mons licence, and indicate if changes were made. The images or other third party material in this article are included in the article’s Creative Commons licence, unless indicated otherwise in a credit line to the material. If material is not included in the article’s Creative Commons licence and your intended use is not permitted by statutory regulation or exceeds the permitted use, you will need to obtain permission directly from the copyright holder. To view a copy of this licence, visit http:// creat iveco mmons. org/ licen ses/ by/4. 0/.
References
Addabbo, T., GarcíaFernández, R., LlorcaRodríguez, C., & Maccagnan, A. (2015). Poverty and mate-rial deprivation in the crisis: Italy and Spain. Journal of Applied Economic Sciences, 10(4(34)), 514–533. https:// doi. org/ 10. 1007/ 978-3- 7908- 2772-9_ 10.
Ayala, L., Jurado, A., & Perez-Mayo, J. (2011). Income poverty and multidimensional deprivation: Les-sons from cross-regional analysis. Review of Income and Wealth, 57(1), 40–60. https:// doi. org/ 10. 1111/j. 1475- 4991. 2010. 00393.x.
Ayala, L., Jurado, A., & Pérez-Mayo, J. (2020). Multidimensional deprivation in heterogeneous rural areas: Spain after the economic crisis. ECINEQ 2020 560 Working Paper Series.
Ayllón, S., Mercader, M., & Ramos, X. (2007). Caracterización de la privación y de la pobreza en Cata-luña. Revista de Economía Aplicada, 44(15), 137–175.
Bárcena-Martín, E., Lacomba, B., Moro-Egido, A. I., & Pérez-Moreno, S. (2014). Country differences in material deprivation in Europe. Review of Income and Wealth, 60(4), 802–820. https:// doi. org/ 10. 1111/ roiw. 12030.
Berthoud, R., & Bryan, M. (2011). Income, deprivation and poverty: A longitudinal analysis. Journal of Social Policy, 40(01), 135–156. https:// doi. org/ 10. 1017/ S0047 27941 00005 04.
Díaz-Chao, Á., Ficapal-Cusí, P., & Torrent-Sellens, J. (2016). Economic crisis and job quality in Spain: A multi-dimensional and micro-data empirical approach. Social Indicators Research: An Interna-tional and Interdisciplinary Journal for Quality-of-Life Measurement, 125, 613–633. https:// doi. org/ 10. 1007/ s11205- 014- 0850-0.
Dudek, H. (2019). Country-level drivers of severe material deprivation rates in the EU. Ekonomický časopis. Journal of Economics, 67(1), 33–51.
EU Council of Ministers (1985) “Council Decision of 19 December 1984 on Specific Community Action to Combat Poverty”, 85/8/EEC, Official Journal of the EEC, L 2, Brussels
Eurofound (2010). Rising numbers of temporary employees and independent contractors. https:// www. eurof ound. europa. eu/ it/ publi catio ns/ artic le/ 2010/ rising- numbe rs- of- tempo rary- emplo yees- and- indep endent- contr actors.
Eurofound (2013). Impact of the crisis on working conditions in Europe. https:// www. eurof ound. europa. eu/ it/ publi catio ns/ report/ 2014/ worki ng- condi tions- indus trial- relat ions/ impact- of- the- crisis- on- indus trial- relat ions- and- worki ng- condi tions- in- europe.
European Commission (2012). Measuring material deprivation in the EU-Indicators for the whole pop-ulation and child-specific indicators. Eurostat Methodologies and Working papers, Publications Office of the European Union, Luxembourg.
Eurostat (2010). Description of target variables: Cross‐sectional and longitudinal. https:// circa bc. europa. eu/w/ browse/ 95a7b 6bc- 33ea- 494c- a865- bf192 ed23f ea.
Eurostat (2012). Measuring Material Deprivation in the EU. https:// ec. europa. eu/ euros tat/ docum ents/ 38887 93/ 58530 37/ KS- RA- 12- 018- EN. PDF.
Eurostat (2019). How satisfied are people with their lives?. https:// ec. europa. eu/ euros tat/ docum ents/ 29955 21/ 10207 020/3- 07112 019- AP- EN. pdf/ f4523 b83- f16b- 251c- 2c44- 60bd5 c0de7 6d.
Figari, F. (2012). Cross-national differences in determinants of multiple deprivation in Europe. The Jour-nal of Economic Inequality, 10(3), 397–418. https:// doi. org/ 10. 1007/ s10888- 010- 9157-9.
Filandri, M., Pasqua, S., & Struffolino, E. (2020). Being working poor or feeling working poor? The role of work intensity and job stability for subjective poverty. Social Indicators Research: An