Università Degli Studi Di Pisa
Facoltà Di Scienze Matematiche Fisiche e Naturali Corso Di Laurea Magistrale in Conservazione ed Evoluzione
Tesi Di Laurea Magistrale
“Eco-ethology of the red collared brown
lemur (Eulemur collaris): comparison between
groups living in well preserved and degraded littoral
forest fragments, in South-eastern Madagascar”
Relatori:
Prof.ssa Silvana Borgognini Prof. Giuseppe Donati
Candidato: Marco Campera Anno Accademico 2012-2013
1
TABLE OF CONTENTS
ABSTRACT………....………….pag. 4 CHAPTER 1-GENERAL INTRODUCTION………..……pag. 5
1.1 The red collared brown lemur , Eulemur collaris ……….pag. 5 1.2 The littoral forests of south -eastern Madagascar…… ....pag. 9 1.3 The role of QMM……….pag. 11
CHAPTER 2-AIM OF THE STUDY………..pag. 13 CHAPTER 3-MATERIALS AND METHODS…………...pag. 19
3.1 Study site and species ……… ...pag. 19 3.2 Behavio ral data………pag. 23 3.3 Statistical analyses……….pag. 28
CHAPTER 4-HABITAT USE………..pag. 29
4.1 Introduction……….pag. 29 4.2 Materials an d methods………...pag. 30 4.3 Results………..pag. 33 4.4 Discussion………pag. 44
CHAPTER 5-ACTIVITY PATTERN………..pag. 50
5.1 Introduction……… ……….pag. 50 5.2 Materials and methods………...pag. 52 5.3 Results………..pag. 56 5.4 Discussion……… pag. 63
2 CHAPTER 6-FEEDING ECOLOGY………...pag. 66
6.1 Introduction………...pag. 6 6 6.2 Material and methods……….pag. 69 6.3 Results………..pag. 7 3 6.4 Discussion………pag. 8 7
CHAPTER 7-BEHAVIORAL THERMOREGULATION……..pag. 96
7.1 Introduction………...pag. 96 7.2 Material and methods……… ………….pag. 98 7.3 Results………pag. 102 7.4 Discussion………..pag. 110
CHAPTER 8-HETEROTHERMY in Eulemur collaris…..……..pag. 114
8.1 Introduction………...pag. 114 8.2 Material and methods………..pag. 118 8.3 Results………pag. 120 8.4 Discussion………..pag. 126
CHAPTER 9-SOCIAL STRUCTURE………..…..……..pag. 129
9.1 Introducti on………...pag. 129 9.2 Material an d methods………..pag. 131 9.3 Results………pag. 134 9.4 Discussion………..pag. 149
CHAPTER 10-GENERAL CONCLUSIONS…………..…..……..pag. 157 APPENDIX I………..…..……….pag. 159
3 APPENDIX II………..…..………pag. 161 APPENDIX III………..…..……….pag. 164 APPENDIX IV………..…..……….pag. 168 REFERENCES………..………..pag. 169 ACNOWLEDGEMENTS………..…..………..pag. 205
4 ABSTRACT
The red collared brown lemur, Eulemur collaris , is a cathemeral lemur with an extraordinary ecological flexibility that allow s this lemur to live in almost every forest type in Madagascar. The littoral forests of southeastern Madagascar are among the most endangered habitats in the world, and Eulemur collaris is well adapted to live in these forests. The red collared brown lemur is mostly frugivorous, and it is an important seed disperser for a large number of plant species.
Our goal was to study ecological and behavioral differences between groups of collared brown lemur s living in a more intact and in a more degraded forest fragment. For this, two groups in Mandena (a more degraded fragment ) and two groups in Sainte Luce (a more intact fragment ) were studied for 7 months. Each month, we collected data during 4 days per group and 1 night per site, from 06:00 to 18:00 for diurnal and from 18 :00 to 06:00 for nocturnal sessions. We collected data on habitat use, activity patterns, feeding behavior, behavioral ther moregulation and social structure.
Overall, lemurs at Mandena had a lower group size, had greater home ranges, spent more time restin g and used more energy-saving behaviors compared to lemurs at Sainte Luce.
5
CHAPTER 1
GENERAL INTRODUCTION
1.1. The red collared brown lemur , Eulem ur collaris .
The red collared brown lemur, Eulemur collaris GEOFFROY 1817, is a strepsirrhine primate, belonging to the family Lemuridae. It was previously classified as one of the six subspecies of Eulemur
fulvus. Subsequently, Groves (2001) elevated all former E. fulvus
subspecies ( albifrons, albocollaris (now cinereiceps ), collaris,
fulvus, rufus and sanfordi) to full species.
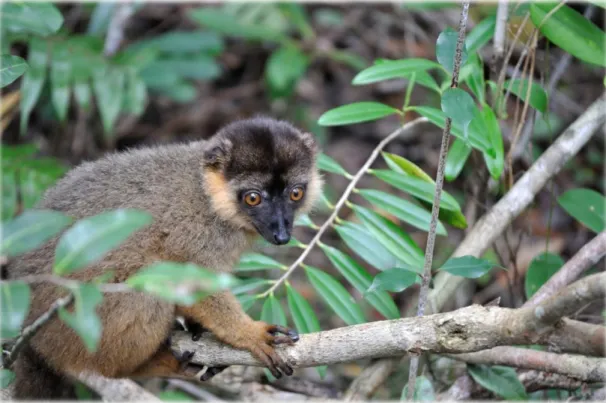
Fig 1.1: Male red collared brown lemur (Eulemur collaris), Sainte Luce. Photo by Marco Campera.
Eulemur collaris is a medium-sizes lemur with a head -body length
of 39-40 cm, a tail length of 50 -55 cm, an overall length of 89 -95 cm, and a body weight of 2.25 -2.5 kg (Tattersall, 1982). This species is sexually dichromatic. In males the dorsal coat is brownish-gray, the tail is darker, and there is also a dark stripe
6
along the spine. The ventral coat is a paler gray. The muzzle, face and crown are dark gray to black. The creamy to rufous -brown cheeks and beard are thick and bushy, while the creamy to gray -colored eyebrow patches vary in their prominence. In females, the dorsal coat is browner or more rufous than that of the male. The ventral coat is a pale creamy-gray. The face and head are gray. The cheeks are rufous -brown, but less prominent than in males. Both sexes have orange-red eyes (Mittermeier et al., 2010).
Fig 1.2: Female red-collared brown lemur (Eulemur collaris), Mandena. Photo by Marco Campera. We can see the gray face and head, and the cheeks less prominent than in males.
The color pattern of the red-collared brown lemur is similar to that of Eulemur cinereiceps (present valid name of E. albocollaris , Johnson et al., 2008). Male E. collaris can be distinguished from male E. cinereiceps by their beards, those of the former being cream-colored or rufous while those of the latter are white. Female
7 cinereiceps. Recent genetic analyses support full species status for
both taxa (Djletati et al., 1997; Wyner et al., 1999).
This lemur is found in tropical moist lowland and montane forests in southeastern Madagascar , from Tolagnaro (Fort Dauphin) north to the Mananara River (Fig. 1.3). The western limits of this range are the forests of the Kalambatritra
region, including the Kalambatritra Special Reserve. The Mananara River serves as a boundary between the ranges of E. collaris and those of E.
cinereiceps , except for an i solated
population at Midongy du Sud
National Park (Irwin et al., 2005) and
another at Vohipaho, near
Vangaindrano (Mittermeier et al.,
2010). Even if the typical habitat of
this lemur is the mountain rain forest, they can also inhabit the humid littoral f orests. In fact, we can find this lemur in the Mandena Conservation Zone and in the Sainte Luce Private Reserve.
The red collared brown lemur is the largest lemur species of the humid littoral forests of South -Eastern Madagascar (Donati et al., 2007a), where it can be considered as the main seed disperser for many plant species (Bollen and Donati, 2006). Indeed, this lemur is the only frugivore in this forests able to shallow and thus to
Fig. 1.3: Distribution of Eulemur collaris (in red).
8
disperse large seeds, up to 16.5 mm (Ganzhorn et al., 1999; Bollen
et al., 2004).
The littoral forests around Tolagnaro are under substantial pressure to meet the daily needs of the local human population (Bollen and Donati, 2006). Hunting also threatens the survival of Eulemur
collaris, and can lead to a local extinction w ithout appropriate
conservation measures. This could entail the eventual loss of plant species that are dependent on this lemur for seed dispersal.
This species is mainly frugivorous but it shows a great dietary flexibility, feeding also on leaves, flowers , mushrooms, petioles, roots, gums and invertebrates in variable proportions depending on forest phenology and food availability (Donati et al, 2007a; Donati
et al, 2011). The species is cathemeral (active both day and night
throughout the year), a trait s een in other members of the genus (Curtis and Rasmussen, 2002; Kappeler and Erkert, 2003; Schwitzer
et al., 2007a). Multimale–multifemale groups of E. collaris have
been observed in the wild (Donati, 2002; Donati and Borgognini -Tarli, 2006; Donati et al., 2007a; Donati et al., 2010; Donati et al., 2011), but social structure is still poorly understood and the literature available only concerns other species of the genus
Eulemur (Sussman, 1974; Overdorff, 1998; Pereira and McGlynn,
1997; Wimmer and Kappeler , 2002; Ostner and Kappeler,2004; Marolf et al., 2007). Females give birth to one or two offspring between September and October. The 2008 IUCN Red List assessment classified E. collaris as Vulnerable (VU A2cd). The principal threats are habitat loss due t o slash-and-burn agriculture
9
and charcoal production, hunting for food, and capture to supply local pet trades (Raharivololona and Ranaivosoa, 2000).
1.2. The littoral forests of south -eastern Madagascar.
Madagascar is considered an important global con servation priority because of the high endemicity of its flora and fauna (Mittermeier
et al., 1999) and the severe threats to the island’s environment. In
1985, 3.8 million hectares of rain forests remained, representing only 50 percent of the 7.6 million hectares existing in 1950, and 34 percent of the estimated original extent (11.2 million hectares). Between 1950 and 1985, the rate of deforestation averaged 111 000 hectares per year (Green and Sussman, 1990) (Fig 1.4).
Fig 1.4: Maps of distribution of rain forest in eastern Madagascar through time (Green and Sussman, 1990).
10
Prior to human occupation, humid and sub -humid littoral forest covered approximately 461 000 ha (0.8 percent of the total land surface of Madagascar), of which only about 47 90 0 ha remain today, with a habitat loss of 89.7 % (Consiglio et al., 2006). Thus, from the original littoral forest, only 10.3 % remains in the form of little forest fragments, and only 1.5 % of
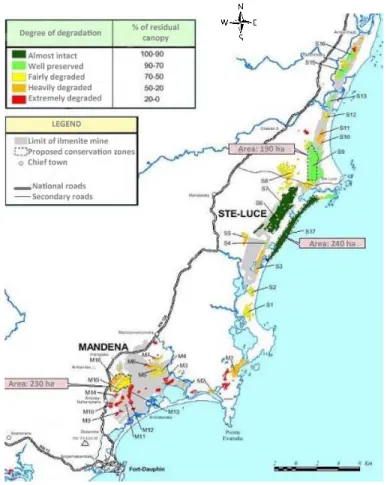
these are included within the existing protected areas network (Vincelette et al., 2007c). In particular, the littoral forest on sandy soil of south -eastern Madagascar is one of the most threatened ecosystems on this island. By 2005, the Tolagnaro region (Fig 1.5) littoral forests were heavily fragmented and covered only 3128 ha, distributed in 289 blocks varying in size from 0.06 ha to 252.4 ha (Vincelette et al., 2007c). In the Fort Dauphin (Tolagnaro)
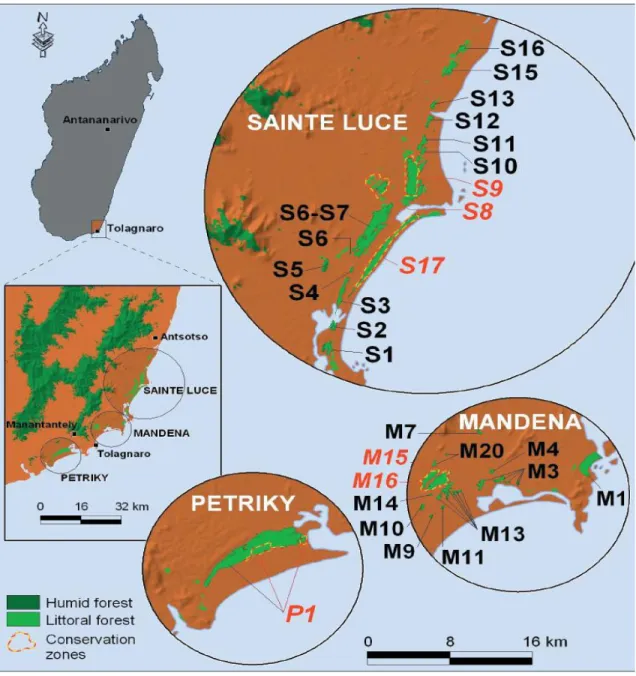
area the remaining littoral forests on sandy soil form three groups of fragment s: Petriky, Mandena and Sainte Luce .
The littoral forest ecosystem is restricted to unconsolidated sand in a narrow coastal band, extending along Madagascar’s east coast from north of Vohimarina to just southwest of Tolagnaro (Consiglio
et al., 2006). This forest has aseasonal rainfall and strongly
seasonal patterns in flushing, flowering, and ripe fruiting. Intra -annual differences occur in phenophases leading to periods of abundance and scarcity (Bollen and Donati, 2005).
Fig.1.5. Anosy region (in red) and Tolagnaro.
11 1.3 The role of QMM
QIT Madagascar Minerals (QMM) is a company jointly owned by Rio Tinto (80%) and the Malagasy State (20%) represented by the
Office des Mines Nationales et des Industries Stratégiques de Madagascar (OMNIS).
QMM is an ilmenite mining project. Ilmenite contains titanium dioxide, used principally as a raw mate rial in the manufacture of white pigment. From 1985, QMM bega n an extensive exploration program along the eastern coast of Madagascar to locate deposits of heavy mineral sands containing titanium dioxide. Major mineral sediments were found in Mandena, Petr iky and Sainte Luce, underneath southeastern Madagascar’s largest remaining stands of littoral forest (Lowry et al., 2008). As the mining project was developed, a series of studies commissioned by QMM demonstrated the importance of the region’s biodiversi ty (e.g. Ganzhorn et al., 2007), that cannot be lost and require appropriate conservation plans.
Mining at the first of the three sites (Mandena) started in 2009; the lifetime of the project is expected to be around 40 -50 years.
“The region in which QMM works is recognized and valued globally for its rich and unique biodiversity. As a member of the Rio Tinto group, QMM has made a commitment to have a Net Positive Impact on biodiversity.” (Biodiversity Action Plan 2010 -Rio Tinto QMM).
12
To achieve a Net Posi tive Impact on biodiversity, the goal of QMM is to minimize the mine’s negative impacts on biodiversity and create a model project for investment compatible with biodiversity conservation. The aim of Rio Tinto is to avoid harm to biodiversity where possibl e, mitigate impacts, restore and rehabilitate areas that have been affected by mining, and offset residual negative impacts on biodiversity by protecting species and reducing rates of habitat loss in areas outside the mining zone.
Avoiding impacts is the p riority of QMM Biodiversity Action Plan. An avoidance area where no mining will take place has been legally designated and agreed with local communities and the Malagasy government for all three prospective mining sites as part of the EMP (Environmental Ma nagement Plan, 2002). These are currently managed to protect habitats, species and biodiversity -based livelihoods. This avoidance areas is called “Conservation Zones”, and Rio Tinto established three zones (Fig 1.6):
The Mandena Conservation Zone (230 ha) , established in 2000, that represents the last remaining significant tract of littoral forest in this area, the rest having been lost or heavily degraded by subsistence charcoal makers over the past 20 years. In Mandena an ecological center and a tree pl antation nurseryare present .
The Sainte Luce Conservation Zone (274 ha), established in 2005, set up with local communities dinas.
13
Fig. 1.6: Conservation zones. Maps of the Sainte Luce, Mandena and Petriky areas in south-eastern Madagascar, indicating the location of major littoral forest parcels (light green), including those that comprise the established conservation zones at the two sites (dashed red and yellow lines), (Lowry et al., 2008).
14
CHAPTER 2
THE AIM OF THE STUDY
One of the imperative goals of conservation biology is to determine how animals react to the increasing rate of habitat degradation. Response to degradation seems to be highly variable depending on primate species and h abitat type, so that no clear generalization seems to be possible (Cowlishaw and Dunbar, 2000; Onderdon k and Chapman, 20 00). As a general rule, folivorous primates seem to cope better with habitat degradation since secondary growth may produce higher food quality, i.e. higher protein and lower fiber content, than mat ure forest (Ganzhorn, 1995 ; Plumptre and Reynolds, 1994; Chapman et al., 2002). By contrast , frugivorous primates may find more problems due to the fluctuating spati al and temporal food distribu tion, the need to obtain proteins and minerals from alternative food and their higher home range requirements (Estrada and Coates -Estrada, 1996; Lovejoy et al., 1986; Rode et
al., 2006). However, plant -frugivore interactions are important
components of the complex forest communities, and seed dispersion by vertebrates is a key process in vegetation dynamics and recovery (Wallace and Painter, 2002). Frugivores play a vital role in the maintenance of biodiversity in tropical forests, where they constitute a l arge proportion of the vertebrate biomass (Fleming et
al., 1987), and zoochorous tree species make up the bulk of tropical
plant species (Howe and Smallwood, 1982). Loss of fruit -frugivore interactions can thus have profound consequences (Corlett, 1998).
15
In Madagascar, lemurs have been shown to be important seed dispersers (Birkinshaw et al., 2002; Dew and Wright, 1998; Ganzhorn et al., 1999; Overdorff and Strait, 1998; Ralisoamalala, 1996; Scharfe and Schlund, 1996) , in particular since the guild of frugivorous birds and bats is poor in this island as compared to other continents (Fleming et al., 1987; Ganzhorn et al., 1999).
Eulemur collaris is particularly important for the dispersal of the
seeds of numerous plant species in the littoral forests of South -eastern Madagascar (Bollen et al., 2004). It is probably the last of the remaining large -bodied frugivores in these littoral forests that is capable of ingesting large -sized seeds, thus matching the situation of brown lemurs in some malagasy dry deciduous forests (Ganzhorn et al., 1999).
In a co-evolutionary perspective, there are five species of plants that apparently are dispersed exclusively by Eulemur collaris,
namely Canarium boivinii , Diospyros sp., Eugenium sp.,
Hyperacanthus mandenensis , Cinnamosma madagascariensis var. namoronensis (Bollen et al., 2004). Their fruits are significantly
heavier and longer (up to 3 0 mm seed length) than the fruits of other plant species living in the same forests . Even though red-collared brown lemurs often drop the seeds under the parent plant, occasionally seeds are swallowed and defecated or dropped some distance away from the parent plant. Thus, in terms of conservation, these relationships are of crucial importance to preserve the integrity of the littoral forest.
16
Figure 2.1: Bibi, a juvenile male of group B at Sainte Luce. Photo by Marco Campera
As Malagasy forests become more fragmented the remaining patches become increasingly isolated and inaccessible to arboreal lemur species (Ganzho rn et al., 2001). Large frugivores are often the most vulnerable to habitat fragmentation (Kannan and James, 1999) and this is the case for E. collaris in Sainte Luce, where the species is only present in the largest fragments, S9 (377 ha) and S17 (237 ha) , two of the last remaining areas of littoral forest in Southeastern Madagascar. This species is also present in the Conservation Zone of Mandena, a series of littoral forest fragments located about 50 km South -West from the Sainte Luce area (Fig. 2.2). Floristic and structural characteristics of the Mandena forest show a fragmented and seriously compromised habitat (Vincelette
17
of the Mandena forest provides a model to study and to understa nd ecological and behavioral mechanisms used by animals to cope with such degraded habitat. Previous studies in degraded and/or fragmented areas have underlined the influence of habitat modification on primate ecology and behavior (Ganzhorn et al., 2007).
The most significant changes concern time budget, feeding choices, social interactions, group size and structure, and habitat use (Donati, 2002; Bollen et al., 2005; Bollen and Donati, 2005; Ganzhorn et al., 2007; Donati et al., 2007a; Donati et al. 2010, Donati et al., 2011). However, what is not yet clear is how the above behavioral and ecological flexibility may affect animal stress levels. Therefore, one part of our project conc erned the study of stress by measuring fecal glucocorticoids level s. However, the aim of this piece of research is to understand whether the population of red collared brown lemurs in Mandena uses different ecological and social strategies as compared to the population living in the well preserved forest of the Sainte Luce area. I n particular we investigated whether or not, in the more degraded forests of Mandena, lemurs use more energy-saving behaviors to compensate a lower quality diet.
To answer these questions our work was structured in several different levels of investigation : habitat use, activity pattern s, feeding ecology, behavioral thermoregulation, and sociality. These eco-ethological aspects were studied at both sites of Mandena and Sainte Luce. The data collected allowed us to integrate knowledge
18
on Eulemur collaris , that in some aspects were scarce, especially as concerns social structure.
The comparison of the data obtained from groups living in well preserved and in degraded habitats allowed us to recognize ecological and social strategies/behaviors used by Eulemur collaris to survive in a secondary forest. This knowledge is essential for proper wildlife management which leads to preservation of the species and of the ecosystem. In fact, to protect Eulemur collaris means to protect the littoral forest and its biodivers ity.
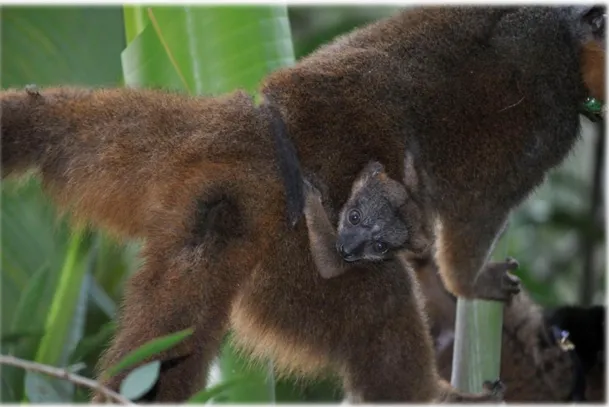
Figure 2.2: Olivia, infant of group C at Mandena, aged 1 month. Olivia was born on October 4th 2011, and this photo was taken on November 4th 2011. Olivia in this photo was still young to move and feed alone, and her mother, Mamiska, cared about her. Photo by Marco Campera.
19
CHAPTER 3
MATERIALS AND METHODS
3.1 Study site and species
This comparative study was conducted in the littoral forest fragments of Mandena (MAN) and Sainte Luce (STL) near Fort Dauphin in south -eastern Madagascar (Fig 3.1).
Fig. 3.1: Study sites and forest conservation status. Map of littoral forest fragments remaining in 2000 at Sainte Luce and Mandena. Study sites in Mandena (M15 and M16) are more degraded than the study site in Sainte Luce (S9), that is well preserved. Map by QMM, modified.
20
The Conservation Zone of Mandena (24°57' S, 47°0' E), 11 km North-West of Fort Dauphin, is located on sandy soils at an altitude 0–20 m above sea level. Our study was conducted in M15 and M16 fragments (about 148 ha of ‘fairly degraded’ litt oral forest), included in the Conservation zone. The two fragments are surrounded by a swamp (approximately 82 ha), that collared lemurs use for daily activities such as travelling, resting and feeding, but also for drinking during hottest periods. Thus, w e considered the two fragments (M15 and M16) and the swamp as a single area of about 240 ha, included in the Conservation zone. The average canopy height in M15 and M16 is 8.9 ± 4.4 m (Rabenantoandro et
al., 2007). In addition, some group s of Eulemur colla ris use to live
in another smaller fragment not included in the Conservation Zone: M20, that is approximately 6 ha of “heavily deg raded” forest, and is located North-East of the other two fragments (see Ganzhorn et
al., 2007 for fragment areas). Collared l emurs use especially t he
swamp that links M20 to other fragments. This swamp (about 40 ha) is called by local people analamafotra (ala = forest) from the vernacular name of the tree ( mafotra) that characterize this swamp (“the forest of mafotra”). This swamp is out of the Conservation Zone and local people use it to pick up fruits, gather dead woods and cut trees. In addition to Eulemur collaris , four nocturnal (Microcebus murinus , Cheirogaleus medius , Cheirogaleus major ,
Avahi meridionalis ), and one cathemeral lemur species ( Hapalemur meridionalis ) are found in this area.
The second study site, the littoral forest of Sainte Luce (24°46’S, 47°10’E), about 30 km North of Fort Dauphin, is among the most
21
intact littoral ecosystems in Madagascar and possess es a very high vegetation diversity (Bollen and Donati, 2006). Our study fragment was S9, about 252 ha of ‘well preserved’ littoral forest and swamp, 190 of which are included in the Conservation Zone. Eulemur
collaris still occur s in S17, an ‘almost intact’ fr agment of 237 ha,
all included in the Conservation Zone. We studied only groups in S9 because in S17 there are no tracks and there is not a biological station as in S9. The average canopy height in S9 is 14.7 ± 4.3 m (Rabenantoandro et al., 2007). In addit ion to Eulemur collaris , four nocturnal (Microcebus murinus , Cheirogaleus medius , Cheirogaleus
major, Avahi meridionalis ), are present in S9. Hapalemur meridionalis is not present at Sainte Luce because the swamp, that
is vital for this crit ical species, i s smaller than the one present at Mandena.
Floristically Mandena and Sainte Luce littoral forests are very similar, suggesting that these two areas were once connected. However, structural differences indicate that at the time of our study, the Mandena for est represents a degraded form of the vegetation type present at Sainte Luce. This hypothesis is also suggested by the absence of some tree families known to be logged in Mandena but not in Sainte Luce (Rabenantoandro et al., 2007).
Individuals of red coll ared brown lemurs presently living in the Mandena forest fragments have been translocated in M15 and M16 between 2000 and 2001 (Donati et al., 2007b) from other littoral forest fragments (M3 and M4), threatened by charcoal maker s (Fig.
22
3.2). M15 and M16 in the meantime beca me an effective protected area.
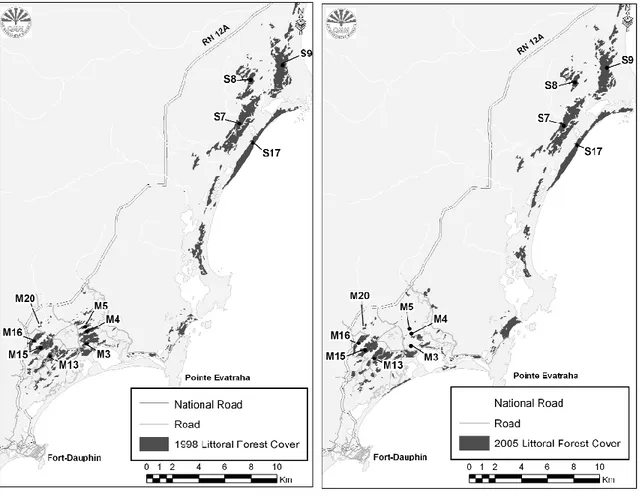
Fig. 3.2: Forest fragments in Mandena and Sainte Luce and and extent of littoral forest reduction between 1998 and 2005 (Donati et al., 2007b).
Translocation is rare in lemurs, and it is a risky option, but in this case it was the only opportunity to avoid the extinction of the species at Mandena (now M3 and M4 are ‘extremely degraded’ forest fragments). At the moment of translocation the animals were 28, resulting in a density of 12 individuals per km2 (Donati et al, 2007b). Then, after a slight reduction, they were 36 in 2003, suggesting a good response to translocation and a good adaptation
23
to the new environment (Donati et al., 2007b). Unfortunately, in 2004 animals decreased to 25 due to predation by two immigrated subjects of Cryptoprocta ferox , that, subsequently, have been captured and then transferred to the Antananarivo Botanical and Zoological Park of Tsimbazaza.
During our study period the population of red collared brow n lemurs in Mandena was about 17 animals. The cause of this reduction of population density is still unknown. It may be due to predation, scarcity of food resources, hunting for food by local people or to animal migration towards other forest fragments out of the Conservation Zon e. So, during our observation period, the density of E. collaris in Mandena was about 7 individuals per km2. This is well below the density of 38 ind/ km2 found in Sainte Luce in 2002 (Donati, 2002), which probably increased until 2011 due to cessation of human hunting. However, this remains an unproved hypothesis since we were not able to make a census.
3.2 Behavioral data
Data were collected from July 2011 to January 2012, as a second part of an one year project (from February 2011 to July 2011 data were collected by Marta Barresi and Valentina Serra). I collected data with Michela Balestri, and on July 2011 data was collected by the two team pairs to evaluate inter -observer differences .
24
We collected data on four groups of Eulemur collaris (see chapter 1 for further informatio n on the species): two groups at Mandena (group AB and group C), and two groups at Sainte Luce (group A and group B). Group composition is shown in table 3.1.
STE LUCE MANDENA
Group A Group B Group AB Group C
Adult males 4 3-4 2 2-3
Adult females 3 3-4 1 1-2
Juveniles 1 2 0 1
Infants 5 3 1 1
Total 13 11-13 4 5-7
Table 3.1: Composition of the four study groups during the study period.
Every lemur of each group under study at Sainte Luce received a malagasy name given by the first two students (Marta and Valentina), while the QMM biodiversity staff gave names inspired on a Brazilian soap called Cor do Pecado to the animals of Mandena groups. Me and Michela gave Malagasy names to the infants born in the second study period at both study sites . Group composition changed over time: in group B one adult male (called Fotsy that means white) and one adult female (called Rano that means water) left the group in September, probably due to overcrowding, hopefully not to hunting or predation. Also in group C one sub-adult female (Tina) left the group in September. In this case we are sure that Tina is still alive because she is collared and we saw her with a male. Probably, it i s not by chance that she left the group a sho rt time before the birth season and after the mating
25
season. Strangely, one male (Eddy) chased away from group AB on June (after a battle with the dominant male of the group, Abelardo), joined group C in September after a period apent living alone. Infants were born between the end of September and the beginning of October. Every adult female in our group gave birth to at least one infant, and two females (ca lled Volana and Ala that mean moon and forest) in group A gave birth to two twins (Volana one male and one female, Ala two females). (see chapter 9 for further information on social structure)
To ensure a continuous observation, four animals (one for each group) were captured in order to install radio -tracking collars, to be monitored by the use of a SIK A receiver (Biotrack). The adult individuals were captured by caging them, using banana slices as a bait, and rapidly anesthetized with Zoletil 100 (5 mg/kg of tiletamine hydrochloride) to prevent trauma. Morphometric measurements were taken (appendix IV) and then thermo -sensitive collars TW-3 (medium mammal tag) were fixed. All animals recovered from anesthesia within 1.5 hours and were not moved from the capture area nor kept in a cage, but were followed until regaining full mobility. There were no injuri es as a consequence of the captures.
Every group was followed four days per month and one group per site was followed one night per month. Overall, 556 diurnal observation hours in Mandena (296 h 25’ in group AB, 259 h 35’ in group C) were compared with 56 4 hours in Sainte Luce (282 h 55’ in group A, 282 h 25’ in group B), while the amount of nocturnal
26
observations was 152 hours, 76 h 20’ in Mandena and 75 h 40’ in Sainte Luce. Diurnal observation hours were distributed as shown in Figure 3.3.
Fig. 3.3: Monthly amount of observation hours at Sainte Luce (group A and group B) and at Mandena (group AB and group C).
The lower amount of observation hours for group C is mainly due to the impossibility to follow this group into the swamp during wet periods, wh en the water level of the marsh made obser vations impossible. Moreover, on January a cyclone passed near our region and caused a lot of precipitation that covered the unmade roads. Thus, we stopped our work in Sainte Luce, due to the impossibility to come back in Fort Dauphin to take the flight back for Italy if the precipitation had gone on.
The groups were followed from 6:00 to 18:00 during each observation day and from 18:00 to 6:00 during each observation night. A focal animal was chosen among the adul t individuals,
0 10 20 30 40 50 60 70 80 90 100
JUL AUG SEP OCT NOV DEC JAN
Ho u rs A B AB C
27
trying to balance the time spent observing males and females. The focal animal was followed as long as possible, and substituted with the first visible animal of the same sex when it was lost. Individual recognition was possible observing ra dio-collars and some characteristics of the animals such as age, sex, size, canine length, tail shape, fur color, and distinctive traits. We collected ethological data using the instantaneous sampling method, with records every five minutes, the all occurr ences method and the ad libitum method (Altmann, 1974). Behavioral data concerned animal activity: resting, moving, feeding, social interactions and anti -predator strategies, recorded by the use of a specific ethogram, shown in Appendix I (Donati, 2002, mo dified in this study). We also recorded resting/huddling postures, position in the tree crown (height, distance from the trunk), proximity, food items, and tree species.
During nocturnal observations it was often impossible to recognize a specific animal, we therefore followed the general activity of the group. We used a very basic ethogram, with the only voices of resting, moving and feeding, but we could often only assess if animals were active or not (see chapter 5). Trees were marked after three instant aneous of focal animal resting or during one instantaneous of feeding with a flag signed by a specific code (group name-activity-progressive number), and the diameter at breast height (DBH) was measured. Then the field assistant provided the vernacular nam e of the species and a small branch sample for identification. By these data a botanist of QMM was able to identify the scientific names of the plants. List of species
28
used as feeding plants from July 2011 to January 2012 by E.
collaris is shown in Appendi x II. Every half hour the position of
the animals was recorded by GPS (Garmin eTrex Legend HCx ).
3.3 Statistical analysis
We mostly used non parametric statistical analyses (Mann -Whitney test, Kruskal -Wallis test, Spearman correlation index) because the sample size was often small, and the Kolmogorov -Smirnov test indicated significant deviations from normality. Specific statistical analysis are described in each chapter.
We performed all tests with STATISTICA for Windows, version 8.0 and we considered p<0. 05 as the significant level.
29
CHAPTER 4
HABITAT USE
4.1 Introduction
Ecological factors such as forest structure, resource availability and predation, are critical in determining the spatial distribution of primates (Boyle et al., 2009a). Home range is defined as “that area traversed by the individual in its normal activities of food gathering, mating, and caring for young” (Burt, 1943). Because most habitats are heterogene ous, the animal will likely not use the whole home range in equal proporti on. Home range size can vary according to the body weight, diet, sex, and age , and according to season, population density , and climate (Burt, 1943; Clutton -Brock and Harvey, 1979 ). A uniform distribution of food resources allows animals to mi nimize their movements to fulfil energy needs, while a habitat where resources are more scattered, oft en requires more travelling. So, the conservation status of the habitat plays a fundamental role in shaping home range dimension, in relation to resource distribution and availability (Merker et al., 2005; Schwitzer et al., 2007b).
Home range also varies in relation to social systems and activity cycles. The home range of the smallest lemur, the nocturnal and solitary Microcebus murinus is 0.6-4.8 ha, depending on sex a nd reproductive cycle (Radespiel, 2000), while the ranging area of one
30
of the largest lemurs, the diurnal and group living Propithecus
diadema is 25-100 ha (Wright, 1995). However, ranging patterns in
the family Lemuridae appear to be mostly influenced by forest type than by group size (Sussman, 1974; Curtis and Zaramody, 1998): groups of Lemur catta and Eulemur rufus , which inhabit forests of different type, have different home range areas in spite of similar group sizes (Sussman, 1974; Overdorff, 1996).
The well preserved forest fragment at Sainte Luce and the degraded fragments at Mandena provide ideal observational conditions to make comparisons between strategies used by groups of Eulemur
collaris living in different habitats in the wild. In this chapte r we
will analyze differences in overall (from July 2011 to January 2012), month ly and daily home ranges among the four groups and between the two sites. Additionally, we will evaluate the number and the size of feeding trees used by lemurs during our stud y period. In Mandena we expect to find significant differences as compared to Sa inte Luce, such as increase in ranging areas and in the number of feeding trees used daily, as already shown by Donati
et al., 2011.
4.2 Materials and methods
We collected beh avioral data using the instantaneous sampling method, with records every five minutes, the all occurrences method and the ad libitum method (Altmann, 1974). Trees were marked after three instantaneous of focal animal resting or during
31
one instantaneous of feeding with a flag and a specific code (group name-activity-progressive number, e.g. ABR1 is the first resting tree of group AB, and AB1 is the first feeding tree of group AB). Tree height was estimated at 1 -m intervals and the diameter at breast height (DBH) was measured. T he field assistant provided the vernacular name o f the species and collected a small branch sample for identification. By these data a botanist of QMM was able to identify th e scientific names .
We recorded animal location every 30 minut es by GPS (Garmin eTrex Legend HCx) during diurnal and nocturnal observations. We conducted analyses of home range size and location via Ranges 7 (Anatrack Ltd.). We estimated the monthly and the overall home ranges per group via 100% minimum convex polygo ns (MCP) with harmonic means centers using all the location points. The method creates a polygon including all the locations where an individual was observed (Mohr, 1947). Although it is a quick and easy method, it is also well known to overestimate home r ange size (Barg et al., 2005; Burgman and Fox, 2003; Mohr, 1947; Pimley et
al., 2005). We therefore also used 95% and 50% adaptive core
weighted Kernel analyses with contours fitted to locations and fixed multiplier . This method is based on the actual amou nt of use of different areas by a given individual (the utilization distribution) and therefore produces much more accurate home range estimates, excluding the outliers (Barg et al., 2005; Pimley et al., 2005). We calculated day range (ha) and area used pe r hour (ha/h) for each day in each study site to evaluate the lemurs’ use of the forest. The primary purpose for calculating day range was to determine whether
32
the lemurs in the fragments were maximizing the entire forest fragment daily. We determined an h ourly average in addition to a total daily area because contact hours with the lemurs varied daily and between groups. Additionally, we calculated the daily distance traveled (km) and the distance traveled per hour (km/h) for each day. Graphic representati ons of home ranges were performed with Map Source (version 6.13.7, Garmin Software), and with Range 7 (95% Kernel method), using all waypoints per group and the site pathways tracked by GPS.
Statistical comparisons between sites or groups were made by the non parametric Mann -Whitney U test and Kruskal -Wallis H test for independent data. T -test for independent data was performed in the case of normal distributions. Normal distribution was tested via Kolmogorov -Smirnov and Lilliefors test for normality. We performed all tests with STATISTICA for Windows, version 8.0 and we considered p<0.05 as the significant level.
33 4.3 Results
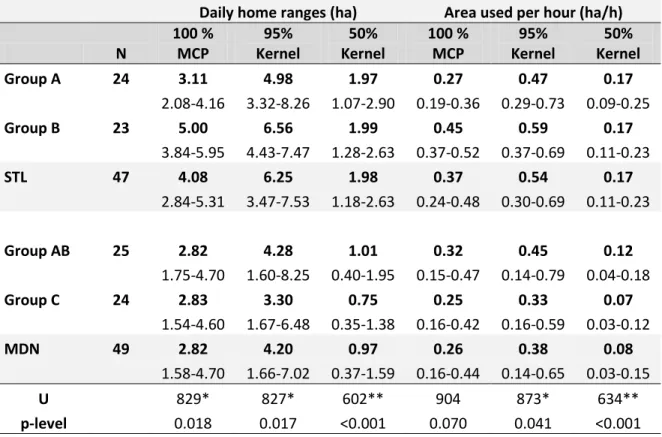
Overall home ranges of Eulemur collaris at Sainte Luce (groups A and B) and Mandena (groups AB and C), calculated via 100% mini mum convex polygon method (MCP), were on average ( ±SD) 18.81±1.82 h a and 83.61±41.28 ha respectively; using th e 95% Kernel method they were 14.82±0.69 ha in Sainte Luce and 49.82±28.55 ha in Mandena. Average core areas calculated via 50% Kernel method wer e ( ±SD) 4.13±0.13 ha at Sainte Luce and 8.44±5.11 ha at Mandena (Table 4.1).
Table 4.1: Overall home range values of the four study groups during the study period. MCP:
Minimum convex polygon.
Overall home range area (ha)
100 % MCP 95% Kernel 50% Kernel
Group A 20.09 15.31 4.04
Group B 17.53 14.33 4.22
Group AB 54.42 29.63 4.82
Group C 112.80 70.00 12.05
As regards monthly home ranges (Table 4.2), comparisons between the four groups gave significant differences (H (3, N=27) =16.91, p<0.001) using the MCP only. The Kruskal-Wallis test gave no statistically significant differences using the 95% K ernel method (H (3, N=27) =2.876, p=0.411) and the 50% K ernel method (H (3, N=27) =4.171, p=0.244). The Mann-Whitney U test between sites gave significa nt differences (U1 4 , 1 3=7, p<0.001) using the MCP
34 Table 4.2: Monthly home ranges values (mean and standard deviation) of the four groups. MCP:
Minimum convex polygon.
Monthly home ranges (ha)
100 % MCP 95% Kernel 50% Kernel Group A 9.48±2.99 11.97±4.70 3.91±0.93 Group B 10.34±3.27 9.51±3.22 2.73±1.15 Tot STL 9.91±3.04 10.74±4.08 3.32±1.18 Group AB 21.02±10.59 13.13±7.09 3.76±1.74 Group C 28.56±19.84 19.43±14.25 4.35±2.78 Tot MDN 24.79±15.77 16.28±11.29 4.06±2.25
Significant differences between group A and group B at Sainte Luce were found using the 50% K ernel method only (U7 , 7=7, p=0.02 5).
On the other hand, there were no statistically significant differences between group AB and group C using the three methods. Details on monthly home ranges per group are shown in figure 4.1.
Fig. 4.1: Monthly home ranges (ha) at Sainte Luce (group A and group B) and at Mandena (group AB
and group C). Values obtained via Kernel 95% method analysis (Range 7).
0 5 10 15 20 25 30 35 40 45 50
Jul Aug Sep Oct Nov Dec Jan
M o n th ly h o m e r an ge s (h a) A B AB C
35
Overall home ranges of the four stud y groups are represented in figure 4.2, 4.3 and 4.4. As regards daily home ranges we found significant differences between M andena and Sainte Luce with both methods (Table 4.3). In fact , daily home ranges of lemurs at Sainte Luce were higher than those at Mandena. Considering the different contact hours with the lemurs, the area used per hour remained significantly higher at Sainte Luce (tendency using the MCP). We found differences between lemurs at Sainte Luce (group B had daily home ranges and area used per hour significantly higher as compared to group A using MCP: U2 3 , 2 4=125, p=0.001, U2 3 , 2 4 =130,
p=0.002 respectively). No significant differences were found between group AB and group C.
Table 4.3: Daily home ranges and area used per hour of the four groups. Values are in medians (in
bold) and quartiles. MCP: Minimum convex polygon. Bottom: results of Mann-Whitney test between daily ranges and area used per hour at Sainte Luce and Mandena. *p<0.05 **p<0.01
Daily home ranges (ha) Area used per hour (ha/h)
N 100 % MCP 95% Kernel 50% Kernel 100 % MCP 95% Kernel 50% Kernel Group A 24 3.11 4.98 1.97 0.27 0.47 0.17 2.08-4.16 3.32-8.26 1.07-2.90 0.19-0.36 0.29-0.73 0.09-0.25 Group B 23 5.00 6.56 1.99 0.45 0.59 0.17 3.84-5.95 4.43-7.47 1.28-2.63 0.37-0.52 0.37-0.69 0.11-0.23 STL 47 4.08 6.25 1.98 0.37 0.54 0.17 2.84-5.31 3.47-7.53 1.18-2.63 0.24-0.48 0.30-0.69 0.11-0.23 Group AB 25 2.82 4.28 1.01 0.32 0.45 0.12 1.75-4.70 1.60-8.25 0.40-1.95 0.15-0.47 0.14-0.79 0.04-0.18 Group C 24 2.83 3.30 0.75 0.25 0.33 0.07 1.54-4.60 1.67-6.48 0.35-1.38 0.16-0.42 0.16-0.59 0.03-0.12 MDN 49 2.82 4.20 0.97 0.26 0.38 0.08 1.58-4.70 1.66-7.02 0.37-1.59 0.16-0.44 0.14-0.65 0.03-0.15 U 829* 827* 602** 904 873* 634** p-level 0.018 0.017 <0.001 0.070 0.041 <0.001
36
a) b)
c) d) Fig. 4.2. Overall home ranges of the four study groups.
Graphs obtained via 95% and 50% Kernel method analysis. White squares represent group waypoints (Range 7). Note the different scale.
a) Sainte Luce, home range of group A January); b) Sainte Luce, home range of group B (July-January); c) Mandena, home range of group AB (July-(July-January); d) Mandena, home range of group C (July-January).
37 Fig 4.3: Overall home ranges of group AB (above) and group C (below) at Mandena. White squares
represent group waypoints between July 2011 and January 2012; gray lines are the forest pathways at Mandena, tracked via GPS (black points are waypoints of pathways). Graphs performed with Map Source.
38 Fig 4.4: Overall home ranges of group A (above) and group B (below) at Sainte Luce. White squares
represent group waypoints between July 2011 and January 2012; gray lines are the forest pathways at Sainte Luce, tracked via GPS (black points are waypoints of pathways). Graphs performed with Map Source.
39
Daily distance traveled by lemu rs were significantly higher at Sainte Luce as compared to Mandena (Table 4.4). Considering the different contact hours with the lemurs, the distance traveled per hour remained significantly higher at Sainte Luce. Group B had significantly higher distance traveled per day (U2 3 , 2 4=144, p=0.005)
and per hour (U2 3 , 2 4=144, p=0.005) as compared to group A. In
Mandena we found no significant differences between group AB and group C.
Daily distance (m) Distance per hour (m/h)
Group A 24 898.1 78.4 427.0-1430.5 36.9-121.7 Group B 23 1092.0 100.0 605.0-1965.1 51.9-172.2 STL 47 1057.5 93.0 427.0-1965.1 36.9-172.2 Group AB 25 765.1 73.1 312.9-1555.7 29.8-158.8 Group C 24 759.0 64.3 331.4-1397.7 35.4-135.4 MDN 49 765.1 70.9 312.9-1555.7 19.8-158.8 U 634** 748** p-level <0.001 0.003
Table 4.4: Daily distance traveled and distance traveled per hour of the four groups. Values are in
medians (in bold) and range (min-max). Bottom: results of Mann-Whitney test between daily distance and distance per hour at Sainte Luce and Mandena. *p<0.05 **p<0.01
The proportion of home range locations that fall within the home ranges of the other group living in the same site, calculated via Kernel 95% and minimum complex polygon are shown in Table 4.5.
40
AB (on C hr) C (on AB hr) A (on B hr) B (on A hr)
Kernel 95% 9% 2% 6% 5%
MCP 100% 15% 17% 13% 8%
Table 4.5: Overlap of range locations on home ranges (hr) of groups at Mandena and Sainte Luce.
Proportion of locations of group AB that fall within the home range of group C and vice versa. Proportion of locations of group A that fall within the home range of group B and vice versa. Home ranges calculated via Kernel 95% or Minimum Convex Polygon (MCP) 100% methods.
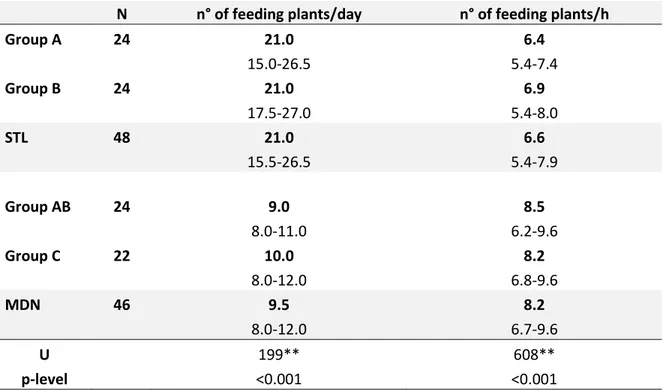
Lemurs at Sainte Luce used a higher number of feeding plants per day than those living in Mandena (Table 4.6). However, considering the different time spent by lemurs feeding each day, the number of feeding plants used per hour of daily feeding was significantly higher in Mandena as compared to Sainte Luce. No significant differences were present between groups living in the same sites.
N n° of feeding plants/day n° of feeding plants/h
Group A 24 21.0 6.4 15.0-26.5 5.4-7.4 Group B 24 21.0 6.9 17.5-27.0 5.4-8.0 STL 48 21.0 6.6 15.5-26.5 5.4-7.9 Group AB 24 9.0 8.5 8.0-11.0 6.2-9.6 Group C 22 10.0 8.2 8.0-12.0 6.8-9.6 MDN 46 9.5 8.2 8.0-12.0 6.7-9.6 U 199** 608** p-level <0.001 <0.001
Table 4.6: Daily number of feeding plants used by lemurs and number of feeding plants used by
lemurs per hour of feeding in the four groups. Values are in medians (in bold) and quartiles. Bottom: results of Mann-Whitney test between daily number of feeding plants and number of feeding plants used per hour of feeding at Sainte Luce and Mandena. *p<0.05 **p<0.01
41
A total of 748 (363 for group A, 385 for group B) feeding plants used by lemur groups in Sainte Luce and 461 (247 for group AB, 214 for group C) in Mandena were marked and measured. The analysis of the size of feeding trees showed that Mandena groups fed on smaller plants, in term of height and DBH, than those used by Sainte Luce groups. The mean DBH and height of the feeding trees used by lemurs are shown in Table 4.7. Frequency classes of height and DBH of feeding trees and normality t ests are shown in Figure 4.5 and 4.6.
Table 4.7: Dimensions of feeding trees (DBH and height) in Mandena and Sainte Luce. Values are in
means and standard deviations. Bottom: results of T-test between dimensions of feeding trees used at Sainte Luce and Mandena. *p<0.05 **p<0.01
N DBH of feeding trees (cm) Height of feeding trees (m)
Group A 350 20.82±10.79 9.37±2.89 Group B 270 22.82±13.81 8.64±2.57 Tot STL 620 21.69±12.23 9.05±2.78 Group AB 212 13.88±10.62 6.12±1.90 Group C 206 13.29±8.13 5.46±1.50 Tot MDN 418 13.59±9.47 5.79±1.74 T 11.44** 21.29** p-level <0.001 <0.001
42 height of feeding trees - Sainte Luce
K-S d=,10031, p<,01 ; Lilliefors p<,01 Expected Normal 0 1 2 3 4 5 6 7 8 9 10 11 12 13 14 15 16 17 18 Height (m) 0 20 40 60 80 100 120 n ° o f fe e d in g t re e s
Height of feeding trees - Mandena K-S d=,18979, p<,01 ; Lilliefors p<,01 Expected Normal -1 0 1 2 3 4 5 6 7 8 9 10 11 12 13 Height (m) 0 20 40 60 80 100 120 140 160 n ° o f fe e d in g t re e s
Fig. 4.5: Frequency classes of height of feeding trees in Mandena and Sainte Luce. Normal distribution
tested via Kolmogorov-Smirnov (K-S) and Lilliefors test for normality. Graphs performed with Statistica 8.0.
43 DBH of feeding trees - Sainte Luce
K-S d=,07109, p<,01 ; Lilliefors p<,01 Expected Normal -10 -5 0 5 10 15 20 25 30 35 40 45 50 55 60 65 70 75 80 85 90 95 100 DBH (cm) 0 20 40 60 80 100 120 140 n ° o f fe e d in g t re e s
DBH of feeding trees - Mandena K-S d=,12509, p<,01 ; Lilliefors p<,01 Expected Normal -10 -5 0 5 10 15 20 25 30 35 40 45 50 55 60 65 70 75 80 85 90 95 100 DBH (cm) 0 20 40 60 80 100 120 n ° o f fe e d in g t re e s
Fig. 4.6: Frequency classes of DBH of feeding trees in Mandena and Sainte Luce. Normal distribution
tested via Kolmogorov-Smirnov (K-S) and Lilliefors test for normality. Graphs performed with Statistica 8.0.
44 4.4 Discussion
As expected on the basis of previous studies (Donati et al., 2011), home ranges were larger in the degraded forest fragments of Mandena as compared to the intact forest fragments of Sainte Luce . In particular, group C had exceptionally high home range values as compared to other brown lemurs. In fact, we found an overall home range of 112.80 ha with the minimum convex polygon method, while according to literature , brown lemurs living in eastern rainforests tend to have ranges from 12 to 100 ha (Overdorff, 1991; Vasey, 1997 ). In particular , Eulemur fulvus rufus is known to have the widest home ranges (between 8 5 and 100 ha) found so far in the brown lemurs group (Overdorff, 1996; Vasey, 1997). Considering that Mandena Conservation Zone is almost 240 ha (see chapter 3), and that group C and group AB had a limited home range overlap, we can argue that the two groups used a lmost 160 ha of Mandena forests and swamps, almost 65 % of the Conservation Zone. Group C used also M20 occasionally, which is a fragment out of the Conservation Zone. We saw another group (about 5 individuals) of
Eulemur collaris living in Mandena (approx imately between analamafotra and M20), showing a home range overlap with group
C, and we know that Tina (group C) left the group and joined a solitary male, remaining in M15. Those four groups are the only known in Mandena, and we noted that they tend to exploit at maximum forest fragments and swamps. In fact, Mandena hosted approximately 17 individuals of E. collaris at the moment of our study, having a low interspecific competition. Probably, group size reduction in Mandena was a crucial step for E. collaris to minimize
45
intra-group resource competition, that in a degraded habitat is more intense and challenging. Decrease in group size has been reported also for other primate species that inhabit fragmented and/or degraded forests, such as the black -and-white colobus (Onderdonk and Chapman, 2000; Marshall et al., 2005), the red colobus (Marshall et al., 2005), the black spider monkey (Symington, 1988), the crowned lemur (Wilson et al., 1989), and the barbary macaque (Machairas et al., 2003).
Home ranges in Sainte Luce were smaller as compared to those at Mandena, but in line with other brown lemurs. We found home ranges near 20 ha. Home range of group B (17.5 ha) was in line with Donati, 2002 (20.5 ha), while the home range of group A (20.1 ha) was very diffe rent (96.8 ha). This was mainly due to the fact that we analyzed the data between July 2011 and January 2012, while in Donati, 2002 data were collected for 14 months. In fact, from February 2011 to June 2011, the other students, Valentina Serra and Marta B arresi, noted a different habitat use in group A, and overall home ranges were higher. Additionally, Donati (2002) found the highest monthly home range (56.4 ha) on March. Thus, we will join our data in order to have one year of data.
The highest monthly home range during our study period was reached by group C on September (69.3 ha, via MCP). While group A reached at maximum 15.7 ha on November, group B 15.9 ha in October and group AB 37.4 ha on January. Group B had monthly home ranges (from 5.6 to 15.9 ha) slightly lower as compared to those found by Donati, 2002 (from 11.6 to 17.1 ha), while group A
46
had monthly home ranges (from 6.9 to 15.7 ha) much lower as compared to those found by Donati, 2002 (from 22.5 to 56.4 ha). In addition to the fact that our study had a shorter duration , we can also notice that resource availability was higher in our study period (see also chapter 6). In fact, the graphs obtained via the Kernel method (fig. 4.2) show that groups at Sainte Luce remained in the same area, well exploited by the two groups. Group A seemed to have a more uniform exploitation of his vital area, while group B had three more important core areas.
In Mandena, Kesch (unpub. data) collected data between August and December 2007. Group AB in that period was still divided in group A and group B. She found overall home ranges for group A and C near 70 ha, but the group composition was different. In particular group C was composed by three adults, while group A by five adults an d one juvenile. Home range siz e and the percentage of feeding and moving are positively correlated with group size (Isbell and Young, 1993; Barton et al., 1992; Janson, 1988; de Ruiter, 1986; van Schaik et al., 1983). This might explain why we found an higher home range for group C (no w composed by 5 individuals and one infant) and a lower home range for group AB (now composed by 3 individuals and one infant). However, in Sainte Luce we had smaller home ranges as compared to Mandena. This seems to be mainly due to the lower density dist ribution of productive feeding trees, that is the consequence of the higher level of degradation in Mandena (Ganzhorn et al., 2007). Thus, the animals need large home ranges to find enough feeding trees, possibly also to visit some especial ly productive feeding trees . In fact, the conservation
47
status of the habitat plays a fundamental role in shaping home range size, in relation to resource distribution and availability (Merker et al., 2005; Schwitzer et al., 2007b).
By contrast, daily home ranges and daily distance trave led were higher at Sainte Luce as compared to Mandena. Curiously , group B, which had the lowest overall home range, had the highest daily range and distance t raveled. We must consider that K ernel density estimators (Worton, 1987) are not rel iable to calcula te daily range, because they tend to be inconsistent and to overestimate the size of the area when sample size is low (Boyle et al., 2009). Thus, in this case it is better to consider daily ranges calculated via the minimum convex polygon (Odum and Ku enzler, 1955). We must also take into account the different contact hours with the lemurs, that varied daily and between groups. Thus, the most reliable comparisons were done considering the areas used per hour, calculated via the minimum convex polygons. In this case we did not found a significant difference between Mandena and Sainte Luce, but a strong tendency. Distance traveled per hour remained significantly different between Sainte Luce and Mandena.
The lower values of overall home ranges and the higher values of daily ranges and distance trave led by lemurs at Sainte Luce as compared to lemurs at Mandena suggested a higher food availability and a more uniform d istribution of food resources at Sainte Luce. In figure 4.2 we can see that at Ma ndena, especially for group C, lemurs had different and distant core areas . The higher values of daily ranges and distance traveled, in particular,
48
suggested that lemurs at Mandena had to save energy more than lemurs at Sainte Luce, as food avail ability an d quality in Mandena was lower (see chapter 6 and 7).
In the degraded forest of Mandena, lemurs used smaller feeding trees (considering tree height and DBH) than those living in the intact forest of Sainte Luce. The DBH (diameter at breast height) is positively correlated to bioma ss of fruits in a tree (Chapman et al., 1992). Moreover , our results showed that Mandena groups used a lower number of feeding plants per day than those of Sainte Luce, contrary to previous findings (Donati et al., 2011). However , the data cannot be considered reliable considering the different amount of time spent feeding by lemur s. As we will see in chapter 5, time spent feeding was higher in lemurs at Sainte Luce. In Donati et al., 2011 lemurs at Mandena spent more time feeding than those at Sainte Luce, and this can explain our different findin gs. In fact, we found a higher number of feedi ng plants per hour of feeding at Mandena as compared to Sainte Luce. This seems to support the hypothesis that l emurs at Mandena had lower an d more scatter ed food resources (i.e. trees at Mandena offered a low er amount of fruits since their DBH was significantly lower compared to those at Sainte Luce, therefore lemurs at Mandena have to feed on more trees in proportion of feeding time).
In conclusion, red collared brown lemurs showed two different strategies on habitat use: in a more degraded forest, such as Mandena, lemurs cope with the lower amount and more scattered distribution of food resources by reducing group size in order to
49
reduce food competition and increase their ranging areas, while in a more intact forest, such as Sainte Luce, lemurs have in general lower ranging areas and groups can support more individuals. However, daily ranges and distance travelled was higher at Sainte Luce, suggesting an influence of energy-saving behaviors at Mandena (see chapter 7). Moreover , habitat use can vary monthly, depending on food availability.
50
CHAPTER 5
ACTIVITY PATTERN
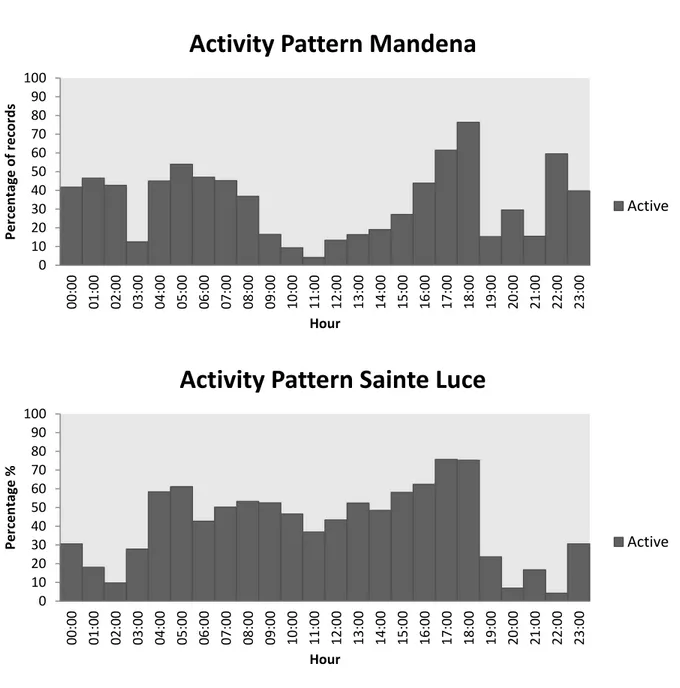
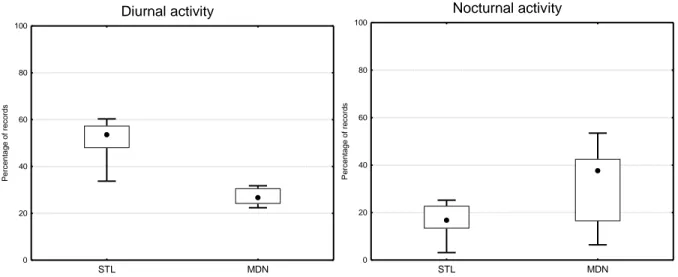
5.1 Introduction
Until about 30 years ago, primates were classi fied as either diurnal or nocturnal (Curtis and Rasmussen , 2006). Since the late 1970s, however, it was found that some lemur species of the genus
Eulemur regularly exhibited both nocturnal and diurnal activity; i.e.
they were active throughout the 24 h cy cle (Curtis and R asmussen, 2006; Tattersall, 1987 ). This pattern was first described in the wild by Tattersall (1979) for Eulemur fulvus on the island of Mayotte, between northern Madagascar and northern Mozambique. Later on, this pattern was also describe d for the congeneric species E.
albifrons, E. albocollaris, E. collaris, E. coronatus, E. macaco macaco, E. mongoz, E. rubriventer, E. rufus and E. sanfordi
(Wright, 1999; Vasey, 2000; Donati and Borgognini -Tarli, 2006; Colquhoun 2006). Tattersall (1987) f ormally introduced the term ‘cathemeral’: “the activity pattern of an organism can be regarded as cathemeral when it is about evenly distributed over the 24 h daily cycle, or when significant amounts of activity, particularly feeding and/or travelling, occ ur within both light and dark portions of the cycle” (p. 201). A cathemeral activity cycle has also been reported in a number of other lemur genera, such as Hapalemur
alaotrensis (Mutschler et al., 1998; Mutschler, 2002) and Prolemur simus (Tan, 2000; Gras si, 2001), and in neotropical owl monkeys of
51
the genus Aotus (Wright, 1994; Kinzey, 1997; Fernandez -Duque, 2003). Furthermore, cathemerality may occur in 2 howler monkey species, Alouatta pigra and A. palliata (Dahl and Hemingway, 1988; Curtis and Rasmusse n, 2002; Mutschler, 2002; Fernandez -Duque, 2003; Kirk, 2006).
E. collaris , as other Eulemur species, shows cathemeral behavior
(Curtis and Rasmussen, 2002; Kappeler and Erkert, 2003; Donati and Borgognini -Tarli, 2006; Schwitzer et al., 2007a), considered b y Engqvist and Richard (1991) as an adaptation to cope with a diet having a high fiber and a low carbohydrate content, especially during lean periods, in order to minimize the time in which no food is being processed. In support to this hypothesis Eulemur does not show anatomical or physiological adaptations that allow it to retain food in the gut for extended periods of time, thus increasing food energy absorption (Overdorff and Rasmussen, 1995). Other studies supported the “dietary theory” (Wright, 1999; Tarnaud, 2006; Donati et al., 2007a) and demonstrated that cathemerality is also influenced by lunar phases and by light intensity (Donati et al., 2001; Kappeler and Erkert, 2003; Donati and Borgognini -Tarli, 2006). Further hypotheses on the origin of cath emerality involve antipredator strategy (van Schaik and Kappeler, 1996) and interspecific competition (Tattersall and Sussman, 1998). In the first case cathemerality has been interpreted as a response to predation pressure by diurnal raptors, while for the second theory, it might be an ecological adaptation to minimize competition for food resources with other sympatric primate species.