PAPER • OPEN ACCESS
Monte Carlo simulation of the LIDAL-ALTEA detector system
To cite this article: C Berucci et al 2019 J. Phys.: Conf. Ser. 1226 012020
View the article online for updates and enhancements.
Monte Carlo simulation of the LIDAL-ALTEA
detector system
C Berucci1, C De Donato1,2, L Di Fino1, C La Tessa3,4, G
Masciantonio1, R Messi1,2, M C Morone1,2, A Rizzo1,2, M Rovituso3, F Tommasino3,4 and L Narici1,2
1
University of Rome Tor Vergata, Physics Department, Via della Ricerca Scientifica 1, 00100 Rome, Italy
2
INFN Sezione Roma Tor Vergata, Via della Ricerca Scientifica 1, 00100 Rome, Italy 3 Trento Institute for Fundamental Physics and Application - TIFPA INFN - Via Sommarive 14, 38123 Povo (Trento), Italy
4 University of Trento, Physics Department, Via Sommarive 14, 38123 Povo (Trento), Italy E-mail: [email protected]
Abstract. The LIDAL (Light Ion Detector for ALTEA) is a device designed to work paired with three silicon detector units of ALTEA (Anomalous Long Term Effects on Astronauts) in order to improve the particle identification capabilities of ALTEA on the International Space Station also providing Time-of-Flight measurements. The LIDAL-ALTEA goal is to measure ions from protons up to iron in real time. The improved measurements of the radiation environment inside ISS will be very valuable for radiation risk assessment and mitigation. It is necessary to have a detailed simulation of the apparatus response to cosmic ray nuclei in order to assess the detector response, its observational capabilities and to set the relevant parameters of the device. Here a new Monte Carlo simulation of the LIDAL-ALTEA setup and physics processes, in the framework of FLUKA, is presented. A comparison between Monte Carlo simulations and calibration data is also shown.
1. Introduction
The ALTEA (Anomalous Long Term Effects on Astronauts) experiment, developed by the Italian Space Agency (ASI), was aimed at the study of the transient and long term effects of cosmic particles on the astronauts cerebral functions [1]. ALTEA [2] has measured the particle flux in the U.S. Laboratory on the International Space Station (ISS) from 2006 to 2012, being able to discriminate the type of particles, to measure their trajectories and the delivered energies.
The LIDAL-ALTEA apparatus is an upgrade of the ALTEA detector scheduled to fly in the International Space Station (ISS) in 2019; its main goal is to measure in detail also the low-Z part of the particles spectrum inside the ISS, through Time-Of-Flight (TOF) technique, measuring the velocity β of the passing through particles.
Another important task of LIDAL-ALTEA is the Particle IDentification (PID). Indeed, matching β measured by LIDAL detector with the deposited energy (dE/dx) measured by ALTEA for each event, it will be possible to efficiently identify the different elemental species providing further help for a reliable risk assessment for astronauts in space. This paper describes
2
the MC techniques used as well as the results obtained for the two configurations, ALTEA and LIDAL-ALTEA, where the first one is used as a validation for the simulation code.
2. LIDAL-ALTEA setup
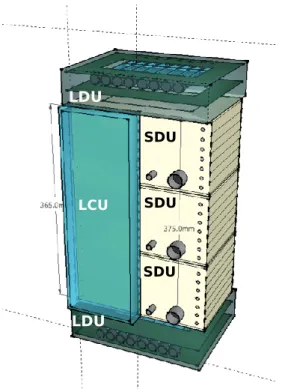
LIDAL detector will consist of three modules: two LDU (LIDAL Detector Unit) placed at a distance of 49 cm, with 8×(80×20×4 mm) scintillators each and one LCU (LIDAL Collector Unit), for data acquisition. LIDAL first prototype has been developed using plastic scintillator EJ230 (Eljen Technologies [3]) for fast timing application coupled with two PMMA light guides and two HAMAMATSU PMTs RS9880U210 [4].
LCU LDU LDU SDU SDU SDU
Figure 1. LIDAL-ALTEA setup. LI-DAL detector consists of three mod-ules: two LDU (LIDAL Detector Unit) and one LCU (LIDAL Collector Unit). In between the two LDU modules, three Silicon Detector Unit (SDU) of the ALTEA system are located.
The plastic scintillators are characterized by a rise time of 500 ps and a good light output of 9700 photons for 1 MeV electron. The PMTs, with a rise time of 520 ps and high quantum efficiency, assure the required fast response to perform TOF measurements with the needed detail. The generated signal is then processed by Front-End Electronics, in particular by the NINO chip [5]. According to the LIDAL prototipe tests at Trento Institute for Fundamentals Physics Applications (TIFPA) proton beam line, we expect to measure the particle TOF with a resolution better than σ = 120 ps [6] and to provide trigger for the light and fast particles to the whole detector system. In between the two LDU modules, three Silicon Detector Unit (SDU) of the ALTEA system will be positioned (see Fig. 1). The ALTEA detector system consists of a set of six SDUs, silicon strip particle telescope able to measure, in real time, the energy released by the ions and the trajectory of each incoming particle within the triggering window. Every SDU is composed of six planes, alternatively stripped along the X and Y axis with an active area of 2×(8×8) cm2 and a thickness of 380 µm. Each silicon chip is segmented in 32 strips with a pitch of 2.5 mm. The distance between an X and the correspondent Y plane is 3.75 mm, while the distance between each XY couple is 37.5 mm. The digital signal is driven to the Read Out Electronics (ROE) board, placed as a 7th plane of the telescope. The modularity of ALTEA detector system permits to work with different configurations, depending on the experiment involved. LIDAL-ALTEA system will use only three SDUs, a sketch of the experimental setup is shown in Fig. 1.
3. ALTEA test-beam preliminary results and MC simulation
A detailed Monte Carlo simulation of the detector system response to cosmic ray particles is necessary in order to evaluate its observational capabilities. The LIDAL-ALTEA apparatus was therefore simulated using a new FLUKA [7, 8] code. To achieve the best description of the data, the parameters of simulations are tuned with different methods. The simulation procedure started with the setup configuration already used during the ALTEA calibration test at the proton beam line at TIFPA in June 2016. Three different proton beams of 70, 91 and 119 MeV have been used to verify, after the ALTEA reentry, the performance of the detectors (SDU1,
SDU5 SDU6 XY XY XY XY XY XY (a) data 0 0.005 0.01 0 0.005 0.01 0 10 20 30 40 50 60 70 80 0 0.005 0.01 0 0.005 0.01 0 10 20 30 40 50 0 0.005 0.01 0 0.005 0.01 0 5 10 15 20 25 30 35 40 0 0.005 0.01 0 0.005 0.01 0 10 20 30 40 50 60 0 0.005 0.01 0 0.005 0.01 0 10 20 30 40 50 0 0.005 0.01 0 0.005 0.01 0 5 10 15 20 25 30 35 40 45 50 SDU5 SDU6
(b) Monte Carlo simulation
Figure 2. Energy release by 119 MeV protons, measured (top) and simulated (bottom), in twelve consecutive ALTEA planes corresponding to SDU5 and SDU6.
SDU2, SDU3, SDU4, SDU5 and SDU6) and the full electronics readout chain. A complete scan of each SDU was performed in order to check the functionality of all strips of the silicon detector telescope. All the beam settings have been simulated with FLUKA and the released energies in each SDU planes have been compared with the test beam data results. This procedure allows a strong check of the Monte Carlo calculation and at the same time, provides an important method to understand the critical points of ALTEA data analysis.
The structure and the composition of different material out of which the setup is built were reproduced with accuracy. The input parameters of the simulation, as geometrical and beam momentum spread, have been adjusted in such a way as to produce ∆E-E correlation with the same population of energies as in the test data. The ∆E-E technique is based on the measurement of the energies deposited in two detectors and is applicable when particles with kinetic energy E pass through the first detector and are stopped in the second one. An example of deposited energy correlation between calibration data and Monte Carlo simulation for consecutive XY silicon planes of SDU5 and SDU6 is shown in Fig. 2. In all spectrum, there are a large fraction of protons which have enough energy to pass through both silicon layers and reach the next SDU. They are responsible for a well-known characteristic “punch-through” line [9]. The III and VI plots correspond respectively to the deposited energy in the last XY silicon layers of SDU5 and SDU6; in this case, besides the passing protons, we can distinguish a near-diagonal lines. This is attributed to the protons which have an energy low enough to get stopped into the last 380 µm of silicon, while the reason why we can only measure stopped proton in the last SDU plane, depends on the ALTEA trigger logic.
4. LIDAL-ALTEA trigger system
ALTEA is triggered by incoming particles that cross the detector and release at least 1.09 MeV in all X-planes. Each SDU has an auto-trigger, with the signal compared with a ROE threshold and working in AND logic between the signal from the X-planes. LIDAL (LDU1, LDU2) is also triggered by passing through particles. Monte Carlo simulations with different proton energies
4
40 60 80 100 120 140
kinetic energy [MeV] 0 20 40 60 80 events [%]
Figure 3. Simulated trigger thresholds for each of the LIDAL-ALTEA system component: (left to right) SDU1, SDU2, SDU3 and LIDAL.
have been performed in order to assess energy losses by particles and identify the energy intervals detectable by the LIDAL-ALTEA trigger system. The detector system features an energy range defining regions of incoming proton energy triggering one or more of the four components (SDU1, SDU2, SDU3 and LIDAL). Fig. 3 describes this behavior. Detection range for each proton was obtained considering the maximum incidence energy, which corresponds to the lowest energy released by the particle (trigger threshold), and the minimum incidence energy, corresponding to the maximum energy loss. In particular, the minimum energy value is, for light particles like proton, the minimum energy that is necessary to reach the last plane of the detector and trigger the device while, for heavier particles, the energy that drives the device to saturation. One can notice that ALTEA SDUs are able to trigger protons with energy between 43 and 91 MeV, while LIDAL cover the rest of the protons spectrum.
5. Conclusion
In this preliminary work a comparison between calibration data results acquired with six SDUs and Monte Carlo simulations have been reported. Test results are in agreement with the device expected performances and have been used for energy calibration and for tuning the MC simulation. Finally, we can say that dE/dx and consequently the punch-through reconstruction was verified by MC simulations. These simulations, validated with the ALTEA calibration data, will be used to prepare the next beam test at TIFPA and GSI facilities needed to fully describe the new features of the integrated LIDAL-ALTEA detector. A following step will include a throughout simulation of radiation environment in ISS and an assessment of LIDAL-ALTEA behavior in orbit.
6. References
[1] Narici L et al (2008) New Journal of Physics 10 075010 [2] Zaconte V et al (2010) Rad. Meas. 45 168?72
[3] https://eljentechnology.com/products/plastic-scintillators/ej-228-ej-230 [4] https://www.hamamatsu.com/resources/pdf/etd/R9880UT-PMH1321E.pdf [5] Aghinolfi F et al (2004) IEEE Trans. Nucl. Sci. 51 1974-1978
[6] Rizzo A et al (2018) Nucl. Instrum. Meth. A898 98-104
[7] Ferrari A et al (2005) CERN-2005-010; INFN-TC-2005-11;SLAC-R-77 [8] Battistoni G et al (2007) AIP Conf. P roc. 896 31-49