1
Facoltà di Ingegneria dell’Informatica
Corso di Laurea in
Ingeneria Informatica
Dipartimento di
Electronica e
Informatzione e Bioingeneria
A Methodology and a Platform for Monitoring
Multi-Cloud Applications
Supervisor: Prof. Elisabetta Di Nitto
Assistant supervisor: Prof. Danilo Ardagna
Master’s thesis of: Narges Shahmandi Hoonejani matr.764761
3
Abstract
Owing to the rapid progress in the Information and Communications Technology (ICT) and the subsequent demand for computing power, Cloud Computing, as an efficient method for handling workloads of great diversity and massive scale, has received increasing attentions. Cloud Computing has been increasingly adopted in diverse areas, such as e-commerce, retail industry and academic environment due its various advantages including No up-front investments, lower operating costs, high scalability and elasticity, easy access and reduction of business risks and maintenance expenses.
However, despite the undeniable advantages and considerable spread of Cloud Computing, there are still many related challenges and issues which should be dealt with in order to ensure the efficient and proper operation of this new computing paradigm. Specifically in order to ensure the quality of service and health of the running applications of the Cloud, monitoring the Cloud infrastructures and applications is a crucial task. The solution that has been proposed is defining Data Collectors that are gathered data from resources and produce as the output RDF triples data, and the Data Analyzer that at a high-level could be seen as accepting in input RDF stream data, and producing one or more streams of data in RDF format as the output. In this thesis the DA is implemented by using C-SPARQL (continues-SPARQL) that is a query engine for RDF data.
In the present thesis, in the context of MODAClouds project, a monitoring framework will be developed which provides the enabling mechanism to trigger runtime adaption and to fill the gap between design-time modules and run-time application behavior. Aspect Oriented Programming, owing to its capability of keeping separate the cross-cutting features, has been chosen for developing the monitoring framework. Furthermore, meta-model for specifying the QoS, and meta-meta-model and language for monitoring rules at design time. Finally, a methodology for the automatic/semi-automatic translation of QoS constraints into monitoring rules for translating them into queries is defined.
5
1
INTRODUCTION
In a world characterized by rapid progress, demand for computing power has been increasing over the last half century. The penetration of Information and Communications Technology (ICT) in our daily social and personal interactions with the world, encompassing business, commerce, education, manufacturing and communication services, has led to the necessity of handling workloads of great diversity and enormous scale in all the crucial fields of today's society.
With the rapid development of processing and storage technologies, and owing to the success of the Internet, computing resources have become cheaper, more powerful and more universally available than ever before. In such a context, dynamic systems are required to provide services and applications which are more competitive, scalable and responsive in comparison to the classical systems. This technological trend has enabled the realization of a new computing paradigm called Cloud Computing, in which resources (e.g., CPU and storage) are provided as general utilities that can be leased and released by users through the Internet in an on-demand approach.
In a Cloud Computing environment, the traditional role of service provider is played by the infrastructure providers who manage Cloud platforms and lease resources according to a usage-based pricing model, and service providers, who rent resources from single or multiple infrastructure providers to serve the end users. The emergence of Cloud Computing has made a tremendous impact on the Information Technology (IT) industry over the past few years, where large companies such as Google [9], Amazon [2] and Microsoft [12] strive to provide more powerful, reliable and cost-efficient Cloud platforms, while business enterprises seek to reshape their business models to gain benefit from this new paradigm. Indeed, Cloud Computing provides several compelling features which takes the attentions of the business owners.
6 The new mechanism is increasingly adopted in many areas, such as e-commerce, retail industry and academic environment for its various advantages including No up-front investments, lower operating costs, high scalability and elasticity, easy access and reduction of business risks and maintenance expenses.
Cloud Computing uses a pay-as-you-go pricing model. A service provider does not need to invest in the infrastructure to start gaining benefit from Cloud Computing. It simply rents resources from the Cloud according to its own needs and pay for the usage. As a consequence, cloud model is cost-effective because customers pay for their actual usage without up-front costs.
Beside, resources in a Cloud environment can be rapidly allocated and deallocated on demand. Hence, a service provider no longer needs to provision capacities according to the peak load. This ensures huge savings since resources can be released to save on operating costs when service demand is low. In this way, costs are claimed to be reduced and in a public Cloud delivery model capital expenditure is converted to operational expenditure.
Additionally, Infrastructure providers pool large amount of resources from data centers and make them easily accessible. Scalability is possible via dynamic ("on-demand") provisioning of resources on a fine-grained, self-service basis near real-time, without users having to engineer for peak loads (surge computing). Indeed, a service provider can easily expand its service to large scales in order to handle rapid increase in service demands (e.g., flash-crowd effect).
Furthermore, services hosted in the Cloud are generally web-based. Therefore, they are easily accessible through a variety of devices with Internet connections. These devices not only include desktop and laptop computers, but also cell phones and smart devices. Agility improves with users' ability to re-provision technological infrastructure resources.
Moreover, by outsourcing the service infrastructure to the Clouds, a service provider shifts its business risks (such as hardware failures) to infrastructure providers, who often have better expertise than many customers and are better equipped for managing these risks. In this way Cloud Computing guarantees business continuity and disaster recovery. In addition, maintenance of Cloud Computing applications is easier, because they do not need to be installed on each user's computer and can be accessed from different places. Consequently, a service can cut down the hardware maintenance and the staff costs.
However, despite the considerable development and spread of Cloud Computing, it also brings many challenges and new problems in terms of quality of service (QoS),
7 Service Level Agreements (SLA), security, compatibility, interoperability, costs and performance estimation and so on. These issues have been analyzed and studied in the last few years but still a lot of investigation needs to be carefully addressed.
Accordingly, in order to ensure the quality of service and health of the running applications of the Cloud, monitoring the Cloud infrastructures and applications is a crucial task. Cloud monitoring also allows us to get insights into the system and to gather information and scalability and consequently coming up with adaptation decisions based on the monitoring data.
In general, the monitoring approaches differ from various points of view including monitoring actor, monitored object, timing of the monitoring procedure, monitoring mechanism, monitoring environment architecture and monitoring constraints and output. One of the important monitoring challenges is to tackle the different monitoring constraints imposed by different target clouds. IaaS and PaaS platforms offer very different metrics and therefore a multi-cloud monitoring platform has to cope with this heterogeneity.
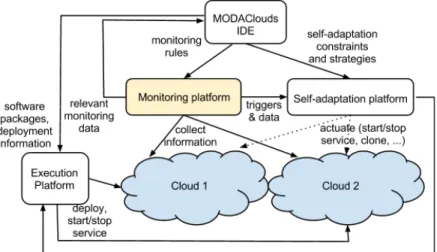
MODAClouds, Model-Driven Approach for design and execution of applications on multi clouds, is a European project which is focused on providing method, a decision support system, an open source IDE and run-time environment for the high-level design, early prototyping, semi-automatic code generation, and automatic deployment of applications on multi-Clouds with guaranteed QoS. MODAClouds includes a Runtime
Environment that will implement the MAPE-K loop (monitor, analysis, planning,
execution, knowledge) reference blueprint for the implementation of self-adaptive applications. The monitoring platform that is provided by this project affords a possible approach in order to face the heterogeneity data that are received from different layers of Cloud, that is explicitly distinguish between infrastructure-level metrics, that are exposed only on IaaS clouds, from application-level metrics, that will rely on monitoring probes injected in the application code and therefore can be collected on any target cloud.
The approach which has been proposed for developing the monitoring platform of MODAClouds project is defining Data Collectors which gather data from resources and produce the RDF triples data as the output, and the Data Analyzer that at a high-level could be seen as accepting RDF stream data as an input and producing one or more streams of data in RDF format as the output.
In the present thesis, in the context of MODAClouds project, a monitoring framework is developed which provides the enabling mechanism to trigger runtime adaption and to fill
8 the gap between design-time modules and run-time application behavior. The
corresponding Data Analyzer is implemented by using C-SPARQL (continues-SPARQL) that is a query engine for RDF data.
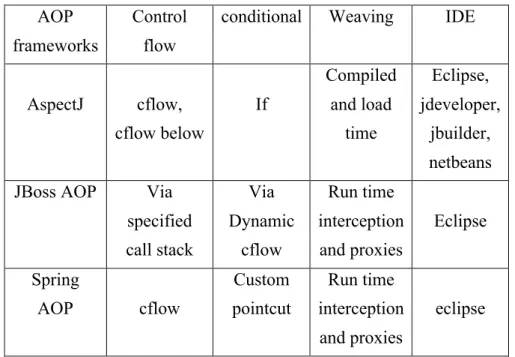
Different approaches can be employed for developing the cloud monitoring systems. Aspect oriented programming (AOP) is one of the proper choices that can be utilized for accomplishing this task especially for PaaS layer. The capability of keeping separate the cross-cutting features like response time, and status code of a web page, is the advantage which makes AOP a promising option for monitoring purposes . Accordingly AOP has been employed in the present work for developing the monitoring platform.
For IaaS layer resources, we considered the data of two cloud providers in specific, Azure and Amazon EC2. In Amazon EC2 the data are directly gathered from the CloudWatch, while in Azure as we could not gather them directly they have been retrieved from storage.
In addition, meta-model for specifying the QoS, and meta-model and language for monitoring rules at design time, are defined. Moreover, a methodology for the automatic/semi-automatic translation of QoS constraints into monitoring rules for translating them into queries is proposed.
Original Contributions
The main objectives of this work are as follows:
• Designing Data Collectors in order to gathering the monitoring data produced by the various data sources, and producing RDF triple as the output for the Data Analyzer in order to get inside the system, analyze the received data and apply further modifications
• Defining a meta-model that specifies the constraints of the Quality of the Service at design time,
• Defining a meta-model and a language for the specification of the monitoring rules at design time, and mapping the QoS constraints into the related monitoring rule. Also new monitoring rules were provided by extending or composing the other monitoring rules,
• Identifying a methodology for the automatic/semi-automatic translation of QoS constraints into monitoring rules for translating monitoring rules into probes and monitoring queries that will be executed by the analysis component
Outline of the Thesis
9 • Chapter 2 discusses the main concept of the cloud computing and cloud monitoring and explains the state of the art concepts and techniques relative to our work
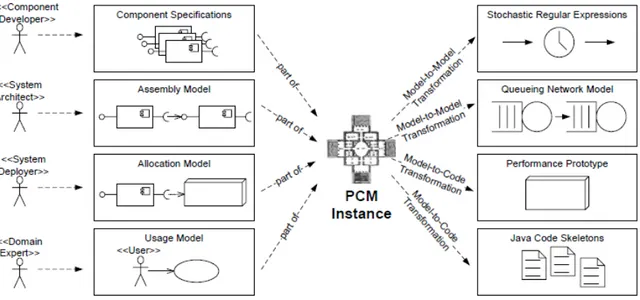
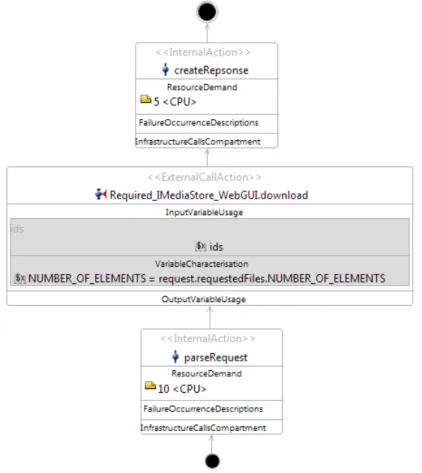
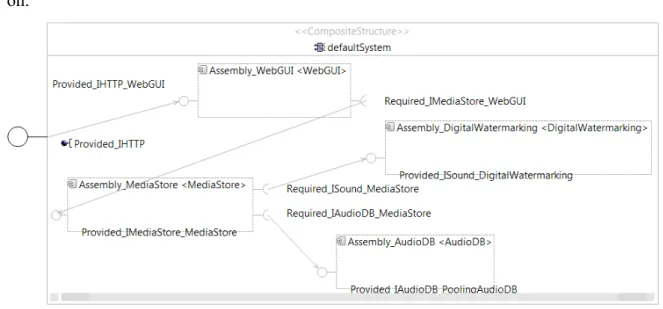
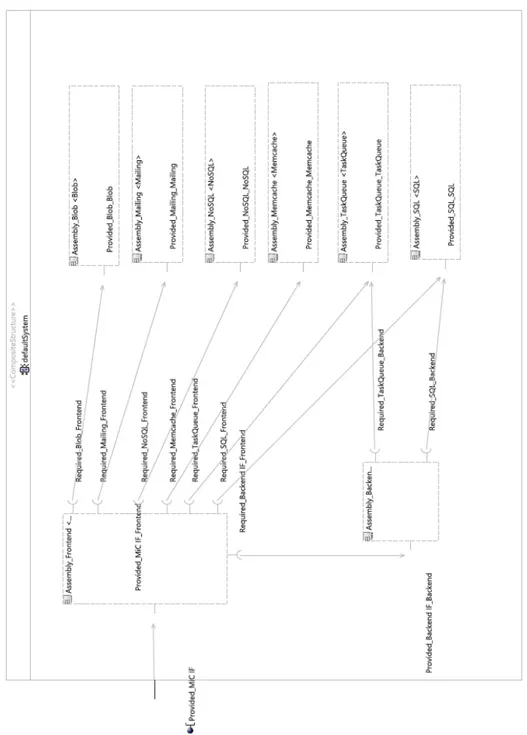
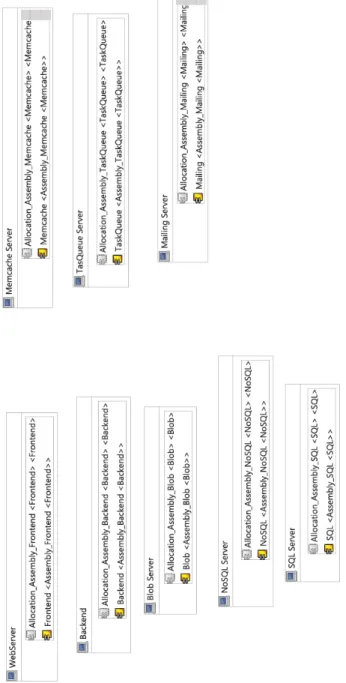
• In Chapter 3, first we introduce the MODAClouds project and then the main technologies that are used in this thesis are reviewed. In addition, there the case study of this thesis, MiC application, and its Palladio meta-models are provided.
• In Chapter 4 the monitoring architecture of MODAClouds, and related core ontology is reviewed and is described. Then knowledge base information generated during the design time and run time is explained. Finally dedicated to the mapping of the monitoring rules to C-SPARQL queries.
• Chapter 5 the monitoring approach that is developed in this thesis, is evaluated. The main objectives are quantitatively evaluation of the overhead that is introduce by the monitoring platform which are done on MiC application.
10
2
CHAPTER 2
This chapter presents a general overview on Cloud Computing and Cloud Monitoring and explains the state of the art concepts and techniques relative to our work.
After a short introduction on basic concepts in Section 2.1, we provide and analyze a definition of Cloud, illustrate the main characteristics and show different structural models.
In Section 2.2, we provide a general overview on Cloud Monitoring then we investigate the current monitoring platforms acting at different layers of the cloud stack. A classification of the state of the art literature which considers general monitoring, infrastructure-level monitoring and application level monitoring is also proposed.
2.1 C
LOUD
C
OMPUTING BASIC CONCEPTS
In a world characterized by progress, fast changes and advances, demand for computing power has been increasing over the last half century. Handling workloads of great diversity and enormous scale is necessary in all the most significant fields of today's society, due to the penetration of Information and
Communications Technology (ICT) in our daily interactions with the world both at personal and community levels, encompassing business, commerce, education, manufacturing and communication services. With the rapid development of processing and storage technologies, and with the success of the Internet, computing resources have become cheaper, more powerful and more universally available than ever before. In such a setting, dynamic systems are required to provide services and applications that are more
11 competitive, more scalable and more responsive with respect to the classical systems. This technological trend has enabled the realization of a new computing paradigm called Cloud Computing, in which resources (e.g., CPU and storage) are provided as general utilities that can be leased and released by users through the Internet in an on-demand fashion.
In a Cloud Computing environment, the traditional role of service provider is divided into two: the infrastructure providers who manage Cloud platforms and lease resources according to a usage-based pricing model, and service providers, who rent resources from one or many infrastructure providers to serve the end users. The emergence of Cloud Computing has made a tremendous impact on the Information Technology (IT) industry over the past few years, where large companies such as Google [9], Amazon [2]
and Microsoft [12] strive to provide more powerful, reliable and cost-efficient Cloud platforms, and business enterprises seek to reshape their business models to gain benefit from this new paradigm. Indeed, Cloud Computing provides several compelling features that make it attractive to business owners.
The new mechanism is increasingly adopted in many areas, such as e-commerce, retail industry and academy for its various advantages:
• No up-front investments: Cloud Computing uses a pay-as-you-go pricing model.
A service provider does not need to invest in the infrastructure to start gaining benefit from Cloud Computing. It simply rents resources from the Cloud according to its own needs and pay for the usage. As a consequence, cloud model is cost-effective because customers pay for their actual usage without up-front costs.
• Lowering operating costs: Resources in a Cloud environment can be rapidly
allocated and deallocated on demand. Hence, a service provider no longer needs to provision capacities according to the peak load. This ensures huge savings since resources can be released to save on operating costs when service demand is low. In this way, costs are claimed to be reduced and in a public Cloud delivery model capital expenditure is converted to operational expenditure.
• High scalability and elasticity: Infrastructure providers pool large amount of
resources from data centers and make them easily accessible. Scalability is possible via dynamic ("on-demand") provisioning of resources on a fine-grained, self-service basis near real-time, without users having to engineer for peak loads (surge computing). Indeed, a service provider can easily expand its service to large scales in order to handle rapid increase in service demands (e.g., flash-crowd effect).
• Easy access: Services hosted in the Cloud are generally web-based. Therefore,
12 devices not only include desktop and laptop computers, but also cell phones and smart devices. Agility improves with users' ability to re-provision technological infrastructure resources.
• Reducing business risks and maintenance expenses: By outsourcing the service
infrastructure to the Clouds, a service provider shifts its business risks (such as hardware failures) to infrastructure providers, who often have better expertise than many customers and are better equipped for managing these risks. In this way Cloud Computing guarantees business continuity and disaster recovery. In addition, maintenance of Cloud Computing applications is easier, because they do not need to be installed on each user's computer and can be accessed from different places. Consequently, a service can cut down the hardware maintenance and the staff costs.
However, despite the considerable development and spread of Cloud Computing, it also brings many challenges and new problems in terms of quality of service (QoS), Service Level Agreements (SLA), security, compatibility, interoperability, costs and performance estimation and so on. These issues have been analyzed and studied in the last few years but still a lot of investigation needs to be carefully addressed.
Before presenting the state of the art and discussing the main research challenges, in the next sections we explain what Cloud Computing is, highlighting its key concepts and architectural principles.
2.1.1 Cloud Computing Definition
The origin of the term "Cloud Computing" is obscure as it has never been defined in a unique way and precise circumstance. It appears to derive from the practice of drawing stylized Clouds to denote networks in diagrams of computing and communications systems since the half of the XX century.
The word "Cloud" is used as a metaphor for the Internet, based on the standardized use of a Cloud-like shape to denote a network on telephony schematics and later to depict the Internet in computer network diagrams as an abstraction of the underlying infrastructure it represents.
13 The main idea behind Cloud Computing is not a new one, unlike other technical terms; it is not a new technology, but rather a new operations model that brings together a set of existing technologies to run business in a different way. Indeed, most of the elements used by Cloud Computing, such as virtualization and utility-based pricing, are not new. Instead, Cloud Computing leverages these existing technologies to meet the technological and economic requirements of today's demand for information technology.
If we consider that with the first available large-scale mainframe in academia and corporations, accessible via thin clients / terminal computers, it became important to find ways to get the greatest return on the investment in them, allowing multiple users to share both the physical access to the computer from multiple terminals as well as to share the CPU time, and eliminating periods of inactivity (time-sharing), we can affirm that the underlying concept of Cloud Computing dates back to the 1950s.
In 1961, John McCarthy was the first to suggest publicly that computer time-sharing technology might result in a future in which computing power and even specific applications could be provided and sold through the public utility business model (like water or electricity). This idea was very popular during the late 1960s, but faded by the mid-1970s, since hardware and telecommunications were not sophisticated and prepared enough for this progressive scheme.
The term "Cloud" has also been used in various contexts such as describing large ATM (Asynchronous Transfer Mode) networks in the 1990s. Telecommunications companies began to offer VPN (Virtual Private Network) services instead of dedicated point-to-point data circuits, with comparable quality of service but at a much lower cost. The Cloud symbol was used to represent the demarcation line between provider's and user's responsibility. This boundary was soon extended to cover servers as well as the network infrastructure.
However, since 2000, the idea has resurfaced in new forms. It was after Google's CEO Eric Schmidt used the word to describe the business model of providing services across the Internet in 2006, that the expression really started to gain popularity. Since then, the term Cloud Computing has been used mainly as a marketing term in a variety of contexts to represent many different ideas. The ubiquitous availability of high-capacity networks, low-cost computers and storage devices as well as the widespread adoption of hardware virtualization, service-oriented architecture, autonomic, and utility computing
14 had led to a tremendous growth in Cloud Computing in various fields of application. This is the reason why Cloud Computing term does not have a standard definition. The lack of general and uniform concept generated not only market hypes, but also a fair amount of skepticism and confusion. For this reason, recently there has been work on standardizing the definition of Cloud Computing. As an example, in [87] the author compared over 20 different definitions from a variety of sources to confirm the following standard definition:
Clouds are a large pool of easily usable and accessible virtualized resources (such as hardware, development platforms and/or services). These resources can be dynamically reconfigured to adjust to a variable load (scale), allowing also for an optimum resource utilization. This pool of resources is typically exploited by a pay-per-use model in which guarantees are offered by the Infrastructure Provider by means of customized SLAs.
2.1.2 Characteristics
The above definition highlights the basic properties of Cloud Computing:
• Ubiquity: The user can totally ignore the location of the hardware infrastructure hosting the required service and make use of the service everywhere and every time he needs through his client application.
• Convenience: The consumer can use a service exploiting remote physical resources, without necessarily buying/acquiring them. As he is just charged for the resources provided according to a pay-per-use mechanism, utility-based pricing lowers service operating cost.
• On-demand activation: A service consumes resources only when it is explicitly activated by the user, otherwise it is considered inactive and the resources needed for its execution can be used for other purposes.
Moreover, the NIST definition also specifies five essential characteristics of Cloud Computing, as stated in [38]:
• On-demand self-service: Resources can be allocated or "allocated on demand", without requiring human interaction with the service's providers. The automated
15 self-organized resource management feature yields high agility that enables service providers to respond quickly to rapid changes.
• Broad network access: Capabilities are available over the Internet and are accessed through mechanisms that promote use by simple (thin) or complex (thick) client platforms (e.g., any device with Internet connectivity such as mobile phones, laptops, and smart devices). Moreover, to achieve high network performance and localization, many of today's Clouds consist of data center distributed in many locations around the globe. A service provider can easily leverage geo-diversity to achieve maximum service utility.
• Resource pooling: Different physical and virtual resources are dynamically assigned and reassigned according to consumer demand and needs; they are pooled by providers to serve multiple resource users and using a multi-tenant model. The customer's control is independent from the exact location of the provided resources but may know a location at a higher level of abstraction (e.g., country, state, or data-center). Such dynamic resource assignment capability provides much flexibility to infrastructure providers for managing their own resource usage and operating costs. Examples of resources include storage, CPUs, memory, network bandwidth, and virtual machines.
• Rapid elasticity: Resources can be rapidly and elastically provisioned, in some cases automatically, to quickly scale out and rapidly released to quickly scale in; the consumer often perceives unlimited availability of resources that can be purchased in any quantity at any time. Compared to the traditional model that provisions resources according to peak demand, dynamic resource provisioning allows service providers to acquire resources based on the current demand, which can considerably lower the operating cost.
• Measured service: Resources usage is always automatically controlled and optimized by leveraging a metering capability at a level of abstraction appropriate to the type of service (e.g., storage, bandwidth, CPU activity time for processing services and so on). This monitoring mechanism provides transparency for both the provider and consumer of the agility that enables service providers to respond quickly to rapid changes in service demand such as the flash crowd effect.
16
2.1.3 Structure models
This section aims to give a global description of the architectural, business and various operation models of Cloud Computing.
A layered architecture
In a Cloud environment, services owned by multiple providers are collocated in a single data center. The performance and management issues of these services are shared among service providers and the infrastructure provider. The layered architecture of Cloud Computing provides a natural division of responsibilities: the owner of each layer only needs to focus on the specific objectives associated with that layer. However, multi-tenancy also introduces difficulties in understanding and managing the interactions among various stakeholders.
Figura 2-1
Figure 1: Cloud Computing architecture [103]
Generally speaking, we can identify four layers that compose the architecture of a Cloud Computing environment: The hardware/data center layer, the infrastructure layer, the platform layer and the application layer, as shown in Figure 2.1 This classification allows to understand what each of the layers is composed of, what the intended function of that layer is, and how these layers interact with each other. By simplifying the Cloud Computing concept into layers, it is easier to define the roles within the overall structure
17 and explain where the business fits into the model. A detailed description of each layer follows:
1. The hardware layer: This layer is responsible for managing the physical resources of the Cloud, including physical servers, routers, switches, power suppliers, and cooling systems. In practice, the hardware layer is typically implemented in data centers. A data center usually contains thousands of servers that are organized in racks and interconnected through switches, routers or other fabrics. Typical issues at hardware layer include hardware configuration, fault-tolerance, traffic management, power and cooling resource management. Note that the physical hardware is being sliced into virtual machines (VMs), each having their own small (usually Linux or UNIX based) operating system installed.
2. The infrastructure layer: Also known as the virtualization layer, the infrastructure layer creates pools of storage and computing resources by partitioning the physical resources using virtualization technologies such as Xen [22], KVM [11] and VMware [21]. These pools of resources are the key to providing elasticity, scalability and flexibility with respect to server architecture. Indeed, virtual machines can be brought online and assigned to a resource pool on-the-fly when the demand on that pool increases, while they can then be destroyed when no longer needed. The ability to provision and delete virtual machines on the y allows a vendor to provide Infrastructure as a Service (IaaS). As a consequence, instead of purchasing servers or even hosted services, IaaS customers can create and remove virtual machines and network them together at will. Thanks to virtualization technologies, the infrastructure layer offers VMs as a service to end users that have complete control of their environments.
3. The platform layer: Built on top of the infrastructure layer, the platform layer consists of operating systems and application frameworks, and abstracts the IaaS layer by removing the individual management of virtual machine instances. The purpose of this layer is to minimize the burden of deploying applications directly into VM containers. In fact, at this layer customers do not manage their virtual machines; they merely create their own programs and applications, which are hosted by the platform services they are paying for, within an existing API or programming language. This frees the developers from concerns about environment configuration and infrastructure scaling, but offers limited control. 4. The application layer: At the highest level of the hierarchy, the application layer
18 (SaaS), such as email or CRM (Customer Relationship Management). In this layer, users are truly restricted to only what the application is and can do; they get only pre-defined functionality and they cannot go much further than that. Indeed, applications are designed for ease of use and GTD (getting things done). Billing can be based on utility or at monthly fee. Either way, it is a simple way to get the application functionality you need without incurring the cost of developing that application. Different from traditional applications, Cloud applications can leverage the automatic-scaling feature to achieve better performance, availability and lower operating cost. We note that the architecture of Cloud Computing is modular, much more than traditional service hosting environments. Each layer is loosely coupled with the layer above and below, allowing each layer to evolve separately. The architectural modularity allows Cloud Computing to support a wide range of application requirements while reducing management and maintenance overhead.
Cloud service models
Cloud Computing adopts a service-driven operating business model, indicating a strong emphasis on service management. In other words, hardware and platform-level resources are provided as services on an on-demand-basis, according to the SLAs negotiated with its customers. Conceptually, every layer of the architecture described in the previous section can be implemented as a service to the layer above. Conversely, every layer can be perceived as a customer of the layer below. However, in practice, Cloud Computing providers offer services that can be grouped into three fundamental categories: infrastructure as a service (IaaS), platform as a service (PaaS) and software as a service (SaaS), as in Figure 2.
19
• Infrastructure as a Service: IaaS refers to on-demand provisioning computers, storage and other infrastructural physical resources, usually in terms of VMs. The Cloud owner who offers IaaS is called a IaaS provider. The consumer is able to deploy and run arbitrary software, which can include operating systems and applications. In this model, the consumer does not manage or control the underlying Cloud infrastructure but he is responsible for patching and maintaining the operating systems, deployed application software, storage, and he possibly has limited control of select networking components (e.g., host _firewalls). Cloud providers typically bill IaaS services on a utility computing basis, that is, cost reflects the amount of resources allocated and consumed. Examples of IaaS providers include Amazon EC2 [1An], Windows Azure Virtual Machines [15An], Google Compute Engine [8An], GoGrid [5An], and Flexiscale [4An].
• Platform as a Service: PaaS refers to providing platform layer resources, typically including operating system support, database, web server and software development frameworks. These provided capabilities are consumer-created or acquired applications, created using programming languages and tools supported by the provider. The consumer has control over the deployed applications and possibly application hosting environment configurations but cannot manage the underlying Cloud infrastructure. Application developers can develop and run their software solutions on a Cloud platform without the cost and complexity of buying and managing the underlying hardware and software layers. With some PaaS offers, the underlying computer and storage resources scale automatically to match application demand such that Cloud user does not have to allocate resources manually. Examples of PaaS providers include Google App Engine [6An], Microsoft Windows Azure Compute [14An], and Force.com [19An].
• Software as a Service: SaaS refers to providing on-demand applications over the Internet. Cloud providers install and operate application software running on a Cloud infrastructure while Cloud users access this software from various client devices through a thin interface such as a web browser (e.g., web-based email). The consumer does not manage or control the underlying Cloud infrastructure and platform on which the application is running, with the possible exception of limited user specific application configuration settings. This eliminates the need to install and run the application on the Cloud user's own computers simplifying maintenance and support. The pricing model for SaaS applications is typically a monthly or yearly at fee per user, so price is scalable and adjustable if users are added or removed at any point. Examples of SaaS providers include Salesforce.com [19An], Rackspace [18An] and SAP Business ByDesign [20An], Google Apps [7An], Microsoft Office 365 [13An], and Onlive [17An].
20 We observe that PaaS and IaaS providers are often called the infrastructure providers of Cloud providers since, in the current practice, they are often part of the same organization (e.g. Google and Salesforce). However, according to the layered architecture of Cloud Computing, it is entirely possible that a PaaS provider runs its Cloud on top of an IaaS provider's Cloud.
IaaS instance options
In addition to providing the flexibility to easily choose the number, the size and the configuration of the compute instances the customers need for their applications, a IaaS provides customers different purchasing models that give them the flexibility to optimize their costs. For example Amazon EC2, IaaS market leader and reference model of this work, offers three kinds of instances: i) On-demand instances which allow the customer to pay a fixed hourly rate with no commitment; ii) reserved instances where the customer pay a low, one-time fee and in turn receive a significant discount on the hourly charge; iii)
on-spot instances which enable the customer to bid whatever price he wants for individual
instance, providing for even greater savings if his application have flexible start and end times. An accurate description of the three different EC2 instance options follows:
• On-demand instances: On-demand instances require no long-term commitments or upfront payments. Customers can increase or decrease compute capacity depending on the demands of their own applications and only pay the needed rate for the instances they use. A IaaS always strives to have enough on-demand capacity available to meet customers’ needs, but during periods of very high demand, it is possible that it might not be able to launch specific on-demand instance types in specific availability zones (i.e., a specific Amazon data center) for short periods of time. On-demand instances are recommended for users that want the low cost and flexibility without any up-front payment or long-term commitment, or applications with short term, spiky, or unpredictable workloads that cannot be interrupted.
• Reserved instances: Functionally, reserved and on-demand instances perform identically but those reserved let the customer make a low, one-time, upfront payment for an instance, reserve it for a one or three year term, and pay a significantly lower hourly rate for that instance. Customers are assured that their own reserved instance will always be available for the operating system (e.g. Linux/UNIX or Windows) and availability zone in which they purchased it. For applications that have steady state needs, reserved instances can provide high savings compared to using on-demand instances. Reserved instances are usually recommended for applications with predictable usage, applications that require
21
reserved capacity, including disaster recovery and users able to make upfront payments to reduce their total computing costs even further.
• On-spot instances: Spot instances provide the ability for customers to purchase compute capacity with no upfront commitment and at hourly rates usually lower than the on-demand rate. Spot instances allow you to specify the maximum hourly price that you are willing to pay to run a particular instance type. IaaS sets a spot price for each instance type in each availability zone, which is the price all customers will pay to run a spot instance for that given period. The spot price fluctuates based on supply and demand for instances, but customers will never pay more than the maximum price they have specified. If the spot price moves higher than a customer's maximum price, the customer's instance will be shut down by the IaaS. Other than those differences, spot instances perform exactly the same as on-demand or reserved instances. For the majority of cases, spot instances are recommended for applications that have flexible start and end times, applications that are only feasible at very low compute prices and users with urgent computing needs for large amounts of additional capacity. Due to the nature of on-spot instances, competitions for their acquisition raise between customers.
Cloud deployment models
There are many issues to consider when moving an enterprise application to the Cloud environment. For example, some service providers are mostly interested in lowering operation cost, while others may prefer high reliability and security. Accordingly, there are different types of Clouds, each with its own benefits and drawbacks:
• Public Clouds: A Cloud in which service providers offer resources as services available to the general public or a large industry group and owned by a private organization selling Cloud services (like Amazon AWS, Microsoft and Google); these services are free or offered on a pay-per-use model. Public Clouds offer several key benefits to service providers, including no initial capital investment on infrastructure and shifting of risk to infrastructure providers. However, they lack fine-grained control over data, network and security settings, which restricts their effectiveness in many business scenarios.
• Private Clouds: Also known as internal Clouds, private Clouds are designed for exclusive use by a single organization. A private Cloud may be hosted internally or externally and managed by the organization or by a third-party represented by external providers. A private Cloud offers the highest degree of control over performance, reliability and security. However, they are often criticized for being similar to traditional proprietary server farms and do not provide benefits such as no up-front capital costs. Moreover, undertaking a private Cloud project requires a significant level and degree of engagement
22
to virtualize the business environment: every one of the steps in the project raises security issues that must be addressed in order to avoid serious vulnerabilities.
• Community Clouds: The Cloud infrastructure is shared by several organizations and supports a specific community that has common concerns (e.g., mission, security requirements, policy, and compliance considerations). It may be managed by the organizations or by a third party and may exist on premise or o_ premise. The costs are spread over fewer users than a public Cloud (but more than a private Cloud), so only some of the cost savings potential of Cloud Computing are realized.
• Hybrid Clouds: A hybrid Cloud is an alternative solution to addressing the limitations of both public and private Clouds. It is a combination of two or more Cloud models (public, private or community), that remain unique entities but are bound together by standardized or proprietary technology that enables data and application portability (e.g., Cloud bursting for load-balancing between Clouds). In this way companies and individuals are able to obtain degrees of fault tolerance combined with locally immediate usability without dependency on internet connectivity. Hence, hybrid Cloud architecture is flexible and scalable. Compared to public Clouds, they provide tighter control and security over application data, while still facilitating on-demand service expansion and contraction. On the down side, designing a hybrid Cloud requires carefully determining the best split between public and private Cloud components. For most service providers, selecting the right Cloud model depends on the business scenario. For example, computing-intensive scientific applications are best deployed on public Clouds for cost-effectiveness. Arguably, certain types of Clouds will be more popular than others. In particular, it was predicted that hybrid Clouds will be the dominating deployment model for most organizations.
It is fundamental to note that Cloud Computing is still an evolving paradigm. Its definitions, structure, use cases, underlying technologies, issues, risks, and benefits will be refined in a spirited debate by the public and private sectors. The definitions, attributes, and characteristics given in the previous discussion will evolve and change over time. Finally we remark that the Cloud Computing industry represents a large ecosystem of many models, vendors, and market niches. Our description attempts to encompass all of the various Cloud approaches.
23
2.2 C
LOUD
M
ONITORING
In the context of Cloud management, monitoring Cloud infrastructures and applications is a critical task. It allows us to i) get insights into the system and the health of the running applications, ii) to gather information and scalability and, as a result, coming up with adaptation decisions based on monitoring data. In general, monitoring approaches differ from various points of view, in particular:
• The monitoring actor (who) can be the application/service provider, cloud provider, or third party. Who performs monitoring has an impact on the aspects possible to monitor. For instance, an application/service provider has usually a full control over the execution of its application components/services and can easily probe their internals. In contrast, it could not easily access to infrastructure level information that the cloud provider may hide.
• What objects and properties are monitored. The monitored objects can be an application, cloud resources or some specific services such as queues. As for the monitored properties different approaches can be distinguished one from the other for the following two aspects:
o Types of monitored properties. Monitored properties can be functional (proper functionality) or non-functional (quality aspects) such as execution cost, response time, and throughput.
o Punctual versus History-based monitoring. The monitoring is punctual if it concentrates on values collected at particular instants of the execution. The term history-based monitoring refers to the case when the analysis considers the history of the system in a certain time window in order to discover the presence (absence) of sequences of values or events.
• When monitoring happens. This concerns the timing of the monitoring process with respect to the execution of the monitored system.
• How the monitoring system is built. This refers to the monitoring mechanism, the expressiveness of the language and abstraction level, the capability of diagnosing and deviation handling and the runtime support.
24 • The language expressiveness. The type of monitored properties and the capability of predicating on single values and histories lead to the expressiveness of the monitoring language. After deciding what we want to monitor, we need a way to render monitoring directives. Usually services are monitored through special purpose constraints that must be checked during execution such as compliance with promised SLAs. History-based constraints require a temporal logic to relate the values belonging to a sequence, while monitoring the QoS properties imposes a language allowing for suitable representation.
• Abstraction level. Monitoring properties can be expressed at various abstraction levels. There is a distinction between the level at which monitoring works and the level at which the user is required to define such properties. This distinction helps characterize what the user specifies with respect to what the execution environment must cope with. Abstraction level refers to the first aspect and does not consider what the runtime support executes. This aspect is taken into account when considering the degree of automation intrinsic within each approach.
• Architecture of the monitoring environment. Monitoring constraints must be specified and then evaluated while the system executes. The support could be in the form of modeling environment, meaning what the approach offers to the user to specify the monitoring constraints (e.g., Palladio component modeling) and execution environment meaning what the approach offers/requires to check directives at runtime. Usually, specification environments propose proprietary solutions, while execution environments can be based on standard technology, proprietary solutions, or suitable customizations of existing engines. The execution environment may also include the mechanisms deployed for generating the monitoring information such as instrumentation, reflection, and the interception of events/information exchanged in the execution environment.
• Filtering. Pure monitoring is in charge of detecting possible discrepancies between what stated by monitoring constraints and what is actually collected from the execution. Filtering and reasoning abilities enable analysis of complex properties by combining raw data collected by the monitoring infrastructure.
• Monitoring output. The monitoring environment can offer its output through specific and proprietary GUI or it can offer APIs enabling the retrieval of monitoring data. In general, the richness of information offered as an outcome of the monitoring activity is of paramount importance.
25 • Derivation of monitoring constraints. Monitoring directives can be either programmed explicitly or be derived (semi) automatically from other artifacts, e.g., design specification containing QoS information.
• Reactive/proactive monitoring. Reactive monitoring takes actions to solve
problems in response to one or more incidents, after a problem has occurred. It is designed to analyze the direct and root causes of the problems and then take corrective actions to fix them. Optionally, it could collect data for comparison with past and future events and allow related risk assessment. For example, reactive monitoring comprises reduction, correlation, sequencing, notification and reporting of event, automated actions and responses, and the implementation of special-purpose policies to constrain problems. Proactive monitoring implies the definition of monitoring actions trying to identify and solve problems before occurrences such as the verification of SLAs, capacity planning and treatment of statistics to measure of the system behaves.
2.2.1 General Monitoring Approaches
In this section some approaches generally applicable to web service monitoring are presented, together with some cloud-specific ones that are dealing with all layers of the Cloud.
COMPAS [Mos02]. The COMponent Performance Assurance Solutions (COMPAS) is a performance monitoring approach for J2EE systems in which components are EJBs. The framework is divided into three parts: monitoring, modelling, and prediction. Java Management Extensions (JMX) is used in the monitoring part. An EJB application is augmented with one proxy for each component EJB. Such proxies mirror in the monitoring system each component in the original application. Timestamps for EJB life-cycle events are sent through these proxies to a central dispatcher. During runtime, a feedback loop connecting the monitoring and modelling modules, allows the monitoring to be refined by the modelling process in order to increase the efficiency of monitoring/modelling.
TestEJB [Mey04]. This approach deals with QoS specification of components by introducing a novel measurement architecture. It is is the performance monitoring of J2EE
26 systems implementing an application-independent profiling technique. The framework focuses on response time by monitoring execution times of EJBs and also traces of users calls. The approach relies on the Java Virtual Machine Profiler Interface (JVMPI) and records events for constructing and deconstructing EJBs. This method allows tracing back memory consumption to individual components and introduces a significant overhead in the range of seconds and should only be used in a testing environment.
PAD [Par08]. Monitoring is not limited to just obtaining some raw data, rather it concerns also analyzing the data in order to detect functionality and performance issues that then trigger ameliorative adaptation decisions. The objective of Performance Anti-pattern Detection (PAD), which is based on the COMPAS framework, is the automatic detection of performance anti-patterns in EJB component-based systems. The framework includes three modules as performance monitoring, reconstruction of a design model and anti-pattern detection. PAD is portable across different midleware implementations as a result of using standard J2EE mechanisms. For each EJB module proxies are used regarding collect timestamps and call sequences. Based on rules implemented with the JESS rule engine, anti pattern detection on the reconstructed design model could be achieved. PAD collcts data at the correct level of abstraction and provide sufficient runtime context for the collected data.
An elastic Multi-layer monitoring approach [Kon12]. A peer-to peer scalable distributed system for monitoring is proposed in [Kon12], enabling deployment of long-living monitoring queries (query framework) across the cloud stack to collect metrics and trigger policies to automate management (policy framework). The monitoring architecture of the approach is composed of three layers as data, processing and distribution, interfacing on different levels with the cloud stack.
The data layer provides extensible adaptors to cope with resource heterogeneity. The processing layer describes complex queries (in a SQL-like syntax) over data and also defines policy rules to be triggered if needed. The distribution layer performs an automated deployment of processing operators in the correct places relying on services such as SmartFrog [Gol09], SLIM [Kir10] or Puppet [Tur07].
RMCM [Sha10]. Runtime Model Based Monitoring Approach for Cloud (RMCM) [Sha10] represents a running cloud through an intuitive model.The objective is to provide an opearable profile of a running cloud and to apply it for implementing a flexible
27 monitoring framework. RMCM is presented from the point of view of three roles in the cloud: cloud operators, service developers, and end users. The entities of this model are:
Interaction behavior, Application, Middleware and Infrustructure. The main focus of
infrastructure monitoring is on the resource utilization. Applications are monitored from the design and performance point of views. The monitoring is based on server-agent architecture. A monitoring agent is deployed on each virtual machine in charge of collecting runtime information of all the entities on the same VM. These entities are equipped with various monitoring mechanisms to collect runtime information from entities of each level. Collected information is used to instantiate corresponding RMCM to be checked based on some pre-defined rules. Administrators can view and query this monitoring information from the DB. They also can modify the monitoring configuration for each agent.
mlCCL [Bar12]. The Multi-layer Collection and Constraint Language (mlCCL) [Bar12] is an event-based multi-level service monitoring approach which defines runtime data to be collected and how to collect, aggregate and analyze it in a multi-layered system such as Cloud. mlCCL Data is described as Service Data Object (SDOs) that may have two kinds of data collections: messages and indicators. Messages are used to obtain the request or response messages exchanged during service invocations. In the case of a new service invocation for which a message collection is defined, the mlCCL tool produces a new SDO and outputs it to an event bus so that the designer can make further use of it. In addition to collected messages and the location of them, an SDO contains a timestamp indicating when the message was sent or received by the service runtime (NTP - Network Time Protocol) timestamps are used for the purpose of clock synchronization when sampling sources on different computers with a precision in the order of 10 ms and an instanceID, that is a unique ID identifying the specific service call. Indicators are not triggered by any particular service call. They collect periodic information about a service. An indicator can be a Key Performance Indicator (KPI) such as average response time or throughput, or a Resource Indicator (RI) such as the amount of available memory or idle CPU in a virtual machine. Upon calculating a new indicator value by mlCCL runtime, it is wrapped in an SDO and output to an event bus for further use.
28
2.2.2 Infrastructure-Level Monitoring
Infrastructure-level monitoring involves collecting metrics related to CPU, memory, disk and network from a IaaS platform, either via monitoring probes deployed inside VMs or using services provided by the cloud platform itself (e.g., Amazon Cloudwatch). In this section we review current standard monitoring tools and cloud-specific tools that may be appropriate for this purpose.
Ganglia []. Ganglia is a scalable distributed monitoring system for high-performance computing system such as clusters and Grids. Ganglia is able to run on Linux and Windows.
Nagios []. Nagios offers the ability to monitor applications, services, operating systems, network protocols, system metrics and infrastructure components with a single tool. Nagios is able to respond to issues at the first sign of a problem and automatically fix problems when they are detected. Nagios is able to run on Linux and Windows.
MonALISA []. It is an assembler of autonomous multi-threaded, self-describing agent-based subsystems which are registered as dynamic services. It has the ability to collect local host information, and it’s mainly Linux based.
JASMINA []. It is a set of monitoring tools that allows supervising a distributed infrastructure. It has the ability of running on any platform.
Zabbix []. It is an open source monitoring software for enterprise environment. It is available for Linux, Unix and Windows.
2.2.2.1.1 Cloud-specific monitoring
Amazon CloudWatch [2]. CloudWatch enables monitoring for Amazon cloud resources and services. CloudWatch provides monitoring metrics about CPU, disk, network, system status check and custom metrics such as memory and error rates. CloudWatch supports alarm for notification of predefined metric value. Graphs and statistics are provided for selected monitoring metrics. CloudWatch is neither open source nor free.
Azure Monitoring [3]. The key performance metrics for azure cloud services can be monitored in the Windows Azure Management Portal. It is possible to set the level of monitoring to minimal and verbose for each service role, and to customize the monitoring displays. Verbose monitoring data is stored in a storage account, which can be accessed outside the portal. Monitoring displays in the Management Portal are highly configurable. The user can choose the metrics that wanted to be monitored in the metrics list on
29 the Monitor page and the dashboard. The minimal metrics are limited to CPU Percentage, Data In, Data Out, Disk Read Throughput, and Disk Write Throughput.
Cloudify []. Cloudify is an open source PaaS for business-critical applications enabling on-boarding and scaling to any cloud. Cloudify supports monitoring system using a web management console or using the Cloudify shell. Cloudify in default can monitoring CPU and memory. It also supports monitoring probes and plugins to conduct monitoring, such as JMX. Alerts can be set inside the web management console.
Rackspace Cloud Monitoring []. Rackspace Cloud Monitoring is a service provided by Rackspace to monitor applications on cloud (not limited to Rackspace cloud). Rackspace Cloud Monitoring supports various monitoring metrics, including CPU, disk, memory, network, processes and custom metrics.
CopperEgg Reveal []. CopperEgg is a cloud computing systems management company and its products provide monitoring for websites, web applications, servers, and systems deployed in cloud. RevealCloud is a tool for server monitoring; RevealUpTime is a tool for website and web application monitoring; includes also custom monitoring metrics. CopperEgg products support almost all the major public cloud providers and platform. CopperEgg products are not free.
New Relic []. New Relic is an application performance management company. Its products provide user, application and server monitoring functionalities. Real user monitoring is able to provide real time performance metrics such as page load time, page views, Apdex score, identify poor performance pattern and alert and notification. Application monitoring is able to provide several metrics such as throughput, response time and Apdex score and transaction tracking and reporting. It also supports alerts and capacity analysis. Server monitoring provides performance metrics such as CPU, memory, network and IO. New Relic products are not free.
AppDynamics. AppDynamics is an application performance management company. Its products focus on providing performance management in cloud. AppDynamics provide real time monitoring and end user monitoring. AppDynamics is able to achieve troubleshooting by identifying bottlenecks, detecting transaction anomalies and code diagnostics. AppDynamics provides detailed report and visualised dashboard for statistics and comparison with each release. AppDynamics products are not free.
30 Beside the features of cloud-specific monitoring applications, there is no possibility of monitoring internal components, like the response time of the website pages that are hosted by a cloud provider.
2.2.3 Application-Level Monitoring
This section is devoted to application level Cloud monitoring, which is of significant importance, especially in the context of Cloud application SLA management. Due to virtualization as the basis for resource sharing, multiple virtual machines (VMs) can be run on a single physical machine or even multiple applications can be run on a single VM. As a result, per-application monitoring in such a shared environment is essential to keep applications healthy and guarantee QoS. Therefore, it is not enough just to monitor a physical machine or a VM to measure the application resource consumption, detecting SLA violations and managing resources efficiently.
RTCE [Hol10]. Run-time Correlation Engine (RTCE) provides a scalable log correlation, analysis, and symptom matching architecture that can perform real time correlation for large volumes of log data. Analysing the huge mass of data which is produced by software component, especially in heterogenous environment is a challeging issue. RTCE framework encompasses four functionalities: automatic data collection, data normalization into a common format, runtime correlation and analysis of the data to give a coherent view of system behaviour at run-time and a symptom matching mechanism identifying errors in the correlated data [Hol09].
Data from each application is read by Monitoring Agent (MA) and are routed in the form of events to the Evenvt Correlation Engine (ECE) via TCP/IP connection. After the data being procesed by ECE, they are presented on the web server, and users get them from different view. One of the limitation of RTCE is scalability in cloud computing environments.
A multi-layer approach for cloud application monitoring [Gon11]. A three-dimentional approach for cloud application monitoring is proposed in [Gon11], encompassing Local Application Survelliance (LAS), the Intra Platform Survelliance (IPS) and the Global Application Survelliance (GAS) dimensions. LAS monitors the
31 application instance to check for rules violation; Its output is sent to the assigned IPS. The filtered results are then sent to the GAS components for more analysis.
Cloud Application Monitoring [Rak11]. The building of custom monitoring systems for Cloud applications is facilitated using the mOSAIC API. The mOSAIC approach as a whole contains four modules as the API, the framework (i.e., platform), the provisioning system, and the semantic engine. The API and the framework aim at the development of portable and provider independent applications. The provisioning system works at IaaS level and resource management. The functionality of the provisioning system is a part of the Cloud agency [Ven11]. The framework is a collection of predefined Cloud components in order to build complex applications. The framework constitutes a PaaS enabling the execution of complex services with predefined interfaces. The mOSAIC SLA management components are also part of the framework. The API offers the implementation of a programming model in a given language (currently Java, and Python in the future) to build applications. The API provides new concepts (e.g., the Cloudlet or the Connector) in order to focus on Cloud resources and communications instead of the resource access or communication details.
The mOSAIC monitoring API offers a set of connectors representing an abstraction of resource monitoring and a set of drivers implementing different ways of acquiring monitoring data (from different techniques); therefore, it supports monitoring by (i) offering a way to collect data directly from any of the components of a mOSAIC application, (ii) offering a way to collect data for any proposed monitoring techniques (accessing Cloudprovider, resourcerelated, and mosaic monitoring tools (called M/W -monitoring/warning - system), and (iii) supporting the mOSAIC Cloud application in order to access data regardless to the technology of the acquired resources and the way they are monitored. The aim of the set of mOSAIC monitoring tools, offered by the mOSAIC framework, is offering the ability to building up a dedicated monitoring system.
M4Cloud [Mas11]. It is a model-driven approach that classifies and monitors application-level metrics in shared environments such as the Cloud. The basis for the implementation of the monitoring phase is the Cloud Metric Classification (CMC). CMC identifies the following four models: application based (e.g., generic/specific), measurement based (e.g., direct/calculable), implementation based (e.g., shared/individual) and nature based (e.g., quantity/quality) models. The application based model supports the distinction of the metrics on the basis of the application they belong to.
32 The measurement based model is applied to define the formulas from which metrics can be calculated; the Implementation Based Model defines for each metric the corresponding measurement mechanisms, coherently with the formulas defined at the previous step; finally, the nature based model defines the nature of the metrics and their definition within SLAs. More info on the models could be found in the original article in [Mas11].
CMC is part of the M4Cloud framework. In this framework, the FoSII infrastructure [Bra10] is used as a Cloud Management System (CMS). Monitored data is analyzed and stored within a knowledge database and then is used for planning actions. Moreover, monitored data is also acquired and analyzed after the execution of such actions, for the purpose of efficiency evaluation.
Cloud4SOA [*].The Cloud4SOA monitoring offers a unified platform-independent mechanism, to monitor the health and performance of business-critical applications hosted on multiple Clouds environments in order to ensure that their performance consistently meets expectations defined by the SLA. In order to consider the heterogeneity of different PaaS offering Cloud4SOA provides a monitoring functionality based on unified platform independent metrics. The Cloud4SOA monitoring functionality allows to leverage on a range of standardized and unified metrics of different nature (resource / Infrastructure level, container level, application level, etc.) that, based on the disparate underlying cloud providers, allow the runtime monitoring of distributed applications so as to enforce the end-to-end QoS, regardless of where they are deployed across different PaaS. In the scope of Cloud4SOA several metrics have been defined from the cloud resource as well as the business application perspective, but not all of them have been enforced at runtime since they only provide useful information about the status of the application.
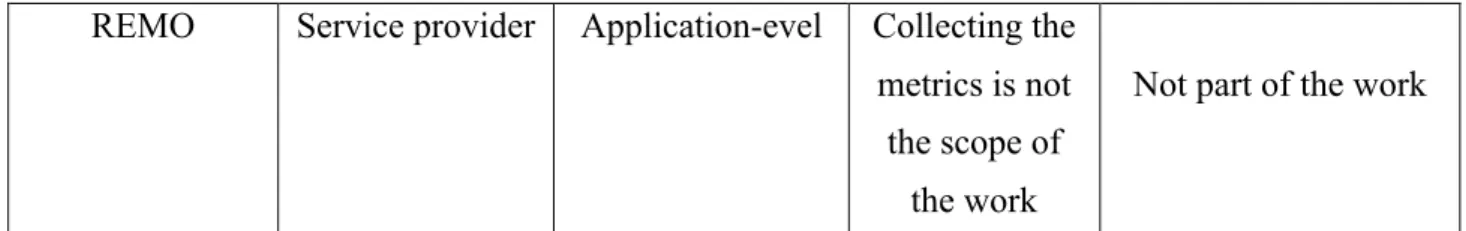
REMO [Men08]. Cost effectiveness and scalability are among the main criteria in developing monitoring infrastructure for large-scale distributed applications. REMO addresses the challenge of constructing monitoring overlays from the cost and scalability point of views jointly considering inter-task cost-sharing opportunities and node-level resource constraints. Processing overhead is modeled in this approach in a per message basis. A forest of optimized monitoring trees is deployed in the approach through iterations of two phases exploring cost sharing opportunities between tasks and refining the tree with resource sensitive construction schemes. In every iteration, a partition augmentation procedure is run generating a list of most promising augmentations for