Dipartimento di Scienze Pure e Applicate
Scuola di Scienze e Tecnologie dell’Informazione
Ph.D. Thesis
M
OBILE
C
ROWD
S
ENSING
: E
NABLING
T
ECHNOLOGIES
AND
A
PPLICATIONS
Tutor:
Chiar.mo. Prof. Alessandro Bogliolo
Dott. Saverio Delpriori
Candidate:
Dottorato in Scienze di Base e Applicazioni
curriculum
Scienze della Complessità
Ciclo XXX — A.A. 2016/2017
Settore Scientifico Disciplinare INF/01
Contents
List of Figures 7
1 Introduction 9
1.1 Harnessing the Wisdom of Crowds . . . 11
1.2 MCS applications . . . 13
1.2.1 MCS classification . . . 15
1.2.2 MCS architecture . . . 16
1.3 Challenges and open issues . . . 20
1.3.1 Data quality . . . 21
1.3.2 Scalability . . . 21
1.3.3 User interface . . . 22
1.3.4 Privacy . . . 22
1.3.5 Cooperation incentives . . . 23
1.4 Structure of this work . . . 24
2 Data Quality 25 2.1 Bootstrap for Data Quality Estimation . . . 26
2.1.1 Reference System Architecture . . . 28
2.1.2 Bootstrap Based Uncertainty Propagation . . . 31
2.1.3 Experimental Results . . . 34
2.1.4 Synthetic benchmarks . . . 34
2.1.4.A Case study: SmartRoadSense . . . 39
2.2 Accuracy Improvement in MCS Vehicular Applications . . . 42
2.2.1 Related Works . . . 44
2.2.1.A Vehicular crowdsensing systems . . . 44
2.2.1.B Map matching . . . 45
2.2.2 Problem Statement and Scope . . . 46
2.2.2.A Map Matching Issues . . . 47
2.2.3 Proposed approach . . . 49
2.2.4 Implementation and experimental results . . . 51
2.2.4.A Implementation and experimental setup . . . 51
2.2.4.B Results . . . 51
2.3 Final remarks . . . 54
3 Privacy Preserving Incentives 59 3.1 A gamified approach to motivation incentives . . . 61
3.1.1 Smart sensing of road quality . . . 62
3.1.2 Engagement strategy using gamification . . . 65
3.1.2.A Harnessing the potential for narratives and role. . . 66
3.1.2.B Pervasive Quest/Story Unlocks: Road Distance. . . 67
3.1.2.C Player Choice (Quest Stories & Outcomes) . . . . 70
3.1.2.D Core Reward System . . . 70
3.2 A flexible rewarding platform . . . 72
3.2.1 Proposed system . . . 73
3.2.1.A Definitions . . . 74
3.2.1.B Protocol description . . . 74
3.2.1.C Voucher format . . . 76
3.2.1.D Voucher filtering . . . 77
3.2.1.E One-time codes and URLs . . . 78
3.2.1.F Platform growth . . . 80
3.3 Final remarks . . . 81
4 User Interface 83 4.1 The rise of bots . . . 86
4.1.1 History of conversational interfaces . . . 87
4.1.1.A Chatterbots . . . 87
4.1.1.B Personification . . . 88
4.1.1.C Instant messaging . . . 89
4.1.1.D Virtual Private Assistants . . . 89
4.1.1.E The rise of a new bot-based paradigm . . . 90
4.1.1.F Beyond “Chatbots” . . . 91
4.1.2 Botplications . . . 92
4.1.2.A Thread as app . . . 92
4.1.2.B History awareness . . . 93
4.1.3 Enhanced UI . . . 93
4.1.3.A Limited use of Natural Language Processing (NLP) 95 4.1.3.B Message self-consistency . . . 97
4.1.3.C Guided conversation . . . 97
4.1.4 Technological survey . . . 97
4.1.4.A Interface features . . . 98
4.1.4.B Advantages of Bots for users . . . 100
4.1.4.C Advantages of Bots for developers . . . 103
4.1.5 Discussion . . . 104
4.2 A MCS Botplication case study . . . 106
4.2.1 Platform’s Aims . . . 107
4.2.2 A message-based sensing style . . . 107
4.3 Final remarks . . . 110
5 Conclusions 115
Acknowledgments 119
List of Figures
1.1 Software architecture of MCS applications . . . 17
1.2 Proposed reference process structure for MCS applications . . . 18
2.1 SmartRoadSense architecture . . . 29
2.2 Toolflow of the bootstrap-based approach . . . 32
2.3 Synthetic benchmarks . . . 36
2.4 Sensitivity analysis . . . 38
2.5 Dynamic input analysis with normal distribution . . . 40
2.6 Dynamic input analysis with uniform distribution . . . 40
2.7 Dynamic input analysis with Rayleigh distribution . . . 41
2.8 Case Study (SmartRoadSense) . . . 41
2.9 Sensitivity analysis on SmartRoadSense dataset . . . 43
2.10 Main artifacts . . . 48
2.11 False positive case . . . 50
2.12 Projected trace points, Case-1 . . . 52
2.13 Projected trace points, Case-2 . . . 53
2.14 Projected trace points, Case-3 . . . 54
2.15 Projected trace points, Case-4 . . . 55
2.16 Projected trace points, Case-4b . . . 56
3.1 SmartRoadSense usage pattern . . . 63
3.2 Statistics view in SmartRoadSense Android mobile app . . . 64
3.3 Examples of in-game screens . . . 69
3.4 Board Game examples of Player Choice/Narrative Mechanics . . . 71
3.5 Voucher creation protocol and transfer to the volunteer’s pocket. . . . 75
3.6 Payment protocol. . . 77
3.7 Offline payment protocol. . . 79
4.1 Lack of usable UIs . . . 85
4.2 Bot’s button features . . . 99
4.3 Structured commands available during the whole conversation . . . . 100
4.4 Structured message templates in Messenger . . . 102
4.5 Da-qui-a-lì first interaction . . . . 108
4.6 Da-qui-a-lì starting a new journey . . . . 109
4.7 Da-qui-a-lì stopping the recording phase . . . . 109
4.8 Da-qui-a-lì evaluating last journey . . . . 110
Introduction
Today we repeatedly join and leave dynamic and complex systems such as online com-munities, transportation networks, and cities. Most of the time we are not aware of be-having as linked nodes in massive networks, like traffic flows or economic systems. But fast-evolving systems like these need to be continuously monitored in order to extract information essential to decision making, proactive surveillance, and policy making.
The process of handling complex systems starts with the non-trivial task of collect-ing data about, analyzcollect-ing, and understandcollect-ing complex contexts. Until about a decade ago, the most suitable methods for examining these contexts took advantage of tools like Wireless Sensor Networks (WSNs) and emerging phenomena such as the Internet of Things (IoT). Although being innovative and on the cutting edge from a technological point of view, they were not flexible enough to provide building blocks of applications able to deal with contexts highly dynamic in both space and time dimensions. Moreover, even if such technologies would have been of great help in mining knowledge from com-plex networks, some shortcomings (e.g., high installation and maintenance cost, lack of scalability, steep learning curve, and limited node coverage) have hindered their full com-mercial exploitation and their pervasive diffusion in many real world applications.
With the recent widespread availability of smartphones, this scenario has radically changed. Having a full fledged computer with high connectivity and computing power but small enough to be carried around with no efforts by users, has enabled a new fast-growing sensing paradigm. Not only smartphones, but also smart vehicles and wearable devices — along side with further developments in cloud computing — offered an inter-esting opportunity for developing distributed applications able to quickly and precisely investigate even dynamic and quite complex phenomena.
Nowadays, standard smart device, and smartphones, in particular, sport a consider-able number of embedded sensors. The capability to adequately sense the environment is paramount in collecting well-grounded data and has a pivotal role in any application
which aims to understand a real-world event. Nonetheless, from the crowdsensing per-spective, the main contribution of the smartphones diffusion doesn’t lie in the intro-duction of new and more precise types of sensors. In general terms, having two sensing networks, one composed of motes1and the other one made of smartphones, we can eas-ily identify some advantages of the second approach. Smart devices have much greater computing power which can be leveraged to filter or pre-process data collected before sending them to the application server. Connectivity has always been a major issue es-pecially for ad hoc networks of motes with limited communication range, while even entry-level smartphones can use many different technologies to communicate. Having many connectivity interfaces such as Bluetooth, Wi-Fi, NFC, and broadband mobile net-work capabilities makes them capable not only to easily communicate with peers or with a central server but also enables them to act as a bridge between other connected devices with limited connection capabilities.
One of the main issues of traditional approaches was the inability to follow the dy-namic changes (in terms of context and geographical position) due to limited ability to move toward or to follow the phenomenon. Most sensing applications aim to acquire knowledge about an event where the user is involved in some way or about the envi-ronment where the user spends some time. Smartphones are inherently portable and designed to act as truly personal devices, so users are accustomed to bring them wherever they go. As a result, there is no need to move the sensing device to the context we want to analyze since, most of the time, the device is already in the range of the event itself.
Having all these peculiar characteristics, smart devices constitute an amazing tool which can be leveraged to collect and analyze local data and, in general, to grasp a more clear understanding of the complex contexts we live in. This is one of the very reasons why a new fast-growing sensing paradigm has started gaining widespread adoption, lever-aging the extensive presence of mobile personal devices in our lives and social participa-tion of volunteer citizens. This new paradigm, called Mobile Crowd Sensing (MCS), has been widely adopted in distributed problem-solving applications, involving online or offline crowds.
To be concise, MCS is about relying on the crowd to perform sensing tasks through their sensors-enabled devices. Mobile Crowd Sensing (also referenced as Mobile Crowd Sensing and Computing [73]) was firstly introduced by Ganti et al. in 2011 and since then it has been the subject of a great deal of research [60, 72, 23, 95, 21]. Only in 2014, Guo et al. gave the first widely accepted formal definition:
[...] a new sensing paradigm that empowers ordinary citizens to contribute data sensed or generated from their mobile devices and aggregates and fuses
the data in the cloud for crowd intelligence extraction and human-centric
service delivery. — Guo et al. [71]
1.1
Harnessing the Wisdom of Crowds
Over the past few years, the idea of crowd-powered problem solving has been a key re-search focus. In 2005, Surowiecki wrote a book titled “The wisdom of crowds”, describing a general new phenomenon where “the aggregation of data or information from a group of people often results in better decisions than those made by a single individual from the group” [170] identified as Crowd Wisdom. Surowiecki stated that diversity of opinion, independence of thinking, decentralization, and judgment aggregation are four essential qualities which make a crowd smart.
Few years later Malone et al. tried to redefine the well known concept of collective intelligence [105] under the crowd-powered problem solving context [119].
Crowd Wisdom and Collective Intelligence share many aspects and, in particular, both focus on the advantage of group decision-making. In more recent years, those who tried to formalize the concept of MCS took inspiration from these two pillars extending the concept focusing more on crowd-powered data collection and processing.
The term crowdsourcing was introduced in 2006, in an article published in the Wired magazine by Howe [79]. A more formal definition was given by the same author in an-other study: “[...] crowdsourcing represents the act of a company or institution taking a function once performed by employees and outsourcing it to an undefined (and gen-erally large) network of people in the form of an open call. This can take the form of peer-production (when the job is performed collaboratively), but is also often under-taken by sole individuals. The crucial prerequisite is the use of the open call format and the large network of potential laborers.” [78]. Here, key concepts are the initial open call and the presence of a large group of people (especially an online community) willing to participate by performing the requested service. The Wikipedia project is iconic: several thousands of contributors collaboratively create the most comprehensive encyclopedia of the world.
From its definition it is apparent how crowdsourcing follows a top-down approach, where a central institution releases an “open call” and somehow supervises the workers. On the other hand, as pointed out by Carreras et al., MCS initiatives usually follow a mixed bottom-up/top-down paradigm [23]. MCS applications are typically based on the direct involvement of users, trying to involve citizens in solving complex tasks or sensing complex contexts (through their smartphones) in order to solve issues such as public decision-making, urban planning, and quality assessment campaigns of public services. In some cases users can eventually submit reports about public issues, monitor
Table 1.1: Mobile Crowd Sensing literature summary partially taken from Guo et al. [72]
Concept Definition and Relationship By Crowd Wisdom The aggregation of data or information from a group of people
often results in better decisions than those made by a single person from the group.
[170]
Collective Intelligence
Groups of individuals doing things collectively that seem intel-ligent.
[119]
Crowdsourcing The practice of obtaining needed services or content by solicit-ing contributions from a large group of people, and especially from an online community.
[79]
Participatory Sensing
It tasks average citizens and companioned mobile devices to form participatory sensor networks for local knowledge gath-ering and sharing.
[18]
Mobile Crowd Sensing (and Computing)
An extension to the participatory sensing concept to have user participation in the whole computing lifecycle: (1) leveraging both offline mobile sensing and online social media data; (2) addressing the fusion of human and machine intelligence in both the sensing and computing process.
[72]
the air pollution, or even help in earthquake early detection, then the central authority can act to get a particular result based on collected data.
In 2006, Burke et al. proposed the closest concept to MCS: participatory sensing [18]. It tasks citizens to form participatory sensor networks through their personal mobile devices, harnessing their proximity for local data gathering and sharing.
When it was proposed, the definition of participatory sensing emphasized explicit user participation. In more recent years, with the widespread diffusion of smartphone sensing and mobile Internet techniques, the aim of crowd problem-solving systems has been broadened. We can see the definition of MCS — already seen in this Chapter — as an extension of the definition of participatory sensing. They differ in two main aspects: while participatory sensing only leverages data sensed from mobile devices by a physical community, MCS also exploits user-contributed data from online social network services (mainly open data from other projects); MCS usually harness both human and machine intelligence in both the sensing and computing process.
A very brief summary of key definitions and a reference to their first introduction is the shown in Table 1.1.
1.2
MCS applications
To date, a great deal of MCS applications has been developed and used in real-world sce-narios. Presenting a comprehensive list of all the applications known so far is far beyond the scope of this work, but briefly describing some illustrative examples could contribute to gain a better understanding of the MCS peculiarities and challenges. For a more de-tailed analysis and a complete classification, please see the survey of Guo et al. [72] or the one from Zamora et al. [201].
As already seen, MCS applications can serve as sensing and processing instrument in many different fields. Due to mobile devices’ inherent mobility, they can be utilized for sensing tasks aimed to gain better awareness and understanding of urban dynamics. Acquiring knowledge in such context is of prime importance in order to foster sustain-able urban development and to improve citizens’ life quality in terms of comfort, safety, convenience, security, and awareness. Many researchers have focused on studying ur-ban mobility and behavioral patterns in urur-ban areas, using MCS tools support to get their research question answered. For instance, Noulas et al. analyzed check-in histories of a large set of location-based social network (LBSN) users and found out that, for hu-man movement prediction purposes, rank distance played a bigger role than physical distance [135]. Many other studies have investigated urban social structures and events starting from crowdsensed data. Crooks et al. studied the potential of Twitter as a dis-tributed sensor system. They explored the spatial and temporal characteristics of Twitter feed activity responding to a strong earthquake, finding a way to identify impact areas where population has suffered major issues [40]. Large-scale data can be also collected by means of MCS platforms to analyze the actual social function of urban regions, a kind of data which is usually very difficult to obtain and that can be of primary importance con-cerning urban planning. For instance, Pan et al. started from the GPS log of taxi cabs to classify the social functions of urban land [139], while Karamshuk et al. tried to identify optimal placements for new retail stores [90].
Awareness of user location is the foundation of many modern and popular mobile applications, such as location search services, indoor positioning [199], location based-advertising [61], and so forth. But more useful and precise services can be enabled har-nessing all the peculiar characteristics of personal mobile phones. As an example, Zheng et al. used crowdsourced user-location histories to build a map of points of interest which can be of help for people who are familiarizing with a new city [205]. Again, Geo-Life [207, 206] is a MCS platform able to suggest new friendship looking at similarities in user-location logs, while CrowdSense@Place [29] is a framework able to exploit ad-vanced sensing features of smartphones to opportunistically capture images and audio clips to better categorize places the user visits.
In many cases, the development of a particular MCS platform has been the answer to issues raised by pre-existing communities or grassroots initiatives. Citizens and poli-cymakers have usually strong interests in matters like environmental monitoring, public safety, and healthcare, where the participatory and mobile essence of the MCS approach provides a novel way for collaboratively monitor the issue being considered. Besides, the moving nature of these topics draws the attention of online and offline communities. The potential of a community can be harnessed by MCS approaches to engage people and to make them participate in the data collection. It is not just a matter of the number of participants, rather someone who is moved by a topic not only will be more disposed to contribute but — as we are going to discuss in Section 1.3.5 — he or she will also be prone to provide better and more complete data [86]. As an example, Ruge et al. de-scribed how their application SoundOfTheCity [158] allowed users to link their feelings and experiences with the measured noise level, helping in providing information essen-tial to have a more clear understanding of the context (is the high noise level in a party, at a festival or just in a crowded street?). This is an illustrative case of how qualitative data provided by users can enrich the quantitative data gathered through personal smart devices. In short, to fully harness their potentialities when analyzing such contexts, MCS applications should aim not only to collect as much data as possible but also to provide ways for users to enrich the collection with thick data2[183]. Other examples of MCS applications analyzing topics of common interest are: NoiseTube [118] which was a sys-tem able to exploit volunteers’ smartphones to collect data about environmental noise in users’ daily lives and to aggregate them to obtain a fine-grained noise map; U-Air [208] inferred air quality data by heterogeneous crowdsensed data comparing them against in-formation from sensing stations and traffic inin-formation; the Great Backyard Bird Count project3 (cited by Cuff et al. [41]) used volunteers to continuously report the count of
watched birds in the US.
Mobile Crowd Sensing application can also be used for assisting in disaster relief [112, 111], such as earthquakes and floodings [36, 11], or in critical events like gas shortages in urban areas [132]. Healthcare is another field where MCS is helping a lot by collecting a wealth of data for applications more and more useful for an aging society like ours. Google researchers did pioneering work in 2006 using health-related search queries to es-timate illnesses distribution in US [52], while Wesolowski et al. exploited the widespread diffusion of mobile phones to analyze malaria spreading in Kenya [189].
Also, many mobile social recommendation services, like friend, place, or itinerary recommendations, has been enabled by the body of data collected by MCS platforms.
2Thick Data can be defined as: “data related to qualitative aspects of human experience and behavior,
particularly when used as context for the analysis of a large data set”
Most of these systems shared the characteristic of combining mobile crowdsensed data and user-generated information from LBSN. In 2014 Yu et al. presented a system whose aim was to produce travel plan suggestions starting from data such as Points of Interest (POIs) features, temporal and spatial constraints and user data taken from social net-works [200]. Yang et al. developed SEALs [197] a fine-grained preference-aware loca-tion search framework which leverages the crowdsourced traces from Foursquare, using check-ins and extracting users’ sentiment about locations. More recently, Marakkalage et al. introduced a crowdsensing platform aimed to identify POIs among elderly popula-tion in Singapore [120]. Their system can passively collect the locapopula-tion history through GPS sensors embedded in users’ smartphone, and determine popular places among the elderly.
Crowdsensed data in urban areas can be leveraged for public transportation system design, traffic forecasting, and real-time information systems, for monitoring the road network condition and so on. Location history is usually perceived as sensitive data by users who thus need to be motivated or reassured to take part in this kind of crowd-sensing process employing some cooperation incentives. Most researchers in this field choose to collect data from user mobile phones, mainly using GPS, accelerometers, com-pass, gyroscope, and other related sensors already available on board of every average smartphone, while some others made use of other kinds of smart object like GPS track-ing devices (which are usually already on board of vehicles). Many applications on traffic dynamics are based on leveraging data from public transportation, buses, and taxis [187, 20, 108]. Among many it is worth mentioning the work of Giannotti et al. where, using location histories of numerous GPS tracking devices embedded in vehicles (usually for safety reasons), researchers have used mobility patterns to analyze if the current official district division reflects actual traffic flows, travel customs and center of attraction for drivers [62]. An application only based on data sensed using personal user smartphone is SmartRoadSense [2]. The platform is a crowdsensing system used to monitor the sur-face status of the road network. The SmartRoadSense mobile app is able to detect and classify the road surface irregularities by means of accelerometers and send them to an in-cloud server. Aggregated data about road roughness are shown on an interactive online map and made available as open data [57].
1.2.1 MCS classification
Due to large heterogeneity of applications, many classifications have been proposed. MCS platforms can be classified based on the type of phenomena being monitored thus divid-ing them up in applications with a personal and a community sensdivid-ing approach [60]. Applications collecting data about an individual — such as healthcare applications, fit-ness monitoring, and so on — belong to the first category whereas applications whose
aim is to acquire data about large-scale phenomena are part of the second category. A community sensing application pertains to the monitoring of events or contexts not fea-sible by a single individual, because of the scale of the phenomenon is too broad (e.g., air pollution in an urban area) or because to get sufficiently precise data they have to be col-lected from many different sources with different tools (e.g., road conditions monitored by a single user, even if performed multiple times, may be significantly less accurate than when monitored by multiple users, using different vehicles).
Following another classification principle, MCS applications can also be divided into two other categories depending on how much users are aware of the sensing process. When users are asked to actively produce data by reporting an event, taking photos, or taking notes about a particular condition of a context, we can talk of participatory sensing approaches [18]. Opportunistic approaches, on the other hand, are those where the user involvement is minimal and the sensing process is more autonomous and transparent. To this category belong applications that continuously track users or systems where the volunteers can participate in the sensing campaign just by activating the process in their mobile client [102].
Many other classifications are possible. Applications can be divided into different categories based on their scale (e.g., urban, regional, national, worldwide), by categoriz-ing their topic, by their infrastructure, or by the motivation incentives they employ to engage users.
1.2.2 MCS architecture
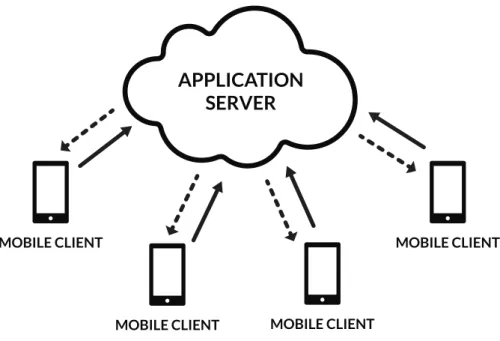
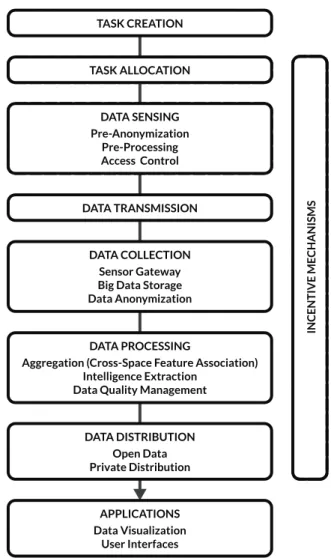
Regardless the category they fit into, all MCS applications share the same simple architec-ture in terms of main software components. As coordinated distributed software plat-forms, MCS systems are usually composed of a central in-cloud application server and several mobile clients. The central server is responsible for managing all the centralized phases of the whole sensing and processing procedure. It implicitly or explicitly assigns the sensing tasks to the users then it receives data collected by participants. The sensing task is performed in a decentralized manner through mobile clients of volunteers. The software client can collect data directly or with the help of the user. In some cases the main mobile client can draw data by connecting to secondary IoT clients, which would be otherwise unable to be directly connected to the application server. In Figure 1.1 the architecture of MCS is depicted in a synthetic but complete way. For a more comprehen-sive analysis of typical MCS architectures, see the work of Louta et al. [110].
A more detailed description of each possible phase of the crowdsensing process is shown in Figure 1.2. Many researchers tried to formulate a suitable reference process structure to illustrate the key functional blocks and to explain the key techniques of MCS systems [72, 193, 202, 110]. The following analysis is mainly based on their work. Few
orig-APPLICATION
SERVER
MOBILE CLIENT
MOBILE CLIENT MOBILE CLIENT
MOBILE CLIENT
Figure 1.1: Software architecture of MCS applications.
inal contributions have been included in order to make the described process updated and coherent with some recent works discussed so far.
Task Creation In this phase, the central entity or the MCS organizer creates specific tasks and provides a detailed description of the required actions. The task creation can be even started by users, the same ones who will consume the data collected using the MCS application [146]. Depending on the platform used, the descrip-tion could be either in natural language or domain specific language that software clients are able to understand and present to volunteers [151]. In some cases, the task creation is implicit in the platform structure. Volunteers who join the appli-cation are automatically tasked with a defined sensing operation [2].
Task Allocation This phase can occur in a centralized or in a decentralized way. The central entity can analyze the sensing task and assign it to specific participants (or nodes of the sensing network) possibly trying to respect given constraints: ensur-ing area coverage, minimizensur-ing the task completion estimated time, maintainensur-ing the number of volunteers involved under a given threshold, ensuring a minimal average trust value among the selected participants, and so on. Another approach is to notify all clients that a new task is available and let them choose whether to
TASK CREATION TASK ALLOCATION DATA SENSING Pre-Anonymization Pre-Processing Access Control DATA COLLECTION Sensor Gateway Big Data Storage Data Anonymization DATA TRANSMISSION
DATA PROCESSING
Aggregation (Cross-Space Feature Association) Intelligence Extraction
Data Quality Management
DATA DISTRIBUTION Open Data Private Distribution INC E NTIVE ME C HANIS MS APPLICATIONS Data Visualization User Interfaces
Figure 1.2: Proposed reference process structure for MCS applications.
take part in the sensing task or not [22, 153]. Depending on the motivation in-centive systems utilized, some systems also allow approaches like auction based assignments [188, 203, 181].
Data Sensing Involves both information sensed from mobile devices and user-contributed data from mobile Internet applications [72]. MCS applications usually have to tackle security and privacy issues, thus providing users with automated or semi-automated mechanisms determining what kind of information they want to pub-lish and whom to share them with is fundamental. Many MCS systems resort to access control mechanisms and pre-anonymization techniques. In order to reduce transmission costs and size, data are often pre-processed on board of the user de-vice. Finding the appropriate tradeoff between the amount of processing to be
done onboard of smartphones and in cloud — after the data have been transmit-ted — is a crucial parameter for a MCS application. To resolve this issue, Xiao et al. proposed an innovative approach using proxy Virtual Machines and a distributed cloud infrastructure as communication middleware between mobile clients and the central application server [193]. The data sensing is an inherently distributed phase.
Data Transmission Sensed data have to be transferred to the central server for further processing. In doing so, mobile clients need to take care of inevitable network in-terruptions and communication issues. MCS applications may adopt opportunis-tic transmission paradigm, storing data in mobile clients internal memory until a suitable network connection makes possible the upload to the server [37]. Other applications implement mechanisms to forward data from a client to its peers in order to exploit their connection while some MCS platforms provide nodes of the sensing network with cooperation tools to allow heterogeneous nodes to enhance the performance of data transmission [69].
Data Collection In this phase, data are received by mobile clients and stored into appro-priate memory supports. Privacy-preserving techniques are applied to ensure se-curity and to avoid that malicious users acquire collected data and can track them back to users. The sensor gateway module provides a standard approach — usually implementing common web services technologies [156] — to enable data collec-tion from crowdsensed sources supplying a unified interface. MCS applicacollec-tions may collect a vast amount of heterogeneous data and big data storage systems are usually employed. Big data techniques simplify the collection of large-scale and complex data like noise level measured across a urban area. Sensing tools used by participants to evaluate the phenomenon at stance typically varies a lot, leading to significant differences in the accuracy of crowdsensed data. Therefore data are commonly transformed and unified before being stored and passed to the next phase in order to boost further processing. Data anonymization techniques like data coarsening, randomization, k-anonymization, spatial cloaking are applied to data to eliminate or to mask information that might compromise participant pri-vacy by leading to their identification or by disclosing sensitive attributes [146].
Data Processing Aims to derive high-level intelligence from raw data received. Using logic-based inference rules and machine-learning techniques this step focuses on discovering frequent data patterns in order to extract crowd-intelligence starting from data sensed by mobile users and user-contributed data from other mobile Internet applications mixed together. The first step of the data processing is the
data aggregation phase, in that, raw data from different users, time and space are combined on different dimensions and associated with reference known features (e.g., map-matching [45]). Then further data processing techniques are applied to extract the three kinds of crowd-intelligence (namely: user awareness, ambient awareness, and social awareness [70]). Most MCS applications also sport a data quality management module. When information passes through this phase, dif-ferent statistic methods are applied to classify the quality of aggregated data.
Data Distribution Once data have been aggregated, and the crowd-intelligence has been extracted from them, this information is usually made publicly available to be re-used (often as Open Data) or only shared in a private way with authorities, com-munities, companies, etc.
Applications Finally data arrive at the stage where they are re-used, exploited or just shown. Many applications and services can be enabled by MCS platforms. The implementation of a usable user interface and of data visualization techniques (such as mapping, graphing, animation) are essential to fully exploit the crowd-intelligence extracted by the underlying MCS system starting from raw data. Both of them make data-based decision-making tasks and awareness sharing to users feasible.
Cooperation Incentives As shown in Figure 1.2, the cooperation incentives phase influ-ences almost every other stage of the proposed framework. Users can be motivated to participate in a sensing task by using incentives in the task allocation phase. In the sensing phase, the idea of a possible future reward can motivate users to col-lect better or more data. Data transmission and colcol-lection encompass dealing with privacy-related issues. Strict privacy rules can seriously limit the kind of incentives the platform can make use of. The definition of a data quality index in the data processing stage can positively or negatively affect the type of rewarding token a user collects by providing some data. About the data distribution phase, a user could be rewarded with different quantity of rewards based on how much third-party applications or users are using the aggregated data he contributed to.
1.3
Challenges and open issues
As a relatively new paradigm, in the MCS field, many challenges are currently being ad-dressed by researchers and developers. MCS application designers often borrow tech-niques and tools from related areas such as big data and gamification but many other
problems still need an optimal and original solution. In this Section, many open issues are presented.
1.3.1 Data quality
Data quality is usually described as the degree of how suitable the information is for the objective we want to employ them. One of the drawbacks in the MCS process already seen is that there is no o little control over distributed sensing operations. Acquiring data on a particular phenomenon through MCS often means to collect a vast quantity of information coming from many different unsupervised sources. Each source produces data by means of automated or semi-automated processes whose measurements could be context-related, non-calibrated or just not precise enough. Particularly, the involvement of the human variable enhances the general lack of control over the way data are acquired. Redundancy is the main strategy MCS platforms usually put in place against low-quality data collected by unknowing or malicious users. But it could not be enough, in particular for sensing tasks which require few participants or where redundancy is un-suitable (e.g., the phenomenon to be sensed is too transitory to be sensed many times or by many users). Therefore, volunteers and data selection are often needed to improve overall data quality. Filtering algorithms could be directly implemented in MCS clients aiming to filter out data before their transmission to the server. While server-side data fil-tering is commonly preferred because it can act as a barrier for data provided by malicious users who could not be effectively stopped with distributed approaches.
Data quality could also be a determining factor concerning how much a volunteer should be rewarded for the work he carried within a sensing task. Once data are processed they should trigger positive or negative feedback on the motivation incentive system im-plemented by the application, assuring greater rewards for users who provided higher quality data.
1.3.2 Scalability
Thanks to its distributed sensing approach, a MCS application could gather vast quan-tities of data in little time. Data coming from various sources also usually present het-erogeneous structure and types. Volume, velocity, and variety are typical features of big data [103], indeed many MCS applications make use of big data analytics and big data storage techniques to manage such big, fast and complex body of information. Tradi-tional approaches in storing and processing data revealed to be not suitable for handling demanding tasks such real-time sensing in wide areas. In order to achieve a comprehen-sive picture of the sensing object, MCS systems often try to integrate crowdsensed data and user-contributed knowledge bases. Once data have been received, pre-processed and
stored in-cloud, machine learning and data visualization techniques help in mining and presenting the crowd-intelligence mined from raw data [22].
1.3.3 User interface
As discussed in Section 1.2.2, MCS platforms are commonly composed of a server-side stack and a client-side application. The latter usually consist in a mobile application run-ning on at least two of the three major mobile platforms which — at the time of writing — are leading the market: Android, iOS and Windows Mobile (successor of Windows Phone). Most of the times, MCS applications aim to engage as many participants as pos-sible so, lowering the barriers preventing users from joining the sensing task is a primary concern of platform designers. In terms of MCS mobile clients, this usually means to provide users with a native mobile application for their platform of choice. In order to speed-up the development and to contain implementation costs a multi-platform devel-opment approach (like Xamarin [75]) or a web-based approach are used [93].
Recently, the growth of mobile application market started to slow down, and mo-bile users became less prone to install new apps unless for utterly necessary tasks [35], preventing some MCS applications to reach many users.
Moreover, in 2013 Xiao et al. proposed 3 code design principles to “Lower the barri-ers to large-scale mobile crowdsensing”:
i) Separation of data collection and sharing from application-specific logic. ii) Removal of app installation on smartphones from the critical path of application deployment.
iii) Decentralization of processing, and data aggregation near the source of data.
The principle II states the need for MCS application designers to consider alternative ways to cover the last mile between the platform and the volunteers. Nonetheless, a viable alternative to standard mobile applications is yet to come.
1.3.4 Privacy
MCS applications are strongly based on human participation. Many projects start as grassroots initiatives and, as seen in Section 1.2.2, the sensing phase is usually accom-plished thanks to volunteers who are willing to help in the sensing campaign.
But human involvement inherently brings privacy concerns. Participants may not want to share their sensory data, as they may contain or reveal private or sensitive infor-mation about the user. Privacy concerns may discourage users from joining sensing a
campaign. Disclosing of one’s identity, exposing sensitive attributes or activities about participants are typical user’s concerns, and they can lead to a participant withdrawal from a sensing task or to not making him joining the task in the first place. Therefore MCS applications have to commit to protecting users privacy.
The privacy issue in MCS has recently been studied extensively [145, 146]. Researchers defined detailed adversary models to understand how malicious and semi-honest entities within a MCS sensing paradigm could obtain private information about other users [145]. They have also studied most common attacks and found out what countermeasures have to be taken in order to prevent or stop such attacks. Most common techniques include data anonymization through use of pseudonyms, connection anonymization. Others act directly on the MCS data structure, trying to remove or conceal, spatio-temporal data or links between contiguous data, like: spatio-temporal cloaking, spatial obfuscation, and data coarsening. Some approaches try to acquire as little information as possible about users, applying pull-based data collection scheme [145] and zero knowledge techniques [51].
Many privacy-preserving techniques are based on the fundamental principle of mak-ing the user in control of how many and which information he wants to share. For in-stance, users could be willing to voluntarily disclose some personal privacy-concerning data, like sharing their current location in a social network. Projects like NervousNet [147] provide tools which let MCS participants to explicitly set sharing or not-sharing prefer-ences about their information. This kind of approach tries to realize a privacy-preserving by-design approach.
Once data have been aggregated, and crowd-intelligence has been mined MCS ap-plications commonly make results of their sensing process available privately or as Open Data. In both cases, the platform design needs to ensure that no one who has helped in any stage of the process can be back-tracked starting from shared data. Open data protection and group privacy are so fundamental to even raise ethical issues among re-searchers [54].
Is worth mentioning that applying strict privacy-preserving mechanisms in design-ing a MCS system, could hinder the implementation of many other useful features or even the sensing task aim itself.
1.3.5 Cooperation incentives
People involved in MCS help the sensing task process by providing their limited resources. To sense, collect and process crowdsensed data participants have to make either implicit efforts (e.g., energy, bandwidth, monetary costs) or explicit efforts (e.g., to collect or to give inputs, to assess process or other efforts, to act as bridge for other peers) [72]. As many MCS instances are grassroots initiatives, volunteers may be willing to help just be-cause interested in the topic, but most of the time users need to be strongly motivated
by providing incentives mechanisms [114]. Cooperation incentives can be broadly classi-fied as intrinsic or extrinsic (financial) incentives [99]. Intrinsic incentives comprehend: interest in the topic (users are willing to participate because they think the topic is impor-tant or interesting), social or ethical motivation (such as altruism, or interest in public recognition), and personal enjoyment (in that, user enjoy the sensing process because it is an entertaining activity or a proper game). Intrinsic incentives are often insufficient to motivate volunteer and many MCS platform resort to extrinsic incentives which prob-ably are the easiest way to motivate people regardless the type of activity they are asked to do. Extrinsic incentives include fiat money, virtual cash, or credits for online/offline services. The drawback of using financial incentives is that once money is involved users will be motivated to deceive the system to get more economic benefits. In this regard, financial incentive mechanisms based on game theory have been proposed [196, 84]. Un-fortunately, these methods are quite complicated to implement and unsuitable for many types of MCS systems. There is still the need for a new rewarding platform able to en-courage and attract people and which comply to the many different MCS application peculiarities.
1.4
Structure of this work
In the rest of this work, we address some of the MCS open issues presented so far. In Chapter 2 we tackle the data quality issue, proposing two original solutions about charac-terizing the quality of crowdsensed data [58, 45]. In Chapter 3 we discuss cooperation in-centives, trying to address the coexistence between strict privacy-preserving mechanisms and functional rewarding platforms [33]. Chapter 4 contains an in-depth analysis of a new conversational interface paradigm, which we proposed to name bot-plication and we believe could be a suitable answer to some user interface hurdles of MCS applica-tions [97]. In the last Chapter, we draw our conclusions on the MCS paradigm and outline possible future research directions.
Data Quality
During the data collection phase, MCS data can be conceptually modeled as a stream or many single tokens of information flowing from clients towards the central server. On the server side, information will be received and stored discretely as numerous data particles, possibly linked one another. Along with application-specific values (e.g., noise level, location history, temperature, etc.), each particle typically includes a timestamp (or a time window), and geolocalization values (usually a point, a path, an area, or a set of these features). For instance, an urban noise level monitoring application would gather data particles containing: the recorded noise level (typically a numeric value), the times-tamp of when the sensing has been performed, and the geolocalization of the place where the recording happened (usually expressed as a couple of latitude and longitude values). MCS applications generally process all these information together to have a complete un-derstanding of the phenomenon being analyzed. Therefore an acceptable data quality of all the data contained in a particle is of prime importance. In general, applications analyz-ing transient events need precisely time-stamped information while for applications like SmartRoadSense [2], which gather data about an event happening in a moving context, having a good estimate of the sensing instrument’s location is paramount.
In this chapter, data quality issues are discussed. In the first Section, we try to define an index based on simple statistical tools, suitable for MCS data and applicable on differ-ent parts of a data particle. In the second Section, we propose a map-matching algorithm capable of dealing with inaccurate GPS information and dense traces of data. This algo-rithm has been designed to be used by applications in which having a reliable association between data and features on a map is fundamental for the platform’s purposes.
2.1
Bootstrap for Data Quality Estimation
As already described, the distributed architecture of MCS systems, the heterogeneity of sensing devices used, and the direct involvement of users influence the quality of data [72]. To fully exploit the wealth of data collected by MCS platforms, the num-ber representing sensed quantity should be associated with quality indicators in order to help in discriminating between reliable and unreliable data. Having an estimate of such quality has a large impact on following processes carried on by other system com-ponents (e.g., data filtering, crowd-intelligence extraction, and rewarding mechanisms). MCS features that concur to define data quality can be broadly summarized as follows:
• The spatial and temporal resolution of the monitoring activity;
• Systematic and random errors in the measurement of the sensed quantity. Such errors are due to lack of precision and heterogeneous processing and communica-tion capabilities in embedded sensors;
• Users with different trustworthiness levels may provide reliable or unreliable data. To date, approaches to tackle the data quality issue have primarily focused on outlier identification and elimination [72], on collaborative resolutions of lack of consistency in data [127], or on reputation systems used to single out corrupted or misleading con-tributions [82, 83].
Crowdsensed data are obtained by a measurement activity. In MCS, it can be a direct or an indirect measurement and it is usually performed in a distributed way by using a smartphone as a sensing device. The typical way to deal with the data quality issue is by estimating the uncertainty associated with each measurement (as is customary in phys-ical sciences [172]). Instead, we propose an approach for estimate the quality of data collected by MCS systems which takes into account the distributed nature of the pro-cess. We cast the problem of data quality assignment as an evaluation of the uncertainty of the underlying measurement process. Briefly, the measurand (i.e., the quantity associ-ated with a phenomenon we are measuring) estimate has to be associassoci-ated with a measure of uncertainty. The uncertainty is typically estimated by looking at how the dispersion of the measured values is (the larger the dispersion, the bigger the uncertainty). The mea-surement error is estimated by the dispersion around the actual value of the measurand which is determined by the interaction among error-prone sources. In MCS systems, the value is typically the result of a composition of different measurements. Therefore, the uncertainties associated with each measurement need to be propagated computing their combination [172]. Lately, user trust principles an uncertainty propagation tech-niques have been used as sensing uncertainty metrics in the sensor network context by Asmare and McCann [5].
Typical methods to gauge uncertainty propagation commonly imply some model-ing assumptions about the measurement process, especially for those approaches con-cerning the probability density function of measured values [172, 38, 39]. The distribu-tion described by probability funcdistribu-tions could be employed either by analytically deriving the distribution of the measured quantity (given) its functional dependence from the in-put quantities or by performing Monte Carlo simulations to obtain an estimate of the measurand’s output distribution [38, 39, 12].
Monte Carlo numerical simulation is a suitable solution if the input distribution is known or reasonable assumptions can be made about it. Unfortunately, this is not the case of MCS applications where measurements are performed by many devices in unsupervised conditions, making the formulation of a sound statistical model nearly im-possible. Besides, having an adequate mathematical model of the input variable would not suffice in any case, as their composition function makes it difficult to derive an analyt-ical expression of the output (e.g., aggregation phases in MCS usually output quantities that are results of recursive composition functions [2]). Additional issues are encoun-tered when the temporal dimension is taken into account. In fact, the composition of several measurements over longer periods is a common approach used to smooth and progressively update the collected information. This poses the challenge of how to man-age such an update of measurements at given checkpoints.
To solve the issues mentioned above, we propose to employ statistical non-parametric bootstrap which is a largely known data-driven technique for empirically estimating the uncertainties of measured unknown quantities. Bootstrap has been proven to be a suit-able solution when modeling approaches and analytical methods are hardly applicsuit-able [155, 100]. In simple terms, bootstrap is a Monte Carlo simulation method that approxi-mates the sampling distribution by sampling the original observations with replacement. The statistic of interest is computed for each resample and the resulting distribution — named bootstrap distribution — can be used as a replacement of the actual sampling dis-tribution in order to study its shape and spread [155, 100, 48, 49, 91]. Statistical boot-strap as a tool to characterize uncertainty propagation has been used by Kass et al. in the framework of neural data analysis [91] while Lee et al. exploited it as a method to refine estimation of a system for blood pressure measurement [104].
In this Section we try to give the following contributions:
• A method that frames the problem of assessing data quality in crowdsensing plat-forms into a formal, technically sound approach, by casting it as an uncertainty evaluation problem.
• The design — based on statistical non-parametric bootstrap — of a data-driven strategy which could be used to get rid of complex interactions among the
(poten-tially many) variables affecting the measure estimate and the related uncertainty propagation.
• The evaluation of the applicability on a MCS application, characterized by peri-odic updates of data and associated quality.
We validated the proposed approach against numerical simulation and synthetic bench-marks. We also implemented the bootstrap-based method in a real-world mobile crowd-sensing platform for road surface roughness monitoring. Our experimental results sug-gest that our method is a suitable tool for evaluating data quality in a complex sensing tasks by estimating the uncertainty of the overall process measurements.
In the following Section, we describe the architecture of the MCS platform used in our case-of-study. Then, the proposed method is detailed and, in the last two Sections we outline the experimental setup, we present empirical results obtained, and finally, we draw our conclusions.
2.1.1 Reference System Architecture
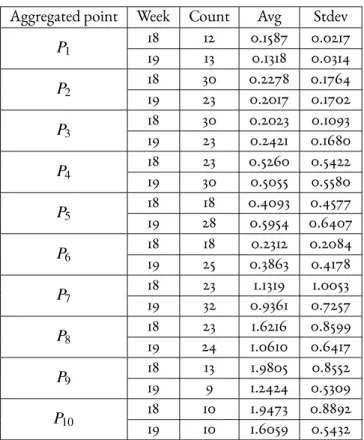
In the following Sections we will often refer to a MCS platform called SmartRoadSense (already cited in Chapter 1). The system has been developed to provide quantitative esti-mations of road network surface roughness [2, 57, 45] and in this Section we will briefly describe its features and architecture. The SmartRoadSense’s approach at data sensing and processing is general enough to be employed also in different contexts. As many other MCS platform, sensing tasks in SmartRoadSense are performed by multiple dis-tributed sensing devices by means of which volunteers contribute to gauge the quantity of interest in a specific location, within a specific time-window.
As shown in Figure 2.1, the architecture of the SmartRoadSense platform is charac-terized by the following three layers:
• An app running on users’ smartphones during a given car trip. The application makes use of the smartphone’s accelerometers and computation capabilities to col-lect and process acceleration values the device is subject to. The result, represent-ing the estimated roughness of the travelled road in a given point at a given time, is geo-referenced, time-stamped, and transmitted to a server by means of radio connectivity.
• A cloud-based back-end service in charge of collecting, aggregating and storing data from multiple users. According to Figure 2.1, this layer is in charge of two tasks:
Figure 2.1: SmartRoadSense architecture
– Map-Matching: georeferenced roughness indexes stored in the database of raw-data (SRS_RAW ) are projected on digital cartography maps, specifi-cally OpenStreetMap1. Map-matching entails the association of GPS points to features on a digital cartography maps;
– Sampling and aggregation: data is subsequently aggregated to provide a sin-gle evaluation (for a given spatial coordinate) of the roughness index, given the data made available for that point by multiple users. Aggregated data is used to populate the related database (called SRS_AGGREGATE).
• A front-end service providing visualization capabilities of the geo-referenced in-formation produced by the SmartRoadSense processing pipeline. The same front-end also allows interested front-end-users to download a continuously updated version of the database containing all SmartRoadSense aggregated data in a ready-to-be-reused fashion. Each row of the open-data dataset contains a set of information relative to the roughness level, the geo-localization, the quality of the data, and
1OpenStreetMap is a collaborative project whose aim it to build a free editable map of the world. Please
even a indication of the estimated number of occupants of each vehicle that has been involved in the gathering process. The detailed description of each informa-tion is shown in Table 2.1.
Column Name Format Description
LATITUDE DECIMAL
DEGREES
The latitude coordinate of center of the section of the road where the PPE value has been estimated.
LONGITUDE DECIMAL
DEGREES
The longitude coordinate of center of the section of the road where the PPE value has been estimated.
PPE DECIMAL The average roughness level of the road
section.
OSM_ID LONG INT The ID of the road in the OpenStreetMap
dataset.
HIGHWAY TEXT The road category according to the
OpenStreetMap classification2
QUALITY DECIMAL A numerical estimate of the quality of this particular PPE value. This quality index has been calculated using our bootstrap-based method, in our case-of-study.
PASSENGERS DECIMAL The average of the number of passengers in vehicles involved in the process.
UPDATED_AT DATE (ISO
8601)
The last update of the data for that particular road section.
Table 2.1: SmartRoadSense open data structure
In SmartRoadSense (and possibly in other mobile crowdsensing systems), the sens-ing process can be divided into time epochs, dursens-ing which data is continuously gath-ered, processed and aggregated. Segmentation of both space and time dimensions (e.g., through the definition of a bi-dimensional grid and the discretization of the time axis) can be in fact considered a common approach to the design of MCS at different spa-tiotemporal resolutions [82, 83, 204].
sta-tus of measured variables and, in case, it performs a composition operation with data collected in previous epochs (in SmartRoadSense an epoch represents a week of moni-toring activity). The platform continuously receives values of road roughness from end users. Roads are spatially segmented into landmark points, then all values associated to positions falling within a given range (typically 20 meters) of a landmark point p are ag-gregated and concur to the overall roughness index of p (the mean value of contributed points is taken by default). At the end of each week current epoch terminates, and the roughness value of each point p is updated by taking the average between the value of current epoch and the value of previous epoch. This processing inherently implements a form of infinite impulse response filter, the aim of which is to progressively downweigh (through an exponential decay of weights) the contribution of older samples to the value assigned to p. Needless to say, different update rules can be conceived, according to dif-ferent specific needs.
The above description exemplifies the difficulties that could arise when dealing with uncertainty propagation in these settings, since the measurand (the roughness index of pin SmartRoadSense) needs to be tracked along its evolution and the corresponding unknown uncertainty subject to possibly complicated transformations.
2.1.2 Bootstrap Based Uncertainty Propagation
To bypass all the issues related to the propagation of uncertainty in MCS platforms that preclude the adoption of analytical and Monte Carlo methods, we propose to take ad-vantage of the statistical bootstrap.
Figure 2.2 provides an overview of the toolflow of the proposed approach when ap-plied to the SmartRoadSense crowdsensing system, while Table 2.2 summarizes the sym-bols used along this Section.
As illustrated by Figure 2.2, data produced by terminal devices at a given time epoch ti(with i = 0, 2..., nnw) are collected into a sample of size ni. Nonparametric bootstrap is applied to this sample (for each time epoch). Data is sampled with replacement, obtain-ing Nbresamples, each of size ni. The statistic of interest (i.e. the mean value x) is com-puted from every resample and plugged into the processing block labeled as Y , which represents the functional relationship between all variables that influence the measurand. In SmartRoadSense application, this phase encompasses the propagation of uncertainty along the different time epochs, according to the update filter: each mean value xiat time epoch tiis averaged with the corresponding value yicomputed at time epoch ti−1. The
re-sult yi=xi+y2i−1is then stored as current value to be composed with a new measurement
at next time epoch.
The distribution of values assigned to y is the output bootstrap distribution. Such distribution can be studied to obtain information about its center, shape and spread.
Symbol Description
p Generic geo-referenced landmark (aggregated) point
nw Number of epochs
t0,t1, ...ti, ...tnw Time epochs
n0, n1, · · · , nnw Size of samples and of resamples at epoch ti
Nb Number of bootstrap resampling iterations
x Mean value of a generic resample
xi Mean value of resample at epoch ti
yi Measurand variable computed at epoch ti
Y Generic function relating xito yi
Table 2.2: Description of notations and symbols used in this Section.
t0 1 sample of size n0 ti 1 sample of size ni tnw Bootstrap distribu!on Resample of size n0à Resample of size n0à Resample of size n0à Resample of size nià Resample of size nià Resample of size nià Propaga!on of distribu!ons Resample of size nnwà Resample of size nnwà Resample of size nnwà s hc o p E 1 sample of size nnw Y
Figure 2.2: Toolflow of the bootstrap-based approach.
While the center of the output bootstrap distribution represents the estimate of the statistic under study (the mean value in this specific case), the shape provides effective information about the type of distribution and, finally, the spread conveys information about the output uncertainty (what we are searching for). Needless to say, bootstrap
re-sampling does not lead to any improvement in the accuracy of the estimate of the statistic, since this clearly depends on the accuracy of the initial sample from which all resamples are derived. Nevertheless, important information regarding the sampling distribution is encoded in the bootstrap distribution and this is exactly what we are interested to ex-ploit to infer the uncertainty of measurement. The histogram placed in right-bottom corner of Figure 2.2 illustrates this concept. Indeed, bootstrap distribution values are finally sorted and samples representative of a given percentile are extracted to provide a confidence interval CI to be used as uncertainty estimate.
Other statistics might be evaluated according to the presented method. In fact, one of the major points of strength of the bootstrap is its flexibility in handling different types of statistics, which has to be compared with the difficulties faced to derive analytical results. If we were interested, for instance, at investigating the uncertainty associated to the median value (instead of the mean) the same approach would remain valid and we would only need to change the computation of the mean value x from each resample with the respective median value.
The main algorithmic steps of the proposed approach can be summarized as follows: 1. for k = 1 to Nb
• for i = 2 to nw
– Sample with replacement the observation vector collected during time epoch ti
– Compute mean value xi(or any statistics of interest) of the bootstrap resample at time ti
– Update measurand yiaccording to Y . In SmartRoadSense, yi= (xi+
yi−1)/2
2. Extract 95% confidence interval from bootstrap distribution
For each crowd-based measurement the system will reiterate the whole process de-scribed by the above pseudo-code (and shown in Figure 2.2). For instance, the Smart-RoadSense platform applies the bootstrap process for each aggregated point in the ex-ample. As already detailed in Section 1.3.2, MCS applications can collect large amount of data in little time. The big data flow could raise the question of the scalability of the proposed approach, which should be taken into consideration when a huge number of uncertainty evaluations have to be carried on. Nonetheless,the inherent parallelism of the proposed approach should be remarked. In fact, uncertainty intervals associated to different geo-localized points can be computed independently from each other. There-fore, in principle, they can be split in many processing tasks that can be autonomously executed in parallel, potentially mitigating the impact of the computational burden.
2.1.3 Experimental Results
To validate the introduced technique, several experiments have been conducted: • First, a set of synthetic benchmarks has been devised to compare the bootstrap
based uncertainty evaluation against a standard Monte Carlo method, under the assumption of knowing the input probability distributions, needed to run the Monte Carlo experiments.
• Second, a sensitivity analysis has been performed to evaluate the dependence of the results from the number of bootstrap resamplings (Nb), allowing to explore the tradeoff between accuracy and computational complexity.
• Third, an experiment has been conducted to simulate the case of a system measur-ing a time-varymeasur-ing quantity.
• Last, the uncertainty of a measurement within the SmartRoadSense crowdsen-sing platform has been computed to show the applicability to a real world use-case.
2.1.4 Synthetic benchmarks
The rationale of these experiments was to assess the suitability of the proposed approach in terms of accuracy of the confidence interval. The proposed bootstrap-based uncer-tainty propagation has been validated by comparing it with standard Monte Carlo un-certainty propagation (SMC, for short), assuming the knowledge of input probability density functions. We recall that, while this is an assumption that has to be made if one wants to apply standard Monte Carlo propagation, it cannot be taken for granted. The bootstrap propagation technique, conversely, doesn’t rely on any type of knowledge of input data, rather it performs a data-driven Monte Carlo simulation by drawing the so called pseudo-observations from the vector of initial observations and generating from it (through resampling) all the information needed for inference tasks.
Three types of distributions have been considered, covering a wide spectrum of pos-sible statistical configurations, namely: a Gaussian distribution of meanµ= 5 and stan-dard deviationσ = 1, a uniform distribution taking values in the [4, 6] interval, and a Rayleigh distribution with scale parameter b = 5.
We included the Gaussian distribution because of its role in statistics and error dis-tributions [155]. As well, we chose the uniform distribution since it is often studied in uncertainty evaluations of measurements [38]. Finally, we also took into consideration the Rayleigh distribution because it is an example of asymmetric distribution, which adds to the significance and coverage of our experiments.
For what concerns the bootstrap based uncertainty propagation, we generated 100 points (according to each of the input distributions) representing the observations. Sam-pling with replacement has been performed with Nb= 105replications, mean values have been computed and given as input to the propagation pipeline representing the up-date process described in the last Section: the mean of observed values at each epoch has been averaged with the mean of observed values at previous epoch. Three sets of experi-ments were performed, simulating a time horizon of, respectively 2, 10 and 25 epochs (on a system like SmartRoadSense, characterized by weekly updates, this means simulation on an interval spanning from half a month to around half a year). The approximate 95% confidence interval has been computed by taking the 0.025 and 0.975 quantiles of the resulting bootstrap distribution.
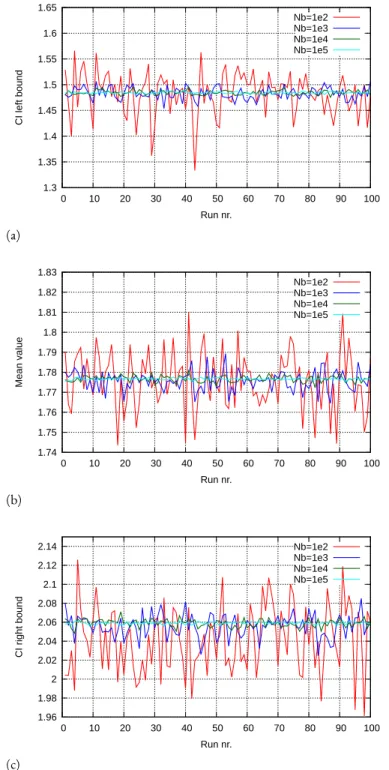
Regarding Monte Carlo simulations, for each type of distribution we generated 100 points, took the mean value and propagated it according to the same rule (i.e. mean of current epoch averaged with the updated value y computed at previous epoch) on the same time horizons (i.e. 2, 10, and 25 epochs). The whole process has been repeated for 105trials, leading to a distribution of values from which the average value and an estimated 95% confidence interval have been computed.
All the experiments have been repeated for 10 runs. Results are represented by the average of the following values: i) the mean value at the end of the propagation process (representing the estimate of the measurand); ii) the lower bound of the 95% confidence interval; iii) the upper bound of the 95% confidence interval.
In Figures 2.3a, 2.3b, and 2.3c we reported histograms providing a comparison of the performance of both methods according to the above mentioned metrics for, respec-tively, Gaussian, uniform and Rayleigh input distributions. For each Figure, histograms denote the mean value estimate, together with error bars encoding the confidence inter-vals for each simulated epochs horizon (2, 10, 25). As a reference term, we also computed the values (represented as star markers in Figures 2.3a, 2.3b, and 2.3c) that would be ob-tained for the measurand if no bootstrap were applied, but only a simple composition of the observations were made epoch by epoch.
Results provide evidence of a very good agreement between the standard Monte Carlo approach and the proposed bootstrap uncertainty propagation method.
In particular, the width of confidence intervals obtained with our method are within a 1.5% deviation from the intervals estimated by means of SMC, with a maximum 0.15% relative error on the value of the lower bound and a 0.13% relative error on the upper bound for the Gaussian input.
In case of uniform input distribution, we obtained confidence intervals whose width differs at most for a 1.7% from that of SMC, while lower bounds of the intervals are within 0.32% from their SMC counterparts, and upper bounds fall within a 0.35% range.
4.5 4.6 4.7 4.8 4.9 5 5.1 5.2 2 10 25 Mean value s and confide nce intervals Nr. of epochs Bootstrap Monte Carlo
(a) Mean values and confidence intervals. Normal distribution (µ= 5,σ=
1). 4.5 4.6 4.7 4.8 4.9 5 5.1 5.2 2 10 25 Mean value s and confide nce intervals Nr. of epochs Bootstrap Monte Carlo
(b) Mean values and confidence intervals. Uniform distribution (a = 4, b = 6). 5 5.5 6 6.5 7 2 10 25 Mean value s and confide nce intervals Nr. of epochs Bootstrap Monte Carlo
(c) Mean values and confidence intervals. Rayleigh distribution (b = 5).
![Table 1.1: Mobile Crowd Sensing literature summary partially taken from Guo et al. [72]](https://thumb-eu.123doks.com/thumbv2/123dokorg/4777662.48202/13.892.213.751.217.621/table-mobile-crowd-sensing-literature-summary-partially-taken.webp)


![Figure 2.8: Case study: mean values and confidence intervals at [2.5% 97.5%] for 10 points taken from a monitored road in SmartRoadSense](https://thumb-eu.123doks.com/thumbv2/123dokorg/4777662.48202/42.892.221.599.490.737/figure-case-values-confidence-intervals-points-monitored-smartroadsense.webp)