Occupational Medicine 2017;67:301–304 Advance Access publication 8 March 2017 doi:10.1093/occmed/kqx031
© The Author 2017. Published by Oxford University Press on behalf of the Society of Occupational Medicine. All rights reserved. For Permissions, please email: [email protected]
Protective factors for work ability in preschool
teachers
I. Sottimano, S. Viotti, G. Guidetti and D. Converso
Department of Psychology, University of Turin, 10124 Turin, Italy.
Correspondence to: S. Viotti, Department of Psychology, University of Turin, Via Giuseppe Verdi 8, 10124 Turin, Italy. E-mail:
[email protected]; [email protected]
Background Work ability (WA) describes the physical and intellectual resources on which individuals can rely to respond to work demands. While several studies have investigated the protective role of work-related psychosocial factors on WA, only a few have examined differences across age cohorts. Moreover, few studies have investigated WA in the educational context and most of those did not consider preschool teachers.
Aims To examine the role of psychosocial factors (support from colleagues, support from supervisors, work meaning, reward, skill discretion and autonomy) in sustaining WA among preschool teachers in different age cohorts.
Methods A cross-sectional study of preschool teachers employed in the municipal educational services of a city in northwest Italy. Study subjects completed a self-reported questionnaire.
Results Among the 706 study subjects, in the 35–44 age cohort, support from colleagues was positively associated with WA. In the 45–54 age cohort, WA was found to be associated with reward and skill discretion while in the 55–63 age cohort, work meaning was significantly associated with WA.
Conclusions Our findings indicate that potential protective factors for WA may differ between age cohorts. They also suggest that in order to sustain WA effectively, interventions in working populations should be tailored to employees’ ages.
Key words Ageing workforce; preschool teachers; work ability.
Introduction
Preschool teaching is a demanding profession; caring for children aged 0–6 requires high physical and emotional involvement [1]. In this context, work ability (WA), the physical and intellectual resources on which individuals can rely to respond to work demands [1,2], significantly affects work quality and performance. Previous studies have widely investigated WA correlates. Age was found to be negatively associated with WA [2], whereas psy-chosocial factors, such as job control, reward and social support, positively affect WA [2,3]. Recent studies have suggested that the effect of these factors on well-being may vary according to workers’ ages. Guglielmi et al. [4] observed that the engagement of younger teachers is driven by the opportunity for development and support from colleagues, while older teachers need to see their competencies acknowledged.
While several studies have investigated the protect ive role of work-related psychosocial factors on WA, only
a few have examined differences across age cohorts. Moreover, few studies have investigated WA in the edu-cational employment setting and most of those did not consider preschool teachers [1]. This study aimed to determine if work-related psychosocial factors (includ-ing reward, support from superiors and colleagues, job control, work meaning and skill discretion) played differ-ent roles in supporting WA across age cohorts.
Methods
The data were collected in 2013 from preschool teachers employed in the educational service of a city in northwest Italy by administering a self-report questionnaire to them during working hours. Questionnaires included a first section aimed at col-lecting background variables and a second one to measure work-related psychosocial factors, demands, depression and WA. Measures and variables employed are reported in Table 1. Before data collection began,
302 OCCUPATIONAL MEDICINE
a series of meetings were conducted to share the ob jectives and the timeframe of the research with school administrators and teachers. The voluntary nature of participation, the anonymity of the data and the elaboration of the findings were ensured. In accordance with national legal requirements, no additional ethical approval was required because no patients were involved. The research conformed to the requirements of the Helsinki Declaration (and subse-quent revisions).
Analyses were conducted using SPSS 22. For each age cohort, a stepwise multiple linear regression was performed.
Results
In total, 884 questionnaires were administered to all teachers available during the survey, and 776 were returned. The final dataset consisted of 734 workers (questionnaires were considered valid if the reported number of missing values was ≤20%). The average age of participants was 50 (SD 7.7; range 25–63). Participants were grouped into four age cohorts: 4% were in the 25–34 age cohort, 18% were 35–44, 41% were 45–54 and 37% were aged between 55 and 63. The 25–34 cohort was not considered in the following analyses because its small size made it inadequate for multivariate regression analysis.
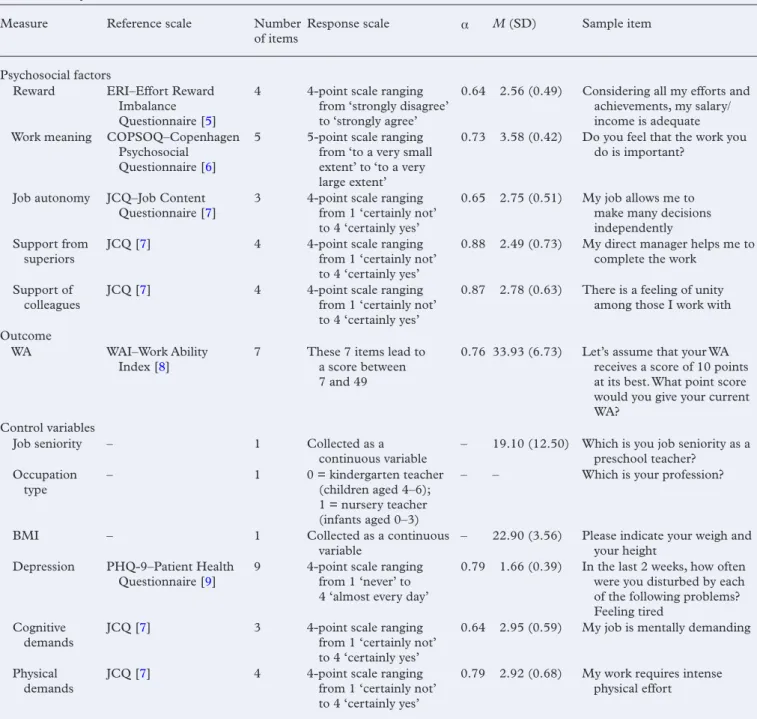
Table 1. Study variables and measures
Measure Reference scale Number
of items Response scale α M (SD) Sample item
Psychosocial factors
Reward ERI–Effort Reward Imbalance Questionnaire [5]
4 4-point scale ranging from ‘strongly disagree’ to ‘strongly agree’
0.64 2.56 (0.49) Considering all my efforts and achievements, my salary/ income is adequate Work meaning COPSOQ–Copenhagen
Psychosocial Questionnaire [6]
5 5-point scale ranging from ‘to a very small extent’ to ‘to a very large extent’
0.73 3.58 (0.42) Do you feel that the work you do is important?
Job autonomy JCQ–Job Content
Questionnaire [7] 3 4-point scale ranging from 1 ‘certainly not’ to 4 ‘certainly yes’
0.65 2.75 (0.51) My job allows me to make many decisions independently Support from
superiors JCQ [7] 4 4-point scale ranging from 1 ‘certainly not’ to 4 ‘certainly yes’
0.88 2.49 (0.73) My direct manager helps me to complete the work
Support of
colleagues JCQ [7] 4 4-point scale ranging from 1 ‘certainly not’ to 4 ‘certainly yes’
0.87 2.78 (0.63) There is a feeling of unity among those I work with Outcome
WA WAI–Work Ability
Index [8] 7 These 7 items lead to a score between 7 and 49
0.76 33.93 (6.73) Let’s assume that your WA receives a score of 10 points at its best. What point score would you give your current WA?
Control variables
Job seniority – 1 Collected as a
continuous variable – 19.10 (12.50) Which is you job seniority as a preschool teacher? Occupation
type – 1 0 = kindergarten teacher (children aged 4–6); 1 = nursery teacher (infants aged 0–3)
– – Which is your profession?
BMI – 1 Collected as a continuous
variable – 22.90 (3.56) Please indicate your weigh and your height Depression PHQ-9–Patient Health
Questionnaire [9] 9 4-point scale ranging from 1 ‘never’ to 4 ‘almost every day’
0.79 1.66 (0.39) In the last 2 weeks, how often were you disturbed by each of the following problems? Feeling tired
Cognitive
demands JCQ [7] 3 4-point scale ranging from 1 ‘certainly not’ to 4 ‘certainly yes’
0.64 2.95 (0.59) My job is mentally demanding Physical
demands JCQ [7] 4 4-point scale ranging from 1 ‘certainly not’ to 4 ‘certainly yes’
0.79 2.92 (0.68) My work requires intense physical effort
I. SOTTIMANO ET AL.: WORK ABILITY IN PRESCHOOL TEACHERS 303
Therefore, the overall sample size was 706. Of these 58% were kindergarten teachers (teaching children aged 3–6) and 42% nursery teachers (children aged 0–3). All were females with an average job seniority of 19.1 years (SD = 12.6). Sixty-nine per cent reported a body mass index (BMI) in the normal range (18.5–25).
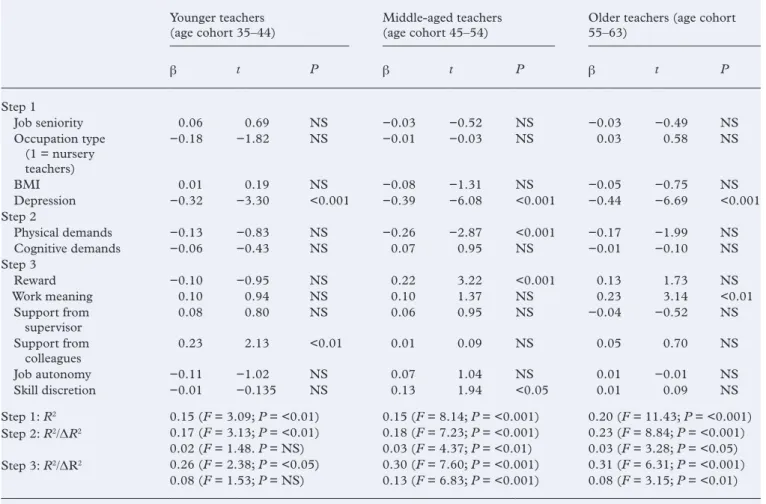
Table 2 presents the results of regression analyses to identify WA predictors in each age cohort. Background variables (job seniority, occupation type, BMI) and cognitive demands did not significantly affect WA in any of the age cohorts considered. Depression nega-tively predicted WA in all age cohorts. Moreover, β values suggested that as age increased, the relationship between depression and WA became stronger (35–44: β = −0.32, P < 0.001; 45–54: β = −0.39, P < 0.001; 55–63: β = −0.44, P < 0.001). The relationship between physical demands and WA was negative and significant among middle-aged teachers (β = −0.22, P < 0.001), but not among older and younger teachers. Among younger preschool teachers, as regards factors positively associ-ated with WA, only support from colleagues showed a significant value (β = 0.23, P < 0.01). For those mid-dle-aged, reward (β = 0.22, P < 0.001) and skill discre-tion (β = 0.13, P < 0.05) were significantly associated
with WA. Finally, among older workers, work meaning showed a significant value (β = 0.23, P < 0.001).
Discussion
Our study found that factors potentially protective of WA differed across age cohorts. Among younger preschool teachers, support from colleagues was positively associ-ated with WA. For those middle-aged and older, reward and skill discretion, and work meaning were, respectively, the most important predictors of WA. These findings are in accordance with previous studies which have found, among younger workers, the determinant role of social support and, among middle-aged workers, the role of opportunities for development in sustaining WA and job well-being [10]. On the other hand, few studies have focused on workers aged older than 55 and our study suggests that in this stage of working life, intrinsic aspects of the job (work meaning) may be more important than extrinsic aspects (e.g. reward and social support) in sustaining WA.
In contrast to other investigations, job seniority, occu-pation, BMI and cognitive demands were not negatively associated with WA for any of the age cohorts considered
Table 2. Hierarchical regressions to measure predictive factors of WA across age cohorts Younger teachers
(age cohort 35–44) Middle-aged teachers (age cohort 45–54) Older teachers (age cohort 55–63)
β t P β t P β t P Step 1 Job seniority 0.06 0.69 NS −0.03 −0.52 NS −0.03 −0.49 NS Occupation type (1 = nursery teachers) −0.18 −1.82 NS −0.01 −0.03 NS 0.03 0.58 NS BMI 0.01 0.19 NS −0.08 −1.31 NS −0.05 −0.75 NS Depression −0.32 −3.30 <0.001 −0.39 −6.08 <0.001 −0.44 −6.69 <0.001 Step 2 Physical demands −0.13 −0.83 NS −0.26 −2.87 <0.001 −0.17 −1.99 NS Cognitive demands −0.06 −0.43 NS 0.07 0.95 NS −0.01 −0.10 NS Step 3 Reward −0.10 −0.95 NS 0.22 3.22 <0.001 0.13 1.73 NS Work meaning 0.10 0.94 NS 0.10 1.37 NS 0.23 3.14 <0.01 Support from supervisor 0.08 0.80 NS 0.06 0.95 NS −0.04 −0.52 NS Support from colleagues 0.23 2.13 <0.01 0.01 0.09 NS 0.05 0.70 NS Job autonomy −0.11 −1.02 NS 0.07 1.04 NS 0.01 −0.01 NS Skill discretion −0.01 −0.135 NS 0.13 1.94 <0.05 0.01 0.09 NS Step 1: R2 0.15 (F = 3.09; P = <0.01) 0.15 (F = 8.14; P = <0.001) 0.20 (F = 11.43; P = <0.001) Step 2: R2/ΔR2 0.17 (F = 3.13; P = <0.01) 0.18 (F = 7.23; P = <0.001) 0.23 (F = 8.84; P = <0.001) 0.02 (F = 1.48. P = NS) 0.03 (F = 4.37; P = <0.01) 0.03 (F = 3.28; P = <0.05) Step 3: R2/ΔR2 0.26 (F = 2.38; P = <0.05) 0.30 (F = 7.60; P = <0.001) 0.31 (F = 6.31; P = <0.001) 0.08 (F = 1.53; P = NS) 0.13 (F = 6.83; P = <0.001) 0.08 (F = 3.15; P = <0.01) NS, non-significant.
304 OCCUPATIONAL MEDICINE
[3]. While physical demands did not significantly affect WA among teachers aged older than 55, they were a risk fac-tor for the age cohort 45–54. This counterintuitive finding may be explained by the healthy worker effect: with ageing the proportion of teachers retired or transferred to other services due to disabilities or poor health may increase [1] and paradoxically, the association between physical demands and WA may appear weaker among teachers aged older than 55. Depression is inversely associated with WA. Moreover, in accordance with previous studies, this relationship becomes stronger with increasing age [1].
The most important limitations of this study are its cross-sectional design, the use of self-reported measures and the lack of control for the effect of negative attitudes on WA. In practical terms, our findings suggest that to sustain WA effectively, interventions should be tailored to employees’ ages. Younger preschool teachers might benefit from mentoring support from other members of the workgroup, middle-aged teachers might benefit from programmes aimed at enhancing their professional growth (i.e. training or career opportunities) and older teachers might benefit from coordinating projects that could positively affect the community.
Funding
The present study was funded by the Municipality of Turin (Comune di Torino). Name of the project: ‘Qualità della vita organizzativa, promozione del benessere e con-trasto del disagio psicosociale: progettazione di una
ricerca-intervento con le educatrici/insegnanti del Settore Educativo del Comune di Torino’. Holder of the fund: D.C.
Conflicts of interest
None declared.References
1. Converso D, Viotti S, Sottimano I, Cascio V, Guidetti G. Capacità lavorativa, salute psico-fisica, burnout ed età, tra insegnanti d’infanzia ed educatori di asilo nido: uno studio trasversale. Med Lav 2015;106:91–108.
2. Tuomi K, Eskelinen L, Toikkanen J, Jarvinen E, Ilmarinen J, Klockars M. Work load and individual factors affect-ing work ability among agaffect-ing municipal employees. Scand
J Work Env Health 1991;17:128–134.
3. Mazloumi A, Rostamabadi A, Nasl Saraji G, Rahimi Foroushani A. Work Ability Index (WAI) and its associa-tion with psychosocial factors in one of the petrochemical industries in Iran. J Occup Health 2012;54:112–118. 4. Guglielmi D, Bruni I, Simbula S, Fraccaroli F, Depolo M.
What drives teachers engagement: a study of different age cohorts. Eur J Psychol Educ 2016;31:323–340.
5. Siegrist J, Starke D, Chandola T et al. The measurement of Effort-Reward Imbalance at work: European comparisons.
Soc Sci Med 2004;58:1483–1499.
6. Kristensen TS, Hannerz H, Høgh A, Borg V. The Copenhagen Psychosocial Questionnaire—a tool for the assessment and improvement of the psychosocial work envi-ronment. Scand J Work Environ Health 2005;31:438–449. 7. Karasek RA, Brisson C, Kawakami N, Houtman I, Bongers
P, Amick B. The Job Content Questionnaire (JCQ). An instrument for internationally comparative assessments for internationally comparative assessments of psychosocial job characteristics. J Occup Health Psychol 1998;3:322–355. 8. Tuomi K, Ilmarinen J, Jahkola A, Katajarinne L, Tulkki
A. Work Ability Index. 2nd edn. Helsinki, Finland: Finnish Institute of Occupational Health, 1998.
9. Kroenke K, Spitzer RL, Williams JB. The PHQ-9: validity of a brief depression severity measure. J Gen Intern Med 2001;16:606–613.
10. Viotti S, Guidetti G, Loera B, Martini M, Sottimano I, Converso D. Stress, Work Ability, and an Aging Workforce: a study among women aged 50 and over. Int J Stress
Manage 2016. Advance online publication. doi:10.1037/
str0000031.
Key points
•
Factors that appear to play a protective role in work ability varied across age groups in this study of preschool teachers in Italy.•
Among younger preschool teachers, support from colleagues was associated with higher work ability scores; while for those middle-aged and older, reward and skill discretion, and work meaning, respectively, were most strongly associated with greater work ability.•
Depression was negatively associated withwork ability in all age groups.