UNIVERSITY OF CAMERINO School of Advanced Studies
Doctorate course in
“LIFE AND HEALTH SCIENCES: ONE HEALTH” XXXI CYCLE
A scientific contribution towards
sustainable aquaculture
PhD Candidate: Scientific Tutor:
SUMMARY
The present PhD project has been made possible thanks to the support and collaboration of the major rainbow trout (Oncorhynchus mykiss, Walb.) farm in Europe. It was initially based on the original research proposal aimed at examining rainbow trout aquaculture in order to find alternative raw materials to be utilized in the formulation of feed for all the stages of breeding of this important salmonid. However, in 2017 the farm which funded the research project began rearing marine fish species in the Adriatic Sea and it was, therefore, decided to widen the scope of the study to include European gilthead sea bream (Sparus aurata, L.).
During the course of the PhD triennium various activities relating to the above two species were carried out. With regard to rainbow trout, the first of the tree main studies focused on the effects on broodstocks of a diet which included materials of vegetable origin; the second assessed the supplementation of an innovative emulsifier into the diet of juveniles to improve the assimilation of lipids; the last one examined the qualitative traits of by-products obtained by rainbow trout processing for their possible reutilization.
In particular, a trial was carried out employing 4-year-old broodstocks of rainbow trout – both females and males – fed on a diet which totally substituted fish meal with vegetable meal and partially substituted (50%) fish oil with linseed oil. The effects of this diet, compared to a control diet containing fish meal and fish oil, were evaluated in terms of reproductive performances: quality of eggs, hatching and fingerling survival rate and mean body weight. Based on the results of this trial, it was possible to assume that feedstuffs containing vegetable protein and fat administered to broodstocks, negatively affected the quality of gametes and the progeny of rainbow trout.
The second trial was performed in order to investigate the effects on the growth performance and feed conversion rate of diets supplemented, at two different doses, with
a new emulsifier aimed at increasing lipid assimilation in rainbow trout juveniles. After 90 days of experimental feeding, the overall results of rainbow trout fed on the supplemented diets, can be considered satisfactory and within the normal range for the species size. Concerning the histology of the intestinal tract, a lower degree of irritation was observed in the trout fed on the experimental diets compared to those fed on the diets without the additive. The emulsifier supplemented in the feeds, resulted in beneficial effects together with a better welfare status of the rainbow trout.
The research went on to consider the qualitative traits of by-products obtained by rainbow trout processing, including muscle meat and skin. This issue has become more pressing worldwide due to the ever-increasing amount of waste and wastewater. Recently, attention has been focused on the possibility of extracting precious nutrients from rendered fish proteins. In this study, the proximate composition and the fatty acid profile of rendered rainbow trout were evaluated and compared with the traits of the trimmed fillet. The results showed that rendered fish from rainbow trout processing still contains valuable nutrients, which could be successfully considered as possible feedstuff and also employed in various sectors and in innovative ways as, for example, in the production of finger food and fish burgers.
Concerning sea bream, our research assessed the effects on the growth of juveniles of a partial substitution of fish meal with insect meal in their diet. Furthermore, the possibility of eliminating the use of antibiotics in sea bream rearing was also examined.
In the last few years, insect meal has become one of the most studied sources of protein feedstuffs as an alternative to fish meal. A growing trial was performed in order to evaluate the efficacy of the inclusion of chironomid meal in the feed of gilthead sea bream juveniles. To this aim, samples of chironomid midges at larval stage were collected from aquatic environments, converted into meal and analysed from a qualitative point of view.
Two experimental feeds with a different percentage of replacement were tested and compared to a control diet where the chironomid meal was absent. The experimental diets resulted in excellent palatability and led to satisfactory growth performances.
The research also considered the possibility of rearing gilthead sea bream without the use of antibiotics. In recent years, the issue of antimicrobial resistance has become of prime importance at an international level. The possibility of rearing antibiotic free fish is the challenge we face in the twenty-first century. In this context, the company involved in this Eureka project, has decided to work towards the improvement of rearing techniques, biosafety and the management of environmental parameters, in order to reach high standards of animal welfare, from breeding to transportation and subsequent stages, in the hope that this will result in a successful battle against antibiotic-resistance. To this goal, a trial was performed monitoring the production cycle of gilthead sea bream that were farmed adopting an antibiotic free protocol in an offshore cage plant. Their growth performance, health status and flesh quality were then compared with conspecific wild fish. The antibiotic free sea bream were fed on a diet that contained not only raw materials of aquatic origin – which constituted the main source of essential fatty acids of the omega 3 series – but also those of vegetable origin, in full respect of environmental sustainability. There was a strong similarity between the morphometric parameters and somatic indices of the two fish groups of different origin. Moreover, the antibiotic free sea bream displayed a very low lipid fraction similar to that of the fish captured in the Adriatic Sea, which classified them in the category of lean fish. Data concerning the omega 3 content, demonstrated that the antibiotic free samples could be defined either as “Rich in omega-3”, or as an “Omega-3 source”.
i
Contents
SUMMARY
1. INTRODUCTION - ITALY IN THE INTERNATIONAL SCENARIO
OF AQUACULTURE
1
2. EFFECTS OF DIFFERENT FEEDS ON PERFORMANCES OF
RAINBOW TROUT (Oncorhynchus mykiss) BROODSTOCKS
13
2.1. Introduction
13
2.2. Materials and methods
14
2.3. Results
18
2.4. Discussion
19
3. RAINBOW TROUT (Oncorhynchus mykiss) GROWING TRIAL
USING DIETS WITH DIFFERENT ADDITIVE CONTENTS
21
3.1. Introduction
21
3.1.1. Aim of the study
25
3.2. Materials and methods
25
3.2.1. Growing trial
25
3.2.2. Feeding protocol
27
3.2.3. Feed analyses
28
3.2.4. Fish employed
29
3.2.5. Morpho-biometric parameters and indices
30
ii
3.2.7. Water quality
31
3.2.8. Statistical analysis
32
3.3. Results
32
3.4. Discussion
37
4. QUALITATIVE TRAITS OF BY-PRODUCTS OBTAINED BY
RAINBOW TROUT (Oncorhynchus mykiss) PROCESSING
39
4.1. Introduction
39
4.2. Materials and methods
40
4.3. Results
41
4.4. Discussion
43
5. GROWING TRIAL OF GILTHEAD SEA BREAM (Sparus aurata)
JUVENILES FED ON CHIRONOMID MEAL AS A PARTIAL
SUBSTITUTION FOR FISH MEAL
45
5.1. Introduction
45
5.1.1. Aim of the study
47
5.2. Materials and methods
47
5.2.1. Chironomid sampling, meal processing, feed preparation and chemical
analyses
47
5.2.2. Fish employed and growing trial
49
5.2.3. Morpho-biometric parameters and indices
50
5.2.4. Water quality
50
iii
5.3. Results
51
5.4. Discussion
57
6. AN ANTIBIOTIC FREE APPROACH IN GILTHEAD SEA BREAM
(Sparus aurata) PRODUCTION
61
6.1. Introduction
61
6.1.1. Aim of the study
64
6.2. Materials and methods
65
6.2.1. Description of cages and rearing technique
65
6.2.2. Fish employed and sampling
68
6.2.3. Morpho-biometric parameters and indices
69
6.2.4. Chemical composition and fatty acid profile of the fish fillet
69
6.2.5. Water quality
70
6.2.6. Statistical analysis70
6.3. Results
70
6.4. Discussion
73
7. CONCLUDING REMARKS
76
8. REFERENCES
81
ABBREVIATIONS AND ACRONYMS
96
LIST OF PUBLICATIONS DURING THE PhD TRIENNIUM
99
LIST OF SCIENTIFIC ACTIVITIES AND TRAINING DURING THE
1
1. INTRODUCTION
-ITALY IN THE INTERNATIONAL SCENARIO
OF AQUACULTURE
Total fish production peaked at about 171 million tons in 2016 of which 88 percent (over 151 million t) was utilized for direct human consumption thanks to relatively stable capture fisheries production, reduced wastage and aquaculture growth. In 2016, the greatest part of the 12 percent used for non-food purposes (about 20 million t), was reduced to fishmeal and fish oil (74 percent or 15 million t), while the rest was mainly utilized for direct feeding in aquaculture and for livestock and fur animals.
Global aquaculture production in 2016 was 110.2 million tons. With capture fishery production relatively static since the late 1980s, aquaculture has been responsible for the continuing impressive growth in the supply of fish for human consumption (Figure 1.1). In per capita terms, fish consumption has grown from 9.0 kg in 1961 to 20.2 kg in 2015, at an average rate of about 1.5 percent per year. Preliminary estimates for 2016 and 2017 point to further growth to about 20.3 and 20.5 kg, respectively (FAO, 2018).
2 Compared to other producer countries, the European Union (EU-28) covered 3% of the total world production of the catching and aquaculture in 2015, and ranked fourth after India (EUMOFA, 2017).
According to aquaculture production statistics published by the Federation of the European Aquaculture Producers (FEAP) in 2017, European fish farming production reached 2,297,571 tons in 2016. This figure was obtained considering the twenty-one major fish-producing countries, including Norway and Turkey. 70% of the total production is represented by marine coldwater species, 16% by freshwater species and 14% by marine Mediterranean species. The main ones are salmon, trout, sea bream, sea bass and carp which make up 95% of the total European production (Figures 1.2a – 1.2c).
Figures 1.2a – 1.2c: Marine cold water, freshwater and marine Mediterranean productions in 2016 per country and per species (Source: FEAP).
3 Italy is the seventh largest fish producer in the EU with an estimated total quantity for 2016 of 53,790 tons. This data refers not only to the three most important species produced by aquaculture techniques, such as rainbow trout (Oncorhynchus mykiss, Walb.), sea bream (Sparus aurata, L.) and sea bass (Dicentrarchus labrax, L.), but also to sturgeons (Acipenser spp.), common carp (Cyprinus carpio, L), European eel (Anguilla
Anguilla, L.) and meagre (Argyrosomus regius, Asso, 1801). Before Italy come Norway
(1,307,182 t), Turkey (247,754 t), Great Britain (178,887 t), Greece (108,959 t), the Faroe Islands (77,000 t) and Spain (64,754 t).
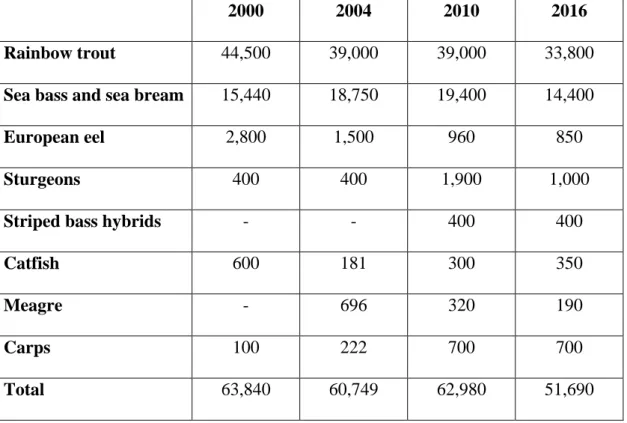
4 Over the last 15 years, Italian finfish production has suffered a decrease in the main freshwater fish species reared (trout, eel, carp, catfish) and recently the production of the eurhyaline species has also declined (Table 1.1).
Based on these considerations, the main features of fish aquaculture in Italy are discussed in this chapter, focalizing attention on the single sectors of farmed species and their trend for the future.
With regard to sea bream and sea bass, at the beginning of the 80s, the farming of eurhyaline species was very limited due to the problems at reproduction and larval phases. However, in the mid-80s these problems had been solved and Mediterranean hatcheries, including those in Italy, started to supply large quantities of good quality fry. This situation led to an increase in its own production up to about 120 million fingerlings in 1998 and 1999. Subsequently, juvenile production decreased for a few years and started to rise again in the following years. In 2016, the production of fingerlings was estimated at around 75 million gilthead sea bream and 26 million sea bass. From the 90s until the new millennium, Italian production of commercial size sea bream increased steadily. Due to the development of mariculture techniques, with floating cages in sheltered areas, the product coming from inshore and offshore facilities converted more than half of the total Italian production. Today Italian offshore fish farms are characterized by medium production capacities with individual production at around 800-1000 t/year. Apart from a few farms, most of the companies use medium-sized circular cages, of about 1000-2000 m3, equipped with polyethylene collars.
The offshore facilities are characterized by lower production costs compared with land-based farms, where energy and oxygen consumption negatively affect final costs. The offshore facilities further developed when cage technology was able to ensure a minor risk level and when 5-10 g fingerlings began to be available on the market. Moreover,
5 products from open-sea facilities show a higher growth rate and a better flesh quality compared with those reared at high loading rates (30-40 kg/m3) in land-based farms.
Table 1.1: Italian production (t) of major finfish species: 2000-2016. Data elaborated from FEAP.
2000 2004 2010 2016
Rainbow trout 44,500 39,000 39,000 33,800
Sea bass and sea bream 15,440 18,750 19,400 14,400
European eel 2,800 1,500 960 850
Sturgeons 400 400 1,900 1,000
Striped bass hybrids - - 400 400
Catfish 600 181 300 350
Meagre - 696 320 190
Carps 100 222 700 700
Total 63,840 60,749 62,980 51,690
Current Italian production of sea bass and sea bream is stagnant and unable to compete with other Mediterranean producers. It ranks fourth after Turkey (72,342 t sea bass and 67,612 t sea bream), Greece (46,000 t sea bass and 59,000 t sea bream) and Spain (23,445 sea bass and 13,740 t sea bream) (FEAP, 2017). After the economic crisis of recent years, Greece ranks second, whereas Tukey has the dominant role and has undertaken to restructure its plants. At the same time, Spanish production is growing far more than that of Italy.
The strong competition, due to the importation of small size fish (B = 200-300 g), has induced many companies to diversify the commercial size, resulting in an appreciation
6 for the intermediate (A = 300-400 g; AA = 400-600 g) and large categories (AAA = 600-800 g; G or E > 600-800 g).
On the other hand, with regard to fish consumption, our country is the first in the Mediterranean area and needs to import over 50,000 tons of sea bass and sea bream annually particularly from Greece and Turkey (FAO, 2018). Therefore, Italian companies have had to begin to take into account the need for improvement of the quality of the product, with particular attention to feeding management and to the fishing and slaughtering processes.
Unfortunately, national policies for species diversification were unable to offer new opportunities to farmers, so the production of “new species” is still extremely low. The transfer of the coordination of the research programmes from a national to a regional level has led to numerous small projects that were unable to guarantee continuity in research activities and has very often resulted in the repetition of the same experimentations. For some species like meagre (Argyrosomus regius), unknown to the Italian market until a few years ago, the demand has been increasing, especially in Tuscany. For other species, mainly flatfish and Sparidae such as red porgy (Pagrus pagrus, L.) or blackspot sea bream (Pagellus bogaraveo, Brünnich, 1768), the quality and quantity of the fry are insufficient to sustain industrial productions. For sharpsnout sea bream (Diplodus puntazzo, Walb.) production is limited by the presence of parasitic pathogens.
The only partly successful activity involving a new species, is the fattening in large open sea cages of tuna (Thunnus thynnus, L.) caught as adult, but such an activity has low sustainability both for frozen mackerel, pilchard, herring and bogue used as feed, and for its impact due to the use of young tuna coming from the wild.
As regards rainbow trout (Oncorhynchus mykiss), it is the major fish species reared in Italy. In 2016, the national production of portion-size trout (350 g) amounted to 33,800
7 tons (FEAP, 2017). Italy was a leading producer in Europe until the late 90s with over 51,000 tons in 1997 (Melotti and Roncarati, 2009). Subsequently, difficulties due to the significant competitiveness of the Atlantic salmon market, together with the scandal of Belgium dioxin, the incidence of transmissible spongiform encephalopathies (TSEs) and the forbidden use of terrestrial animal origin meals in the feeds (2001) have led to an increase in production costs and a reduction in produce to 39,600 tons in 2005 and 2006. Efforts by farmers to defend the image of trout as rich in beneficial properties resulted fruitless.
Following this, a general awareness of the importance of the traceability and labelling of trout products has grown in agreement with the Codex Alimentarius (FAO/WHO, 2003), the guidelines of the Italian Association of Fish Farmers (API, 2003) and the FEAP code of conduct (FEAP, 2000).
In order to support farmers, two steps have been taken: the reduction of economic costs and the analysis of consumer demand. Concerning the first aspect, the most important feed manufacturers have introduced certain substitutes for fish meal and fish oil in trout feed as cheaper protein and lipid sources in order to reduce feed costs and enhance the sustainability of trout aquaculture (Kaushik et al., 1995; Romarheim et al., 2006). As far as the second step is concerned, surveys carried out in different European countries ascertained that in Italy rainbow trout is perceived as a traditional product with over two thirds of the production being consumed as whole fish (Cookson, 2002).
Nowadays, farmers are adapting trout product to market demand and are supplying the hypermarkets and chain stores and the results appear satisfying. Therefore, size differentiation, packaging and product processing (e.g. smoked trout or gastronomic preparations of the fillet) seem to play an important role in meeting the needs and attitudes of the modern consumer. Furthermore, the red-pink flesh coloration, caused by the
8 deposition in the muscle of relatively large amounts of carotenoids obtained from the diet, such as astaxanthin, is becoming decisive for the diversification of the product. In this case, the fattening productive cycle lasts 3 months more and the final size is around 500 g.
Unfortunately, future trends in the sector indicate that saturation point has been reached, and rainbow trout production remains at 33,800 tons (FEAP, 2017). The trout culture will be forced to work on reducing the environmental impact, acquiring improved efficiency in management and controlling pathologies in order to obtain a high-quality product. In addition, the prospects are not good for the production of rainbow trout for sport fishing due to fact that these fish can only be introduced in private waters. However, 13,000 tons are destined for recreational ponds and artificial reservoirs for fishing competitions. An interesting opportunity could be offered by the rearing of other salmonid species such as brown trout (Salmo trutta morpha fario, L.) and brook trout (Salvelinus fontinalis, Mitchill, 1814), which are appreciated both for sport fishing and for the quality of the meat. In Tuscany, operators are working to create a local brand called “trota dell’Appennino”, in order to qualify their product.
As regards eel, the European aquaculture production depended and depends on juveniles (“ragani”), glass eels and elvers. Their availability, formerly used for human consumption or for stocking rivers, has declined markedly; the number of juveniles coming from the Atlantic has steadily fallen and stands now at around 5% of the average level in the 1970s (EIFAC/ICES, 2006).
Moreover, the availability of young eels for aquaculture purposes has shown a significant reduction, resulting in a very high increase in prices. In the 90s, Italian production of eel was estimated at around 4,000 tons. At that time, farming techniques had been greatly improved and feed formulations were satisfactory (Roncarati et al., 1998). However, due
9 to the increasing cost of seeding, the profit margins of intensive farms fell and productions progressively decreased to 850 tons in 2016. This reduction in production was also recorded in other European countries, such as Denmark, whose eel production fell from 3,700 tons in 2008 to 2,885 in 2016.
Considering the decline in catches, eel is now listed in the European Habitats Directive as a species of Community interest and the fishing and exploitation of eel in the wild may be subject to management measures. Besides, the European Commission (EC) has instituted an Eel Recovery Programme, as suggested by the ICES declaration of 1998, which reported that the European eel stocks need protection and the current fishery is not sustainable anymore (EIFAC/ICES, 2006).
Prospects for the eel sector are considered very limited, not only for the scarce availability of seeding, but also due to the demand, which shows a marked decline. In fact, in the last few years, eel farming has suffered a steady decline due to the increase in the price of “ragani” and elvers and a reduction in demand from Germany and the Netherlands, which produce eels themselves or buy them from Denmark. Considered as a whole, the European production of eel has decreased as a consequence of the increase in production costs and the rise in price of the smoked eel.
Only product coming from brackish waters seems to be attractive to the market. This is the case of eels from Valli di Comacchio, located in the province of Ferrara and spreading over 10,800 ha; Valli di Comacchio is known for being the most important area for the production of both fresh and processed eel (Cecchini, 2001).
Unfortunately, environmental modifications of the area and the strong reduction in the migration of elvers from the sea (“montata”) has brought about the closure of the marinated plant. In 2004, the building of the old “Azienda Valli Comunali di Comacchio” was completely restructured in order to process eel products following the ancient
10 traditional techniques dating back to 1818 (“Fabbrica Normale” of Body Administration of Comacchio). The recent institution of the Delta Park of the river Po, in which Valli di Comacchio is located, can help promote the marinated eel of Comacchio and, in general, may be an important tool in qualifying the species.
As an alternative fish to eels, some plants have attempted to rear hybrid striped bass (Morone saxatilis x Morone chrysops), which originates from the United States; currently, there have been favourable results, with production exceeding 400 t/year. The larval phase is carried out in hatcheries applying techniques derived from those of sea bass and sea bream. On-growing takes place in outdoor basins, where the hybrid striped bass are cultured for 16-18 months to a large marketable size (800-900 g). They are sold as whole fish to chains of supermarkets that promote this product especially when sea bass and sea bream are not available or not convenient. The Italian Ministry of Agriculture has recognised the importance of this fish, having included in the updated list of commercialized fish products, assigning “persico-spigola” as its common name (DM 31 January 2008 – Denominazione in lingua italiana delle specie ittiche di interesse commerciale).
Another Italian aquaculture sector is represented by sturgeon farming which topped 1,000 tons in 2016 (FEAP, 2017). In recent years, sturgeon farming has obtained a high economic return orienting the culture to caviar production. One of the most important species reared for roe is the white sturgeon (Acipenser transmontanus, Richardson, 1836), since on intensive farms it grows and matures faster than in the wild (Doroshov et al., 2005). In Italy, three companies are specialized in this sector. After determining the gender at 3 years old, they sell the males for meat and rear the females to maturity. The majority of white sturgeon females mature at 7-9 years old at a live weight of 30-40 kg and produce approximately 3-4 kg of roe (weight considered before salting for caviar).
11 The Italian production of caviar amounts to 21 t/year. Unfortunately, the synchronization of ovarian maturation and the prevention of disease transmission are still crucial factors that may reduce productivity. In this situation, future trends are not encouraging because the long maturation of sturgeons makes it more difficult to attract investors for such business.
With regard to catfish, until 1990 production was well consolidated with over 3,000 t/year, especially in Emilia Romagna, Lombardia and Veneto, where the common catfish (Ictalurus melas, Rafinesque, 1820) had a tradition as food supply and sport fishing. Since 1994, a drastic and progressive reduction took place plummeting to 350 tons in 2016. This fall was brought about by a herpesvirus first isolated in two catfish farms in 1994. After that, mass mortalities were recorded in the largest Italian plants and most of these were forced to give up farming common catfish (Melotti et al., 1999). Nowadays, this pathogen is still particularly dangerous, since vaccines are unavailable and, furthermore, channel catfish (Ictalurus punctatus, Rafinesque, 1818) cannot be reared as a substitute since it is not appreciated by the Italian market.
Regarding Cyprinids, the common carp (Cyprinus carpio), produced in the past for recreational fishery, has declined to almost zero tons over the last few years due to the strong competition from Eastern European countries, such as Hungary and Croatia (the main exporters to Italy), making it difficult for Italian farmers to stay in the market. Concerning the prospects for the carp, a possible way to sustain the field could be the diversification of the species, taking into consideration Chinese carps or the common tench (Tinca tinca, L.). The latter seem to play an important role in valorising local production like, for example, the “Tinca gobba dorata del Pianalto di Poirino” in the region of Piemonte.
12 With regard to other cyprinids raised in Italy, goldfish (Carassius auratus, L.) are produced for ornamental purposes providing about 20 million specimens per year, but this practise is a restricted business. The plants were the goldfish are reared, are often involved in koi carp production, estimated at around 3 million specimens in 2006. Recently, a viral disease (KHV) has compromised its expansion causing high mortality rates in several countries worldwide (EU, United States and Asia) (Ronen et al., 2003). Thus, every international trading and shipment operation of koi stocks requires health condition certifications, which prove very expensive for the Italian farmers.
In recent years, European and Italian aquaculture has shown a markedly different trend from world aquatic production. Asia, and particularly China, has recorded a constant and rapid growth and Latin America has also had a moderate development.
In our continent, Norway has registered a very strong increase in salmon and large size rainbow trout production. For the former species, Norway represents the world leader, whereas it is the main continental producer of trout. This situation has had negative consequences on the production of Salmonids by countries traditionally involved in trout farming (France, Italy, Denmark), which, due to the fierce Norwegian competition, have been obliged to reduce their production.
The Italian situation has become critical since the steps taken in order to diversify the product have not been sufficient to relaunch the Italian trout onto the market.
Italian production of marine fish species (sea bass and sea bream) faces a very similar situation to the trout sector. Greece and Turkey sell their product almost exclusively on the Italian market at prices that are cheaper compared to that of our national product. Therefore, the market available to the Italian farmers is being eroded. Consequently, our producers can only count on the better quality of the Italian product.
13
2. EFFECTS OF DIFFERENT FEEDS ON PERFORMANCES OF
RAINBOW TROUT (Oncorhynchus mykiss) BROODSTOCKS
2.1. Introduction
In aquaculture, the feeding of broodstocks plays a key-role because it affects the quality of the gametes, their fecundity, hatching rate, fry survival and incidence of larval deformation, regardless of genetic selection and the strain employed (Bromage et al., 1990; Migaud et al., 2013). In recent years, the research of feedstuffs alternative to fish meal, in order to increase the sustainability of the productive cycle, has also been focalized on the feeding of rainbow trout (Oncorhynchus mykiss) broodstocks (Kaushik and Seiliez, 2010; Kwasek et al., 2014). Efforts are being concentrated on new diets able to guarantee health benefits, satisfying the essential requirements of females and males, as well as a good quality of gametes, larvae and fingerlings.
The feeding plan for broodstocks can significantly affect the yolk sac reserves of the eggs, as well as the larval development and survival rate (Fernández-Palacios et al., 2011) and innovative feeding strategies have been adopted, which also include new plant feedstuffs. Considering the response of several metabolism-related and growth-related genes and proteins in trout subjected to different dietary methionine levels (deficient or adequate), it was shown that the diet of the broodstocks can influence the metabolism of the progeny in rainbow trout (Seiliez et al., 2017).
Based on these assumptions, a trial was carried out employing 4-year-old broodstocks of rainbow trout in order to evaluate the effects of two feeds containing feedstuffs of different protein and lipid source on reproductive performances in terms of the quality of eggs, hatching and fingerling survival rate and mean body weight.
14
2.2. Materials and methods
Four months prior to the spawning season, broodstocks were selected and divided into two experimental groups, with two replicates each (GF1-GF2, GV1-GV2), represented by two raceway sectors (10 m x 1 m x 1 m). Each group contained 20 females/replicate, whereas 10 males/group were reared in two other raceway sectors. Groups GF (females and males) were fed a diet containing fish meal and fish oil as control feed. Groups GV (females and males) received a diet including legume protein feedstuffs and oil of vegetable origin (50% linseed oil and of 50% fish oil). The ingredients of the two feeds are reported in Table 2.1. GF, GV broodstocks were fed at a daily ratio of 0.8% body weight for 120 days until the spawning season. The water temperature, dissolved oxygen and pH were periodically recorded. The proximate composition and amino acid and fatty acid profile of the two feeds were analysed according to international methods (Tables 2.2 – 2.4).
Table 2.1: Ingredients (g/kg) of the two feeds for GF and GV broodstocks.
Ingredients (g/Kg) GF GV Fish meal (65% - anchovy) 340 Gluten corn meal 290 290 Wheat meal (12 CP) 280 5 Pea meal 200 Gluten (wheat) 100 Soybean meal 195 Peanut meal 100 Fish oil 80 50 Linseed oil 50 Lecithin - Soy (70%) 5 5 Vitamin C 1 1 Mineral-vitamin premix 4 4
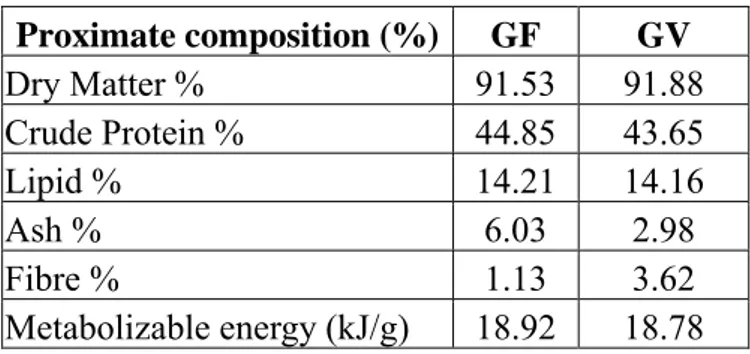
15 Table 2.2: Proximate composition (%) of the two
feeds for GF and GV broodstocks.
Proximate composition (%) GF GV Dry Matter % 91.53 91.88 Crude Protein % 44.85 43.65 Lipid % 14.21 14.16 Ash % 6.03 2.98 Fibre % 1.13 3.62 Metabolizable energy (kJ/g) 18.92 18.78
Table 2.3: Amino acid profile (%) of the two feeds for GF and GV broodstocks.
Amino acid profile (%) GF GV
Arginine% 2.09 2.26 Histidine% 0.99 0.86 Isoleucine% 2.08 1.80 Leucine% 5.46 5.70 Lysine% 2.19 1.26 Methionine% 1.21 0.68 Phenylalanine% 2.37 2.44 Threonine% 1.73 1.43 Tryptophan% 0.58 0.22 Valine% 2.31 1.98 Ca% 1.52 0.14 Available P% 1.20 0.13
Table 2.4: Fatty acid profile (%) of the two feeds for GF and GV broodstocks.
Fatty acid profile (%) GF GV LA (18:2n-6)% 5.51 26.2 LNA (18:3n-3)% 10.23 6.4 ARA (20:4n-6)% 0.59 0.83 EPA (20:5n-3)% 7.43 3.82 DHA (22:6n-3)% 4.96 2.49 Total n-3% 22.62 12.71 Total n-6% 6.1 27.03 n3:n6 3.71 0.47 Total phospholipids% 7.62 3.53
16 At the beginning of November, the females of the two groups were checked and 4 females/replicate/group were isolated in 2m3 tanks, anesthetized and stripped. After stripping, the fish were weighed. The eggs were removed from each mature female by hand-pressure on the abdominal wall (Figure 2.1) and separately dry-fertilized in a plastic bowl with 2.5 ml of sperm per litre of eggs, obtained from a pool of 5 males. 2-3 minutes after fertilization, the eggs were washed 3-4 times and transferred into trays with running water supplied from a natural spring (10.0 ± 0.5°C), maintaining in separated trays the eggs obtained from the different females (GF, GV). Water exchange ranged from half an hour to 1 hour and 45 minutes in each tray. The hatching rate was recorded on the viable eggs.
17 GF and GV larvae and fingerlings of the different groups were monitored daily over 90 days starting from the yolk sac resorption. The stocking density was 5,000 larvae/tray.
Figure 2.2: Rainbow trout eggs and larvae.
The size and the proximate composition of the feed administered to fingerlings of the two groups are reported in Table 2.5.
Table 2.5: Size (mm) and proximate composition (%) of the feed administered to fingerlings of the two groups.
Size (mm) 0.3 1.0
Moisture (%) 14.7
Crude protein (%) 57
Lipid (%) 17
18 The survival rate and mean body weight of the two groups were updated weekly. Data were submitted to one-way ANOVA and the differences between the means were evaluated using the Student-Newman-Keuls (SNK) test (SAS, 2004) and considered significant at p < 0.01.
2.3. Results
Gamete and fingerling data differed among the batches, showing a significantly higher performance with regard to the quality of viable eggs in groups GF compared to groups GV. The hatching rate of GF was 92±2% versus 71±3% of GV (Table 2.6). The mean body weight of fingerlings at the end of the trial was 4.49 g for the GV and 5.56 g for the GF group (Figure 2.3). The survival rate of fingerlings at 90 days also showed notable differences being 74±4% versus 49±3% in GF and GV groups, respectively (Figure 2.4).
Table 2.6: Reproductive performances of the two groups of broodstock females.
GF GV
Mean body weight (g) 1842 ± 190 1737 ± 148 Mean weight egg (g) 0.053 ± 0.002 0.048 ± 0.003 Total eggs/female (n.) 2467 ± 155 2239 ± 174 Egg diameter (mm) 4.2 ± 0.1 3.9 ± 0.2 Hatching rate (%)* 92.2 ± 2a 71 ± 3b
*Hatching rate was calculated on incubated eggs
Data are expressed as mean ± sd. Different superscripts (a, b) in the same row indicate significant differences between the fish groups (p < 0.01).
19 Figure 2.3: Mean body weight (g) of fingerlings during the 90-day trial.
Fig. 2.4: Survival rate (%) of fingerlings during the 90-day trial.
2.4. Discussion
The present trial evaluated the effects of the total substitution of fish meal and the partial replacement of fish oil in broodstock feeds (GV) on the reproductive performances of rainbow trout. The substitution of fish meal and fish oil with vegetable sources in aquaculture feeds is an important step in preserving wild fish stocks (clupeids) and reducing feeding costs. The group of females fed on GV feed exhibited significantly
0,00 1,00 2,00 3,00 4,00 5,00 6,00 Week 1 Week 2 Week 3 Week 4 Week 5 Week 6 Week 7 Week 8 Week 9 Week 10 Week 11 Week 12 Week 13 GF GV g A B A B A B A B A B A B A B A B 0 10 20 30 40 50 60 70 80 90 100 Week 1 Week 2 Week 3 Week 4 Week 5 Week 6 Week 7 Week 8 Week 9 Week 10 Week 11 Week 12 Week 13 GF GV % A B
20 lower reproductive performances than broodstocks fed on the GF diet in terms of hatching rate, fingerling body weight and survival at 90 days (Table 2.6, Figures 2.3 and 2.4). GF group results, in terms of eggs quality (egg diameter, egg weight, hatching rate), agreed with those reported in literature (Bobe and Labbé, 2010). In the GV feed, some amino acids (Lysine, Methionine, Tryptophan), minerals (Ca, P) and n-3 highly unsaturated fatty acids (HUFA) were imbalanced, whereas the GF feed showed a better amino acid profile and a higher percentage of eicosapentanoic acid (EPA) and decosahexanoic acid (DHA). The low amino acid content, particularly in methionine, may have affected the survival and mean body weight of fingerlings, as reported in recent papers (Fontagné-Dicharry et al., 2017; Seiliez et al., 2017). The fatty acid low content may have affected the egg diameter and hatching rate,although in the GV feed a higher n3/n6 HUFA ratio was used with respect to some other studies. Results reported in literature show that at least 1.1% n-3 HUFA dietary content is necessary to obtain good reproductive performances (Vassallo-Agius et al., 2001; Bransden et al., 2005).
These variations could be due to differences in feedstuffs: in the GV diet the fish meal was totally replaced by meal obtained from different legumes, and 50% of the fish oil was substituted by linseed oil, with consequent differences in the content of the essential nutrients.
Based on the results of this trial, it was possible to assume that feedstuffs containing vegetable protein and fat administered to broodstocks, affected the quality of gametes and the progeny of rainbow trout negatively.
21
3. RAINBOW TROUT (Oncorhynchus mykiss) GROWING TRIAL USING
DIETS WITH DIFFERENT ADDITIVE CONTENTS
3.1. Introduction
The rising interest in fish welfare, sustainability and health management has focalized the attention of research on fish feeding based on feedstuffs alternative to fish meal and fish oil, in order to preserve wild fish stocks (clupeids) and reduce the cost of formulated diets (Matos et al., 2016). These issues are always connected with the production of trout rich in long chain n-3 polyunsaturated fatty acids (PUFA), since they are beneficial to cardiovascular health.
Nowadays, terrestrial plant-based feedstuffs (soybean, wheat, pea, corn, etc.) are increasingly used as substitutes in feeds for salmonids. Studies conducted on diets containing low rates of fish meal and high levels of plant protein sources, have shown lower growth performance in rainbow trout, mainly linked to reduced feed intake and antinutritional factors (Bell et al., 2003; Pierce et al., 2008). Furthermore, in the feeding of rainbow trout broodstocks, the total substitution of fish meal and the partial replacement of fish oil in feeds with vegetable sources (soybean and pea meals) negatively affect the reproductive performances of rainbow trout in terms of egg quality (egg diameter, egg weight, hatching rate), fingerling body weight and survival rate at 90 days (Bobe and Labbé, 2010; Meligrana et al., 2017). In addition, the vegetable sources affect the quality of the lipid content of the fish meat due to the lower rate of PUFAs, compared to fish fed on oil from aquatic origin (Roncarati et al., 2010; Matos et al., 2016). However, thanks to the high availability, low costs and the decreased presence of dioxins and pollutants, the replacement of fish oil with vegetable oils appears to be a sustainable prospect.
22 The most important obstacle to the substitution of fish oil with other sources, is represented by the need to maintain a balanced supply of essential fatty acids and an optimal health status. The change in the lipid origin and fatty acid composition in the diet may alter the haematology, metabolism, physiology and immunology of the fish, which, in turn, could affect fish health and resistance to stress and disease (Turchini et al., 2009; Oliva-Teles, 2012). The high percentage of inclusion of vegetable oils in the diets has been associated with lipid droplet accumulation in the intestinal tissue of fish (Caballero et al., 2002).
Phospholipids are surface-active substances and can therefore be used in a wide variety of ways: as an emulsifier, absorption enhancer, dispersion agent and wetting agent. Phospholipids play an important role in animal nutrition as emulsifying agents, and assist in the digestion of fat. They also help in fatty acid absorption by the formation of micelle structures.
The beneficial effects of dietary phospholipids in fish include improved growth in both larvae and early juveniles, increased survival rates and decreased incidence of malformation in larvae, and even increased stress resistance (Fontagné et al., 1998). In fish species, juveniles receiving diets including phospholipids show enhanced growth, high survival rates and stress resistance; in larval fish stages, a reduction of the incidence of morphological alterations has been shown (Cahu et al., 2003; Wold et al., 2007). In the grow-out phase, phospholipids are necessary as emulsifiers in the formation of mixed micelles in the digestive tract (Olsen and Ringø, 1997) and appear to be crucial for lipid transport (Fontagné et al., 1998; Caballero et al., 2006).
A specific class of phospholipids, the lysophospholipids (LPL) are of particular interest in the absorption of nutrients as they are more hydrophilic than other phospholipids. For animals to utilize fat, they have to digest and absorb it from the gastro-intestinal tract.
23 Since fat is insoluble in water and difficult to handle in a water medium, as in the gastrointestinal tract, water-insoluble ingredients like fatty acids, fat–soluble vitamins and certain amino acids rely on emulsification to become water soluble and thus, bioavailable.
LPLs spontaneously form micelles with bile salts, fatty acids and monoglycerides. These micelles are smaller and more stable than those formed with other phospholipids found in, for example, lecithins.
The LPLs are simple phospholipids that have been recognized for decades as components in the biosynthesis of cell membranes. LPL refers to any phospholipid that is missing one of its two O-acyl chains (Figure 3.1). Thus, LPLs have a free alcohol in either the sn-1 or sn-2 position. The LPLs are recognized as important extracellular signalling molecules and lipid mediators. LPLs aid digestion of other lipids, by breaking up fat globules into small micelles.
Lysophosphatidic acid (LPA; receptors LPA1– LPA4) (Figure 3.2) and sphingosine 1-phosphate (S1P; receptors S1P1 – S1P5) have enabled a greater mechanistic understanding of their diverse roles in biological processes. LPA and S1P regulate the development and function of numerous organ systems, including the cardiovascular, nervous, immune, and reproductive systems. Altered LPA signalling has been implicated in the aetiology of disorders, such as inflammation, autoimmune diseases, neuropathic pain, atherosclerosis, cancer and obesity (Ishii et al., 2004).
24 Figure 3.1: Biosynthesis of lysophospholipids.
LPLs modify the fluidity of membranes as a membrane transducer to accelerate diffusion through the cell lipids (Lundbaek and Andersen, 1994).
In pigs, fed on a diet including LPLs during the growing phase, a greater digestibility of nutrients as a consequence of the high rate of emulsification was observed (Kim et al., 2018). However, an increase in the bile salt micelle capacity and the interior capacity of micelles in the intestine to increase long-chain saturated fatty acid solubilisation in the presence of phospholipids, may have also contributed to this effect (Reynier et al., 1985).
25 With regard to the possibility of providing potential health benefits while satisfying nutritional requirements of the cultured species, the supplementation of functional nutrients is recommended as a promising strategy in order to sustain the growth and the welfare status of the fish.
3.1.1. Aim of the study
A leading company in the ingredient manufacturing industry set out to test a new emulsifier with the aim of optimizing the three steps in lipid digestion (emulsification, hydrolysis with micelle formation and adsorption) in animal species of zootechnical interest.
In the present study, a growing trial investigated the effect of this new emulsifier supplemented into the diet at two different doses, on the growth performances and feed conversion of rainbow trout during the pre-growing phase.
3.2. Materials and methods
3.2.1. Growing trialThe trial was performed at a hatchery located in Colli sul Velino (RI), 100 km from Camerino University (UNICAM), School of Biosciences and Veterinary Medicine. The hatchery was rented from the foremost European company of rainbow trout aquaculture (Eredi Rossi Group with headquarter in Sefro, Macerata) according to an agreement between the ingredient manufacturing company and UNICAM, in which the fish farms of Eredi Rossi Group were involved. Some of the tanks of the Colli sul Velino farm were utilized to carrying out the trial for the manufacturing company.
26 Figure 3.3: Tanks employed for the trial.
The trial began on 20April 2018 and lasted until 20 July 2018. The acclimation phase to the new diets lasted 6 days.
For the trial, we employed 12 tanks (3 tanks per group) (length 5.65 m; width 0.77 m; depth 0.50 m) of 2.20 m3 volume each. During the first week of May, all the tanks were covered with an antifouling net in order to avoid algal development and to keep away ichthyophagous birds.
27 Figure 3.4: Net covering the tanks used for the trial.
3.2.2. Feeding protocol
The test additive emulsifier was supplied by the manufacturing company in a ready-to-use powder form. The test product was ready-to-used at doses of 0.05 and 0.075 of complete feed. For the aim of the study, 4 groups with 3 replicates each, were considered:
1) Positive Control (normal energetic level)
2) Negative Control (Positive Control without a fraction of energy added) 3) Negative Control plus additive at 500 ppm
4) Negative Control plus additive at 750 ppm
The Positive Control, Diet 1, was formulated in accordance with the person in charge of the nutrition line of Eredi Rossi Group in order to obtain a feed similar to the diet employed for rainbow trout juveniles of Eredi Rossi Fish Company.
28 The feeds were manufactured at the feed mill of Eredi Rossi Company located in Cassolnovo, via del Porto 26, province of Pavia, which is dedicated to the production of feeds for all the rainbow trout lines and products (pink and white rainbow trout). Feedstuffs to be included in the feeding plan were provided by Eredi Rossi Group. The ingredients, chemical composition and amino acid content of the experimental diets are reported in Table 3.1.
In the feed mill plant of Eredi Rossi Group, a line of extruders dedicated to the preparation of the experimental diets was used. We planned to use it on a Saturday, in order to give the mill Company time to clean all the equipment and to remove the residuals of other feeds at the end of the working day on the Friday before.
All the ingredients were mixed according to the target formulation. The extrusion process was performed in order to optimize the inclusion of the emulsifier. The feeds were 4.5 mm in size. After the coating, the four diets were stocked in buckets and maintained in an aerated room. Samples of each diet were taken for proximate composition analysis. The feeds were transported to the trout farm and subsequently the growth trial was performed.
3.2.3. Feed analyses
Proximate analyses were conducted using standard methods for both the test diets. Moisture analyses were performed by drying the samples to a constant weight at 105 °C for 24 h in an oven; crude protein was analysed utilizing the Kjeldahl method and crude ash was also analysed by incineration at 525 °C in a muffle furnace for 12 h (AOAC, 1990). Methanol/chloroform extraction method (Folch et al., 1957) was used to analyse crude fat levels of the samples.
29 Table 3.1: Ingredients, amino acid content and proximate composition of the experimental diets (%). Diet 1 Positive Control Diet 2 Negative Control Diet 3 NC + Emulsifier 500 Diet 4 NC + Emulsifier 750 Herring meal 70% 31.200 31.200 31.200 31.200 Chicken meal 70% 10.000 10.000 10.000 10.000 Wheat gluten 6.000 6.000 6.000 6.000 Soybean meal 48% 15.000 15.000 15.000 15.000 Decorticated pea 10.000 10.000 10.000 10.000 Wheat meal 8.700 9.700 9.650 9.625 Fish oil 12.000 11.000 11.000 11.00 Soybean oil 4.300 4.300 4.300 4.300 Lysine 0.400 0.400 0.400 0.400 Methionine 0.100 0.100 0.100 0.100 Monosodium Phosphate 0.400 0.400 0.400 0.400 Vitamin Premix 1.500 1.500 1.500 1.500 Choline (liquid, 75%) 0.400 0.400 0.400 0.400 Emulsifier 0.000 0.000 0.050 0.075 Proximate composition Dry matter (%) 94.5 ± 0.0 94.5 ± 0.0 94.5 ± 0.1 94.5 ± 0.1 Crude protein (%) 47.4 ± 0.0 47.4 ± 0.0 47.4 ± 0.0 47.4 ± 0.0 Crude lipid (%) 22.20 ± 0.1 21.10 ± 0.1 20.81 ± 0.0 20.80 ± 0.1 Crude fibre (%) 1.4 ± 0.0 1.4 ± 0.0 1.4 ± 0.0 1.4 ± 0.0 Crude ash (%) 8.9 ± 0.0 8.9 ± 0.0 8.9 ± 0.0 8.9 ± 0.0 Calcium (%) 1.6 ± 0.0 1.6 ± 0.0 1.6 ± 0.0 1.6 ± 0.0 Phosphorus (%) 1.2 ± 0.0 1.2 ± 0.0 1.2 ± 0.0 1.2 ± 0.0 Metabolizable energy (MJ/kg) 18.40 ± 0.0 18.00 ± 0.1 18.27 ± 0.0 18.26 ± 0.0 3.2.4. Fish employed
For the trial, we employed 6,000 rainbow trout supplied by the Eredi Rossi Group hatchery, which came from the pre-growing sector where they were reared.
The initial mean weight of the rainbow trout was 47.8±3 g.
The fish were stocked in 12 tanks (3 tanks per diet group) at 4.93 kg/m3. The diets were administered by hand twice a day, 6 days per week, and the quantity of the daily ratio was recorded.
30
3.2.5. Morpho-biometric parameters and indices
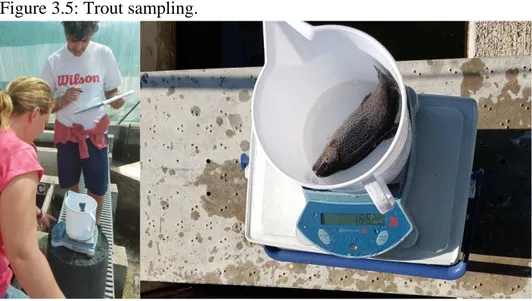
The mean body weight of the trout was calculated every month in order to update the daily ratio, weighing 100 fish/tank/each group of diet.
Figure 3.5: Trout sampling.
At the end of the trial, the fish were weighed (Ohaus Adventurer SL Precision Balance, Mod: AS8100) and the following zootechnical parameters were determined:
- Mean body weight (g) - Total length (cm)
- Weight gain (%) = (final weight−initial weight)×100∕initial weight,
- Specific growth rate (SGR, %∕day) = {Ln (final weight)−Ln (initial weight)∕duration}×100
- Feed conversion rate (FCR) = live weight gain (g)/feed administered (g) - Survival rate (%) = final number of fish/initial number of fish*100
The following indices were also determined: condition index (KI) = (fish weight/fish length3) x 100, viscerosomatic index (VSI) = (viscera weight/whole body weight) x 100,
perivisceral fat index (PFI) = (perivisceral fat/body weight) x 100 and hepatosomatic index (HSI) = (liver weight/body weight) x 100.
31 Sanitary conditions, such as fin erosion, parasites and bacterial diseases were also investigated.
3.2.6. Histology
At the end of the experiment, the distal intestinal tract of five rainbow trout per diet was sampled and fixed in 10% buffered formalin. This tract was chosen since, at this level, previous studies have observed morphological modifications following the use of vegetable protein in diet (Baeverfjord and Krogdahl, 1996; Urán et al., 2008a; Penn et al., 2011). Standard histological techniques were applied to investigate potential differences in the intestinal structure among the groups, taking into consideration the thickness of the wall (serosa, muscular layer, submucosa and mucosa), the presence of muciparous cells, supranuclear vacuoles and lymphoplasma cells in the lamina propria. A representative portion of each sample was dehydrated in ethanol, clarified in xylene and embedded in paraffin wax. Tissues were serially sectioned at 4 μm using a rotary microtome (Leica RM2235, Leica Microsystems, Wetzlar, Germany). The slides were stained with hematoxylin and eosin. Processing of the tissues took place at the Laboratory of Animal Pathology in UNICAM. Histological examinations were performed by means of light microscopy (Nikon Phase Contrast 0.90 Dry, Japan).
3.2.7. Water quality
During the trial, water quality was monitored in order to determine physico-chemical parameters, such as temperature, dissolved oxygen and pH, using a portable electronic device (YSI mod. 55 and 60). 500 cc of water were collected and lab determination of total ammonia nitrogen (TAN), nitrites (NO2), nitrates (NO3) and phosphates was carried
32
3.2.8. Statistical analysis
Data concerning zootechnical parameters were submitted for analysis of variance to one way (ANOVA) using SPSS 25 (IBM Corp., 2017) and the differences among the means were evaluated utilizing the Student-Newman-Keuls (SNK) test. Probabilities of p <0.05 were considered significant.
3.3. Results
Data on growth performances and feed conversion rate of rainbow trout fed for 90 days with the experimental diets are reported in Tables 3.2 – 3.4. The final mean body weight recorded at the end of the trial is reported in Figure 3.6. The histology of the distal intestinal tract is reported in Figures 3.7a – 3.7d.
Table 3.2: Productive performances recorded at the end of the trial. Initial mean body weight (g) Final mean body weight (g) Final mean body length (cm) Survival rate (%) Diet 1 Positive Control 47.8±3 133.29±41.0c 21±1 97.9±2 Diet 2 Negative Control 47.8±3 127.54±22.8d 21±2 97.6±3 Diet 3 NC + Emulsifier 500 47.8±3 165.94±37.8a 22.5±1 98.1±2 Diet 4 NC + Emulsifier 750 47.8±3 154.32±34.8b 22.5±1 98.2±3 Data are expressed as mean ± sd. Different superscripts (a, b, c, d) in the same column indicate significant differences between the fish groups (p < 0.05).
33 Table 3.3: Weight gain and feeding performances recorded at the end of the trial.
Weight gain (g) Specific growth rate (% per day) Feed conversion ratio Diet 1 Positive Control 85.49±7.5b 1.14±0.6b 1.23a Diet 2 Negative Control 79.74±8.4b 1.09±0.9b 1.29a Diet 3 NC + Emulsifier 500 118.14±7.3a 1.38±0.9a 1.14b Diet 4 NC + Emulsifier 750 106.52±9.5a 1.30±0.8a 1.15b
Data are expressed as mean ± sd. Different superscripts (a, b) in the same column indicate significant differences between the fish groups (p < 0.05).
Table 3.4: Somatic indices recorded at the end of the trial.
KI VSI PFI HSI
Diet 1 Positive Control 1.25±0.9b 7.82±1.1 1.65±0.3 2.82±0.8 Diet 2 Negative Control 1.18±0.8b 8.02±1.2 2.51±0.6 3.28±1.06 Diet 3 NC + Emulsifier 500 1.46±0.8a 6.13±1.0 1.81±04 2.88±1.03 Diet 4 NC + Emulsifier 750 1.45±0.9a 6.51±1.3 1.94±0.5 2.79±0.8
Data are expressed as mean ± sd.Different superscripts (a, b) in the same column indicate significant differences between the fish groups (p < 0.05).
34 Figure 3.6: Final mean body weight (g) of trout fed the experimental diets.
Data are expressed as mean ± sd.
Diet 1= Positive Control; Diet 2= Negative Control; Diet 3= NC + Emulsifier 500; Diet 4= NC + Emulsifier 750.
With regard to the final mean body weight, the results proved to be significantly different among the four groups: the fish fed on Diet 3 were the heaviest, followed by those of Diet 4, and finally those fed on Diet 1 and 2 respectively, which weighed far less. On the other hand, no significant differences were observed with respect to either the final mean body length or the survival rate among the groups.
The two diets containing the emulsifier allowed for a significantly greater weight gain and specific growth rate with respect to the Positive and Negative Control diets.
The Diet 3 and Diet 4 groups showed a significantly lower and, therefore, more favourable feed conversion ratio than the other two Control groups.
As far as the somatic indices are concerned, no significant differences were noted among the four groups in the VSI, PFI, and HIS, while the KI was significantly higher in the fish fed on two diets containing the emulsifier.
0,00 50,00 100,00 150,00 200,00 250,00
Diet 1 Diet 2 Diet 3 Diet 4
35 Figure 3.7a: Diet 3. Rainbow trout. Posterior intestine.
Mucosa with normal epithelium, submucosa and muscular layers (H&E, bar=50 µm).
Figure 3.7b: Diet 4. Rainbow trout. Posterior intestine.
36 Figure 3.7c: Diet 2. Rainbow trout. Posterior intestine.
Lamina propria expanded by numerous plasma cells (H&E, bar=50 µm).
Figure 3.7d: Diet 1. Rainbow trout. Posterior intestine.
Mucosa with severe loss of the epithelium. The lamina propria is expanded by lymphocytes, plasma cells and microhemorrhages. The submucosa and muscular layers are edematous and hyperemic. The entire wall is thinned (H&E, bar=50 µm).
37
3.4. Discussion
The present trial assessed the effect of two supplemental doses of the emulsifier on the growth performance and feed conversion rate in rainbow trout juveniles fed practical growing diets. Water quality remained within a range considered suitable for the species although the water of tanks 1 and 2 showed a minimum level of ammonia nitrogen compared to tanks 3 and 4 which received the feeds with the emulsifier.
After 90 days of experimental feeding, the overall results of rainbow trout fed on Diet 3 and Diet 4 can be considered satisfactory and within the normal range for the species size. A significant difference concerning the histology of the intestinal tract (Figures 3.7a – 3.7d) was observed among the groups.
A good general morphological condition was noted in the fish fed on Diet 3 and 4: the architecture of the intestinal wall was generally normal in terms of thickness and development of the villi, at the level of the lamina propria only a mild lymphoplasma cellular inflammatory infiltrate was detected together with a slight increase in muciparous cells.
On the other hand, the Diet 1 and Diet 2 groups frequently presented an alteration in the structure of the intestinal wall: it showed a severe thinning and the mucosa appeared de-epithelialised while the lamina propria was often highly expanded due to the infiltration of numerous plasma cells and lymphocytes.
The presence of a constant and consistent lymphoplasma cellular infiltrate in the groups appertaining to Diet 1 and 2, characterized, above all, by the presence of plasma cells, is indicative of a local chronic antigenic stimulation, probably due to damage of the epithelium covering the villi. This leads to a secondary stimulation and activation of the lymphoplasma cellular component.
38 Accordingly, a high level of irritation of the mucosae and a prevalence of hyperplasia of Goblet cells were detected in the fish receiving the Positive Control and the Negative Control diets, whereas a lower degree of irritation was shown in the trout fed on Diet 3 and Diet 4.
This condition is presumably due to the presence of soybean meal at 15% of all the ingredients of the diets. This percentage of protein source of vegetable origin has been included on the basis of the conventional formulation adopted by Eredi Rossi Group in their feeding plants and following the trend of sustainability of feeding in aquaculture. It is well known that sustainable growth of aquaculture will require the development of highly nutritive and functional raw materials to replace fish meal efficiently. However, many studies conducted on fish species to evaluate the performance of plant-based meal, have shown that the inclusion of more than 12% vegetable protein leads to enteritis, as well as depressed immunity (Baeverfjord and Krogdahl, 1996; Bonaldo et al., 2008; Urán et al., 2008b).
It has been ascertained that, in both fish and other vertebrate species, lipid droplets are considered a temporary storage at intestinal level, normally occurring after a meal high in lipids. However, if the lipid accumulation is high, it can destroy the cells and cause damage to the intestinal tissue of fish (D’Aquila et al., 2016). This excessive deposit can be reduced by the addition of phospholipids in the feed (Fontagné et al., 1998; Olsen et al., 2003).
In our trial, in Diet 1 and Diet 2 without the additive, there could presumably have been a delay in the transportation of lipids due to an insufficient production of lipoprotein particles, which is the main cause of severe lipid accumulation.
The emulsifier supplemented in Diet 3 and Diet 4 has resulted in beneficial effects together with a better welfare status of the rainbow trout.
39
4. QUALITATIVE TRAITS OF BY-PRODUCTS OBTAINED BY
RAINBOW TROUT (Oncorhynchus mykiss) PROCESSING
4.1. Introduction
Fish processing can provide precious raw materials, which can be applied in a range of products and markets (Ramírez, 2013). When rainbow trout are processed for fillets, the recovery yields are roughly 50% of the fillets. The remaining 50% of the weight of the whole fish is represented by the by-products.For finfish, by-products typically include trimmings, skins, heads, frames (bones with attached flesh), viscera (guts) and blood (Stevens et al., 2018). One of the main problems from a production point of view is the handling of low value materials, which are highly perishable and are, therefore, often treated as waste. In fact, these under-utilised parts are often ground and discarded without
any attempt to recover nutrients. However, rendered fish should be considered for reutilization. The use of aquaculture by-products is now increasingly considered to be important for improving economic and environmental efficiency, as well as food security (FAO, 2014). New and more efficient recovery technologies are recommended to increase the yields of aquatic food products and to reduce the amount of processing of the by-products (Gasco et al., 2015). Another challenge could be to optimize applications for the recovered materials so that the processing can be economically sustainable. Hence, in aquaculture, as in other food production sectors, innovation in the utilisation of by-products becomes a key factor for remaining competitive and maintaining long-term profitability (Stevens et al., 2018).
Fish by-products are considered suitable for the possible extraction of valuable compounds including oils, proteins, pigments and minerals that could be used in a variety
40 of industries such as fertilisers, nutraceuticals, and ingredients for foods, aquaculture and agriculture (Rustad et al., 2011; Ramirez, 2013).
In this study, qualitative traits of rendered rainbow trout during processing – including muscle meat and skin – were considered. The proximate composition and the fatty acid profile were evaluated and compared with the traits of the trimmed fillet.
4.2. Materials and methods
The trimmed fillets of twenty rainbow trout, and the rendered portions obtained after the filleting process, were taken from the slaughterhouse of the fish farm which supported the study (Sefro, MC). These samples were then analysed. In order to obtain the trimmed fillets, the industrial filleting was further redefined by a manual trimming, which eliminated any possible residue (Figure 4.1).
41 The proximate analysis (moisture, protein, lipid and ash content) and fatty acid profile were assessed. The moisture percentage was determined in duplicate, according to the procedure of the Association of Official Analytical Chemists (AOAC, 1990); the protein content was measured using the standard Kjeldahl copper catalyst method (AOAC, 1990); the ash content was quantified using the procedure described by the AOAC (1990); the total lipid content was measured using the procedure described by Folch et al. (1957). After determining the total lipid content, fatty acids were converted to methyl esters following the method described by Christopherson and Glass (1969).
4.3. Results
The proximate analysis of the flesh of rendered rainbow trout and trimmed fillet submitted to processing is shown in Figure 4.2. Concentrations of moisture and protein in the fillet of trout were found to be significantly higher than those of the rendered portion, whereas the lipid content prevailed in the rendered rainbow trout. The ash content appeared similar in both parts. Fatty acids, saturated fatty acids (SFA), monounsaturated fatty acids (MUFA), polyunsaturated fatty acids (PUFA), ω3 acids, ω6 acids and the ω6/ω3 ratio of the rendered and fillet parts are reported in Figure 4.3. SFAs and total ω6 fatty acids were similar, whereas total MUFAs were higher in the rendered portion. Total PUFAs and ω3 fatty acids were predominant in the fillet.
42 Figure 4.2: Proximate analysis (% as it is) of the flesh of rendered rainbow trout and trimmed fillet
Figure 4.3: SFA, MUFA, PUFA, ω3 acids, ω6 acids (% of the total fatty acids) and the ω6/ω3 ratio of the rendered rainbow trout and trimmed fillet