Evaluating the interplay between different nodes
characteristics in complex networks
Matteo Cinelli, Giovanna Ferraro, and Antonio Iovanella
Department of Enterprise Engineering, University of Rome Tor Vergata, Via del Politecnico, 1 - 00133, Rome Italy,
[email protected], [email protected], [email protected]
In complex networks literature the idea that nodes can possess characteristics able to shed light on their role in the system has been widely accepted and investigated [1, 2, 5, 7]. Thus the possibility to assess the relevance of nodes taking advantage of their properties, either provided by the system or assigned using external arguments, represents a topic of interest within many applications [2, 5, 6, 7]. This kind of approach has been used in order to study homophilic trends in networks by Park and Barab´asi [7] through the observation of a phenomenon called dyadic effect. The quantification of such effect has been performed by two measures called dyadicity and heterophilicity that are defined using the type of dyads that connect similar nodes. Considering nodes characterized with a binary feature ci we encounter then three kind of dyads called
m11, m10and m00. Using these arguments, dyadicity has been defined as D =mm1111 while
heterophilicity as H =m10
m10 where, given the number n1of nodes with ci=1, m11and m10are the expected values of m11 and m10respectively. Dyadicity and
heterophilic-ity consequently define a two dimensional space called D H space that constitutes a region where to investigate the distribution of nodes characteristics when expressed by binary values. Then, if provided with a set of nodes characteristics, they can be analyzed one at the time, computing for each one: the deviation of its distribution from random and the correlation with the network structure using the values of D and H. These two measures let us consequently gain some important insights about the meaningfulness of a property shared by a certain number n12 N, where N is the set of nodes. The
described methodology is currently applied using complete enumerations or heuristic algorithms and visually explained by a tool called phase diagram that shows the distri-bution of nodes characteristics within the D H space. This approach has been adopted thanks to its peculiarity in bringing together some endogenous elements, related to the topology of the network, with some other exogenous elements related to the nodes char-acterization but only applied to very small networks because of its hardness that grows exponentially with the network size. Despite these aspects, the described methodology becomes of particular interest when we have to deal with many nodes characteristics and we intend to make valid hypothesis on which one has been more relevant in deter-mining the actual network topology. Under these circumstances our approach is devoted to provide an informative content which represents a reasonable alternative to the one
The 5thInternational Workshop on Complex Networks & Their
32 of a complete enumeration, in a less onerous way, by tackling the complexity of the problem through a new methodology that doesn’t require the computation of the phase diagram.
Based on certain analytical arguments deriving from structural bounds on the exis-tence of dyads type [7] we compute, for any n12 N and for any possible distribution
of a node characteristic, two curves: the first using the values of m11max= n21 and
m10max=n1(N n1); the second using m11= n21 d, m10=n1(N n1)d where d is
the network density. Moreover we compute Dmax,Hmaxcomparing them with the value
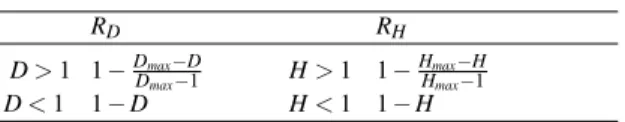
related to the currently examined configuration and introducing a novel index of Rel-evance. This kind of approach let us directly discern, among many characteristics, the ones that can be considered as most important and that can eventually deserve further analyses using, for instance, the methods described in [7]. Since different values of D and H define a set of trends, called dyadic if D > 1, anti-dyadic if D < 1, heterophilic if H > 1 and heterophobic if H < 1, that can be expressed as a percentage if compared to their maximum and minimum values, the index of Relevance can be computed as the arithmetic mean of two components called RD and RH (Table 1) that, fixed n1,
repre-sent relative values of D and H. The proposed framework can be implemented in many
AL AM AT BA BE BG BY CA CH CL CN CY CZ DE DK EE ES FI FR GR HR HU IE IL IS IT JP KR LT LULV ME MK MT NL NO PL PT RO RS RU SE SI SK TN TR UK US 0 100 200 0 100 200 m10 m 11 shape GDP GII color EEN GDP GII D > 1, H < 1 D < 1, H < 1 D < 1, H > 1 D > 1, H > 1 0 1 2 3 4 0 1 2 H D
Gross Domestic Product
D > 1, H < 1 D < 1, H < 1 D < 1, H > 1 D > 1, H > 1 0 1 2 3 4 0 1 2 H D
Global Innovation Index
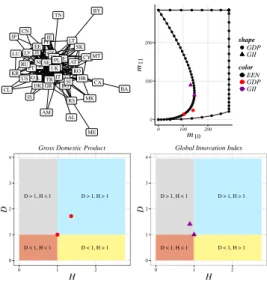
Fig. 1: Clockwise representation of: the EEN members countries in 2011; Upper bound and expected values of m11 and m10 curves for each n12 N and coordinates of the
GDP and GII points for n1= (11,23); Relevance components (RD=0.25; RH =0.2;
R = 0.225) of the GDP in the D H space given n1=11; Relevance (RD=0.14;
RH=0.11;R = 0.125) of the GII in the D H space given n1=23.
The 5thInternational Workshop on Complex Networks & Their
33
domains of application and becomes valuable when we have to deal with interactions among countries whose performances are measured using a wide range of indicators.
We apply this methodology to a real case study [3, 4] over three years, an initiative financed by the European Commission called Enterprise Europe Network (EEN), in which nodes are the member countries, links are partnership agreements of technologi-cal transfer among them. We consider as nodes characteristics a set of macroeconomic indicators such as the Gross Domestic Product (GDP) and the Global Innovation Index (GII). We evaluate how countries that over-perform (ci=1) and under-perform (ci=0)
considering the mean value of each index, from 2011 to 2013, are connected among themselves as in [5] and how this phenomenon affected the network structure. An ex-ample of application is reported in Figure 1 where we observe how the GDP, which shows a higher Relevance, is more significant than the GII in the rationale behind the drafting of agreements.
Table 1: Values of RDand RH
RD RH
D > 1 1 DmaxDmax D1 H > 1 1 HmaxHmax H1
D < 1 1 D H < 1 1 H
References
1. Bianconi, G., Pin, P., Marsili, M.: Assessing the relevance of node features for network structure. Proceedings of the National Academy of Sciences 106(28), 11433–11438 (2009), http://www.pnas.org/content/106/28/11433.abstract
2. Cinelli, M., Ferraro, G., Iovanella, A.: Some insights into the relevance of nodes’ charac-teristics in complex network structures. In: Zylka, M.P., Fuehres, H., Colladon, A.F., Gloor, P.A. (eds.) Designing Networks for Innovation and Improvisation, Proceedings of the 6th In-ternational COINs Conference. Springer Proceedings in Complexity, Springer InIn-ternational Publishing (2016)
3. Ferraro, G., Iovanella, A.: Organizing collaboration in inter-organizational innovation net-works, from orchestration to choreography. International Journal of Engineering Business Management 7(24) (2015)
4. Ferraro, G., Iovanella, A.: Revealing correlations between structure and innovation attitude in inter-organisational innovation networks. International Journal of Computational Economics and Econometrics 6(1), 93–113 (2016)
5. Ferraro, G., Iovanella, A., Pratesi, G.: On the influence of nodes’ characteristic in inter-organisational innovation networks structure. International Journal of Computational Eco-nomics and Econometrics 6(3), 239–257 (2016)
6. Hu, T., Andrew, A.S., Karagas, M.R., Moore, J.H.: Functional dyadicity and heterophilicity of gene-gene interactions in statistical epistasis networks. BioData mining 8(1), 1 (2015) 7. Park, J., Barab´asi, A.L.: Distribution of node characteristics in complex networks. Proceedings
of the National Academy of Sciences 104(46), 17916–17920 (2007)
The 5thInternational Workshop on Complex Networks & Their