S
CUOLA DII
NGEGNERIAI
NDUSTRIALE E DELL'I
NFORMAZIONEC
ORSO DIL
AUREAS
PECIALISTICA INI
NGEGNERIAB
IOMEDICAA new system for real-time monitoring of respiratory mechanics
parameters in mechanically ventilated patients
Relatore: Prof. Andrea ALIVERTI
Tesi di Laurea di:
Giorgio BIANCHI 841339
Marco Antonio CASARANO 838522
I
Summary
The respiratory system is one of the most important systems of human body. Its main function is the gas exchange between the organism and the external environment. This phenomenon is made possible by the activity of the respiratory muscles, which generate a pressure gradient between inside and outside of the body, allowing movement of air flows. This work, in particular, focuses on the study of respiratory mechanics. Starting from the well-known models present in literature, an analysis about the methods able to estimate the mechanical parameters (resistance and elastance) which characterize the models is executed. The R and E estimations are performed using different methods such as: least squares, Mead-Whittenberger and other analyses derived from motion equation. These models have been evaluated under mechanical ventilation conditions in which the activity of respiratory muscles is replaced or integrated in case of pathological conditions such as "Acute Respiratory Distress Syndrome" (ARDS). One of the possible complications induced by mechanical ventilation is the ventilator-induced lung injury (VILI). It has been evaluated during various ventilation techniques, which differ in the degree of collaboration required by the patient or in the ventilator control setting. This because the study and monitoring of patient conditions can help in identifying the most appropriate ventilation mode so as to reduce its induced damage and guide doctors in weaning practice. This procedure consists of a continuous decrease of the ventilation support until detached from the ventilator. For this purpose, in multiple scientific studies, different parameters have been evaluated such as cardiac variability, sleep quality, diaphragmatic dysfunctions, etc. Instead, an experimental method consists in the monitoring of the mechanical power index, defined as the amount of power to which the lung is subjected during ventilation. It is
II
important in this sense, to distinguish the work done by the ventilator to that one performed by the patient. The purpose of this thesis is therefore the development of a real-time monitoring system of the mechanical power index starting from the acquisition of airway pressure, esophageal pressure and flow signals for patients in mechanical ventilation. This device is able to evaluate the stress to which the lung is subjected trying to subdivide the work executed by the ventilator from that of the patient. In addition to a preliminary real-time analysis, the device saves data for an offline processing. Its design is splitted in two parts: Hardware and Software. The first part consists in the acquisition system for pressure and flow signals through the sensors connected to the ventilator. The airway pressure sensor and flowmeter are applied directly to the patient's mask (or endotracheal tube), while the esophageal pressure sensor is connected to a balloon catheter inserted into the esophagus. All three sensors are connected to a principal box, containing the front-end electronic circuit, an Arduino for data acquisition and a Bluetooth module for transmission to PC. The system is powered by a rechargeable battery, so as to make it will completely stand alone. The Software is subdivided into two processes: real-time and offline analysis. In the first part, the acquired signals are displayed in real time on PC in two different modalities, using the Processing software: in the first mode, the traces of pressures, flow and the values of inspiratory and expiratory volumes are shown; while in the second one, the P-V loops for each breath, both with airways pressure and transpulmonary pressure are displayed. In addition, the calculation of the mechanical power index is performed using the acquired signals and the values obtained are displayed on screen. The offline analysis is implemented using MatLab, which, given the input data file, allows to review the acquired traces and extract the elastance and resistance parameters through different models. Then, the obtained values are used to estimate the airway pressure. Each model is therefore compared to the real measurement. This process allows to obtain a determination coefficient (CD) that evaluates the reliability of each estimation. Subsequently, the measured mechanical power index is compared with a value obtained through an experimental formula that uses the mechanical parameters previously extracted. After that, in order to separate the patient’s respiratory muscles contribution one case has been analyzed comparing the difference of mechanical power developed by a breath during controlled ventilation with breaths in which the subject's effort is present. Once the Hardware and Software design has been completed, the accuracy and correct functioning
III
of the sensors has been verified through calibration procedures. The pressure sensors have been calibrated through a U-pressure gauge, while a super-syringe has been used to evaluate flowmeter response to different volumes. Verified the reliability of the sensors, the device has been connected to a ventilator, in order to evaluate the operation of the whole system in terms of acquisition, transmission, treatment of data and battery life. This test has been performed by setting the ventilator in different modalities, and changing several parameters during the monitoring. The instrument has turned out to be reliable and able to correctly represent the traces and changes of the ventilator parameters, as well as a good Bluetooth data transmission quality, for all the three hours of test. During in-vivo analysis, the system has been used to monitor one patient at Istanbul's Sureyyapasa Education and Research Hospital and six patients at the Intensive Care Unit at San Paolo Hospital in Milan, all undergoing mechanical ventilation for different pathologies. The system has been designed in order to minimize the size and avoid obstructions of the work space in ICU room. Once the sensors are connected, the computer for displaying the data can be positioned at an adequate distance from the patient's bed. For each subject, the monitoring has taken different duration, from a few minutes to one hour. Furthermore, for problems related to patient conditions, only for some of them it has been possible to acquire esophageal pressure. Finally, after the offline data analysis, a statistical study has been performed about the mathematical models used to estimate the elastance and resistance parameters. Although the system has demonstrated good operational skills and reliability of measures, both from Hardware and Software point of view, there are several possible future implementations that would make the device even more efficient. An hardware upgrade could involve designing a compact system equipped with a screen, so as to represent in real time the traces, avoiding the use of the PC in the room. Additionally, concerning parameters extraction, it would be interesting in being able to extract elastance and resistance in real-time for each breath, displaying the values on screen. Regarding, the accuracy of the mechanical power and inspiratory muscles effort indexes, it would be important to have further researches about, so as to study in detail their impact on patient conditions. Once gained this knowledge, the system could be used as a continuous monitoring of ICU patients, allowing clinicians to define the most appropriate ventilation modalities depending on the condition of each treated subject.
IV The following thesis is divided into five chapters:
Chapter 1: Respiratory system. In this chapter, the basic knowledge about the anatomy and the physiology of the respiratory system with the related pathologies are presented. Mechanical ventilation is then introduced and described in detail, presenting the various operating modalities and the practice of weaning, aimed at the patient's detachment from the ventilator.
Chapter 2: Respiratory mechanics: In the a detailed description of the respiratory mechanics for both healthy and ventilated subjects is presented. In particular the most significant mechanical parameters with the relative estimation methods and the various mathematical models that best describe the respiratory system behavior are discussed. The concepts of work of breathing and mechanical power are also introduced. For each of these, possible estimation methods are proposed. Finally, the last paragraph presents the objectives of the thesis.
Chapter 3: Development of the system. The third chapter describes the hardware, firmware, and software structure of the system developed. The hardware section presents the used sensors, the front-end electronic circuit, the project specifications in terms of Bluetooth signal transmission and system power supply. Subsequently, the firmware, which allows signals reading from the sensors, is described. Finally, there is a detailed description of the Software used to visualize and process acquired signals, subdivided into a first real-time part and a second offline part.
Chapter 4: Test. The fourth chapter describes the calibration procedures adopted for the sensors and for the whole system, in order to evaluate the reliability of the acquired data and the correct functioning for a long period of monitoring. Then, the ventilation conditions of monitored patients during the in-vivo phase and the type of data analysis performed, are described.
Chapter 5: Results and Conclusions. In the last chapter, results about the data analysis performed on each patient are reported, evaluating the outcomes of the studies and suggesting future system developments.
V
Sommario
Il sistema respiratorio è uno dei più importanti sistemi del corpo umano. La sua principale funzione è lo scambio di gas tra organismo ed ambiente esterno. Questo fenomeno è reso possibile dall’attività dei muscoli respiratori, i quali generano un gradiente di pressione tra l’interno e l’esterno dell’organismo, consentendo il movimento di flussi d’aria.
Questo lavoro, in particolare si concentra sullo studio della meccanica respiratoria. Partendo dai più noti modelli presenti in letteratura è stata effettuata un’analisi sui metodi in grado di stimare i parametri meccanici, resistenza ed elastanza, che caratterizzano i modelli in esame. Le stime di R ed E sono state eseguite utilizzando i metodi di: minimi quadrati, Mead-Whittenberger ed altre analisi derivanti dall’equazione di moto. Questi modelli sono stati valutati in condizioni di ventilazione meccanica in cui si sostituisce o si integra l’attività dei muscoli respiratori nel caso in cui siano presenti condizioni patologiche, come ad esempio “Acute Respiratory Distress Syndorme” (ARDS). Una delle possibili complicazioni dovute alla ventilazione meccanica è il danno polmonare indotto da ventilazione (VILI). Questo è stato valutato durante le diverse modalità di ventilazione, che si differenziano per il grado di collaborazione richiesta dal paziente o per la modalità di controllo del ventilatore. Questo poiché lo studio e il monitoraggio approfondito delle condizioni del paziente può aiutare nell’identificazione del tipo di ventilazione più adeguata, in modo da ridurre i relativi danni indotti e guidare i medici nella pratica di svezzamento. Questa procedura consiste in una continua diminuzione del supporto di ventilazione fino al distaccamento dal ventilatore. Per questo scopo, in molteplici ricerche scientifiche, sono stati valutati differenti parametri come ad esempio variabilità cardiaca, qualità del sonno, disfunzioni diaframmatiche, ecc.
VI
Un metodo sperimentale per lo studio di questa pratica è il monitoraggio dell’indice di potenza meccanica cioè la potenza a cui viene sottoposto il polmone durante la ventilazione. Questa viene definita come l’energia che deve essere applicata al polmone per incrementare il proprio volume, nell’unità di tempo. Per avere una risposta più completa, inoltre, è importante cercare di distinguere il lavoro svolto dal solo ventilatore rispetto a quello svolto dal paziente.
Lo scopo di questa tesi, pertanto è lo sviluppo di un sistema di monitoraggio real-time di parametri relativi alla meccanica respiratoria, in particolare, l’indice di potenza meccanica, partendo dall’acquisizione dei segnali di pressione delle vie aeree, pressione esofagea e flusso di pazienti in ventilazione meccanica. Questo dispositivo, inoltre, valuta lo sforzo a cui è sottoposto il polmone provando a separare il lavoro sviluppato dal ventilatore da quello del paziente. Oltre ad un’analisi preliminare in real-time, il dispositivo consente il salvataggio dei dati per un’elaborazione offline. La progettazione si scompone in due parti: Hardware e Software. La prima è composta dall’acquisizione dei segnali di pressione e di flusso che avvengono tramite dei sensori collegati al ventilatore. Il sensore di pressione delle vie aeree e flussimetro vengono applicati direttamente a livello della maschera del paziente (o tubo endotracheale) mentre il sensore della pressione esofagea viene connesso ad un catetere a palloncino inserito nell’esofago. Tutti e tre sono connessi tramite cavi ad una scatola di dimensioni compatte, contenente il circuito elettronico per il condizionamento del segnale, una scheda Arduino per la lettura dei segnali ed un modulo Bluetooth per la trasmissione al PC. Il sistema è alimentato attraverso una batteria portatile, ricaricabile tramite presa a muro, in modo da renderlo completamente stand alone. La parte Software si suddivide a sua volta in due sottoprocessi: analisi real-time e offline. Nella prima, i segnali acquisiti ed inviati al PC, vengono mostrati in tempo reale attraverso il software Processing, il quale permette la visualizzazione in due modalità: una in cui vengono rappresentate le tracce delle pressioni e del flusso ed i valori dei volumi inspiratori ed espiratori ed una seconda invece, in cui vengono visualizzati i grafici P-V loop per ogni respiro, sia con la pressione delle vie aeree che con la pressione transpolmonare. In aggiunta, partendo proprio da questi ultimi, avviene il calcolo dell’indice di potenza meccanica, il cui valore viene mostrato su schermo. L’analisi offline è implementata tramite il software MatLab, il quale, dato in ingresso il file di dati precedentemente salvato, permette di visualizzare le tracce acquisite ed estrarre i parametri
VII
di elastanza e resistenza con diversi modelli. I valori ottenuti vengono utilizzati per eseguire una stima della pressione delle vie aeree. Ogni modello viene pertanto confrontato con la misura reale e permette di ottenere un coefficiente di determinazione (CD) che valuta l’affidabilità di ciascuna stima. Successivamente l’indice di potenza meccanica misurato, viene confrontato con un valore ottenuto attraverso una formula sperimentale che utilizza i parametri meccanici estratti precedentemente. Infine, per separare il contributo del lavoro dei muscoli respiratori del paziente è stato analizzato un caso andando a confrontare la differenza di potenza meccanica sviluppata tra un respiro completamente controllato dal ventilatore con respiri in cui è presente lo sforzo del soggetto. Una volta terminata la progettazione Hardware e Software, si è verificata l’accuratezza ed il corretto funzionamento dei sensori, attraverso delle procedure di calibrazione. I sensori di pressione sono stati calibrati attraverso un manometro ad U, mentre per il sensore di flusso si è utilizzata una super-siringa andando a valutare la risposta di questo a diversi volumi. Verificata l’affidabilità dei sensori, il dispositivo è stato connesso ad un ventilatore, il quale insufflava aria in un palloncino elastico per valutare il funzionamento dell’intero sistema, in termini di acquisizione, trasmissione e valutazione dati e durata della batteria. Questo test è stato eseguito impostando il ventilatore a diverse modalità, e cambiando i diversi parametri durante il monitoraggio. Lo strumento ha mostrato una buona affidabilità e capacità di rappresentare in modo corretto le tracce ed i cambiamenti dei parametri del ventilatore, oltre ad una buona qualità di trasmissione Bluetooth dei dati, per le tre ore in cui è stato eseguito il test. Nelle analisi in-vivo, il sistema è stato utilizzato per monitorare un paziente presso l’ospedale “Sureyyapasa Education and Research Hospital” di Istanbul e sei pazienti presso il reparto di terapia intensiva dell’ospedale “San Paolo” di Milano, tutti sottoposti a ventilazione meccanica per diverse patologie. Lo sviluppo del sistema è stato pensato per ridurre il più possibile l’ingombro in sala di rianimazione e consentirne l’utilizzo senza ostruire lo spazio di lavoro. Una volta connessi i sensori, il computer per la visualizzazione dei dati, può essere posizionato ad una distanza adeguata dal letto del paziente. Per ognuno dei soggetti è stato effettuato un monitoraggio di durata differente, da qualche minuto fino ad un’ora. Inoltre, per problemi legati alle condizioni dei pazienti, solo per alcuni di essi è stato possibile acquisire la pressione esofagea. Infine, dopo aver eseguito l’analisi offline dei dati, è stato effettuato uno studio statistico relativo ai modelli matematici utilizzati per la stima dei parametri di elastanza e resistenza. Seppur il sistema
VIII
sviluppato abbia dimostrato una buona operatività ed affidabilità sia dal punto di vista Hardware che Software, diverse sono le possibili implementazioni future, che servirebbero a rendere il dispositivo ancor più efficiente. Un miglioramento dell’hardware potrebbe riguardare la progettazione di un sistema dotato di schermo sul quale rappresentare direttamente le tracce acquisite, evitando cosi l’utilizzo del PC in sala. Inoltre, dal punto di vista dell’estrazione dei parametri, sarebbe interessante riuscire ad estrarre in real-time elastanza e resistenza ad ogni respiro, visualizzandone a schermo i valori. Per quanto riguarda invece, l’accuratezza degli indici di potenza meccanica e lavoro compiuto dai muscoli inspiratori, sarebbe importante avere a disposizione ulteriori ricerche in merito, in modo da studiare nel dettaglio il loro impatto sulle condizioni dei pazienti. Una volta ottenute queste conoscenze, il sistema potrebbe essere utilizzato come monitoraggio continuo dei pazienti in rianimazione, permettendo ai medici di definire le modalità più adeguate di ventilazione a seconda dello stato di ognuno dei soggetti in cura.
La seguente tesi è suddivisa in cinque capitoli:
Capitolo 1: Sistema respiratorio. In questo capitolo vengono inizialmente presentate le conoscenze fondamentali riguardanti l’anatomia e la fisiologia del sistema respiratorio con le relative patologie. Viene quindi introdotta e descritta in dettaglio la ventilazione meccanica, presentando le varie modalità di funzionamento e la pratica di weaning, rivolta al distaccamento del paziente dal ventilatore.
Capitolo 2: Meccanica respiratoria. Nel secondo capitolo viene presentata una descrizione dettagliata sia della meccanica respiratoria sia per soggetti sani che ventilati. In particolare vengono discussi i parametri più significativi con i relativi metodi di stima ed i diversi modelli matematici che meglio descrivono il comportamento del sistema respiratorio. Viene inoltre introdotto il concetto di lavoro respiratorio e di indice di potenza meccanica. Per entrambi vengono quindi presentati dei possibili metodi di stima. Infine, l’ultimo paragrafo presenta gli obiettivi della tesi.
Capitolo 3: Sviluppo del sistema. Il terzo capitolo descrive la struttura Hardware, Firmware e Software del sistema sviluppato. Nella parte Hardware vengono descritti i sensori utilizzati, il circuito elettronico per il front-end dei segnali oltre alle specifiche di progetto in termini di trasmissione Bluetooth dei segnali ed alimentazione del sistema.
IX
Successivamente, viene descritto il Firmware che consente la lettura dei segnali dai sensori. Segue una descrizione dettagliata del Software utilizzato per la visualizzazione dei segnali acquisiti ed elaborazione dei dati, suddivisa in una prima parte real-time ed una seconda parte offline.
Capitolo 4: Test. Nel quarto capitolo vengono descritte le procedure di calibrazione dei sensori e del sistema intero, al fine di valutarne l’affidabilità dei dati acquisiti ed il corretto funzionamento per un lungo periodo di monitoraggio. Infine, vengono descritte le condizioni di ventilazione dei pazienti monitorati durante la fase in-vivo ed il tipo di analisi dei dati eseguito.
Capitolo 5: Risultati e Conclusioni. Nell’ultimo capitolo vengono riportati i risultati in merito all’analisi dei dati eseguita su ogni paziente, valutando gli esiti degli studi e proponendo eventuali sviluppi futuri del sistema.
X
Contents
1. Respiratory System... 1 1.1 Principles of Breathing ... 1 1.1.1 Anatomy ... 1 1.1.2 Physiology... 3 1.1.3 Measurement of variables ... 6 1.1.4 Diseases... 81.1.4.1 Acute respiratory distress syndrome (ARDS) ... 9
1.2 Mechanical Ventilation ...11
1.2.1 Different types of mechanical ventilation...11
1.2.1.1 Control Variables ...11
1.2.1.2 Breath Sequence ...12
1.2.1.3 Targeting schemes ...14
1.2.2 Operator Inputs...17
1.2.3 Ventilator-Induced Lung Injury (VILI) ...22
1.2.4 Weaning ...24
2. Respiratory Mechanics ...26
2.1 Respiratory System Modeling...27
2.1.1 Parameter of the System ...27
2.1.2 Description of the Models...31
XI
2.2 Work of breathing ...43
2.2.1 Mechanical Power Index ...47
2.3 Objectives ...50
3. Development of the System...51
3.1 Hardware...52 3.1.1 Flowmeter ...53 3.1.2 Pressure Sensors ...57 3.1.3 Arduino Board...59 3.1.4 Bluetooth...60 3.1.5 Power Supply ...61 3.2 Firmware ...64 3.3 Software ...66 3.3.1 Real-time Analysis ...67 3.3.1.1 Data Receiving ...67 3.3.1.2 Display Modes ...69 3.3.1.3 Power Calculation ...73 3.3.2 Offline Analysis ...75
3.3.2.1 Algorithm for parameter extraction ...76
3.3.2.2 Mechanical Power Algorithm ...80
4. Tests ...82
4.1 Functioning Test...83
4.1.1 Sensors Calibration...83
4.1.2 Data Acquisition Check ...86
4.2 In Vivo Test ...89
4.2.1 System Positioning in Recovery Room ...89
4.2.2 Patients ...92
4.2.3 Data Analysis...97
XII
5.1 Pressure Model Evaluation ... 101
5.2 Mechanical Power Analysis ... 112
5.3 Index Effort Estimation ... 124
5.4 Future Developments ... 130
XIII
List of Figures
Figure 1.1: Respiratory System ... 2
Figure 1.2: Pulmonary Volumes ... 4
Figure 1.3: Model of the entire respiratory system... 5
Figure 1.4: Rectangle method... 7
Figure 1.5: Trapezoidal method ... 8
Figure 1.6: Pressure-controlled mode ...12
Figure 1.7: Volume-controlled mode...12
Figure 1.8: CPAP ventilation ...13
Figure 1.9: Intermittent mandatory ventilation (IMV) ...14
Figure 1.10: Close loop control circuit...14
Figure 1.11: Servo control circuit...15
Figure 1.12: Adaptive control circuit ...15
Figure 1.13: Optimal control circuit ...16
Figure 1.14: Intelligent control circuit ...16
Figure 2.1: Relaxation Pressure curve ...28
Figure 2.2: P-V curve (Super-Syringe Method)...29
Figure 2.3: Inspiration Occlusion Techinque ...30
Figure 2.4: Low-Flow Inflation Technique ...30
Figure 2.5: Slice Method ...31
Figure 2.6: Simple representation of respiratory system...32
Figure 2.7: Single Linear compartment model for respiratory system...32
Figure 2.8: Relationship between: Elastance-Volume (A); Resistance – Flow (B)...33
Figure 2.9: Multiple compartment model ...34
Figure 2.10: Traces obtained in Volume-controlled ventilation with an occlusion maneuver ...39
Figure 2.11: Estimation of chest wall Compliance ...39
XIV
Figure 2.13: Mead-Whittenberger method...41
Figure 2.14: Campbell Diagram ...44
Figure 2.15: WOB in controlled mechanical ventilation ...46
Figure 2.16: Energy representation in P-V loop diagram...48
Figure 3.1: Complete system diagram ...52
Figure 3.2: SFM3300-AW Flowmeter...53
Figure 3.3: Thermal measurement principle of SFM3300 -AW Flowmeter ...54
Figure 3.4: Schematic representation of signal processing ...55
Figure 3.5: SFM3300-AW flowmeter pins ...55
Figure 3.6: Results after SFM-3300 autoclave procedure ...56
Figure 3.7: SSCSNBN001PDAA5 Pressure Sensor ...57
Figure 3.8: Sallen-Key LP filter ...58
Figure 3.9: M8 4-Pin Connector and Cable ...58
Figure 3.10: Arduino Board...59
Figure 3.11: RN-42 Bluetooth Module...60
Figure 3.12: USB Bluetooth Dongle...61
Figure 3.13: Anker Power Bank...62
Figure 3.14: Boost converter ...62
Figure 3.15: Schematic representation of the whole system connections ...63
Figure 3.16: Picture of the real encased system...63
Figure 3.17: Arduino Firmware Flow chart ...65
Figure 3.18: Data Analysis Flow chart...66
Figure 3.19: Real-Time Analysis flow chart ...68
Figure 3.20: M4 Display Mode ...69
Figure 3.21: Ongoing Options...70
Figure 3.22: Power Display Mode...70
Figure 3.23: Saving Data Flow chart...71
Figure 3.24: Extract from the text file saved by Processing...72
Figure 3.25: Temporal diagram of Power Calculation...74
Figure 3.26: Dialog Box about interval time ...75
Figure 3.27: Subplot of Flow, Airway and Esophageal Pressure ...76
Figure 3.28: Least square Method Algorithm...77
Figure 3.29: Pressure controlled Mode Algorithm...77
Figure 3.30: Plateau Pressure computation ...78
Figure 3.31: Mead-Whittenberger Algorithm ...79
Figure 3.32: Recursive Algorithm...80
Figure 3.33: Pressure curves Algorithm...80
Figure 3.34: Power Algorithm...81
XV
Figure 4.2: U-tube manometer ...84
Figure 4.3: Three-ways valve ...85
Figure 4.4: Pressure sensors calibration procedure ...85
Figure 4.5: Pressure sensors Input-Output Relationship ...86
Figure 4.6: Data acquisition check...87
Figure 4.7: Comparison between Ventilator and System Measurements...88
Figure 4.8:System Positioning...89
Figure 4.9: Real-time Monitoring at San Paolo Hospital ...90
Figure 4.10: Real-time Monitoring at Sureyyapasa Education and Research Hospital ...91
Figure 5.1: Pressure Models (Patient 1) ... 102
Figure 5.2: Models Error (Patient 1) ... 102
Figure 5.3: Pressure Models (Patient 2) ... 103
Figure 5.4: Models Error (Patient 2) ... 103
Figure 5.5: Pressure Models (Patient 3) ... 104
Figure 5.6: Models Error (Patient 3) ... 104
Figure 5.7: Pressure Models (Patient 4) ... 105
Figure 5.8: Models Error (Patient 4) ... 105
Figure 5.9: Pressure Models (Patient 5) ... 106
Figure 5.10: Models Error (Patient 5)... 106
Figure 5.11: Pressure Models (Patient 6) ... 107
Figure 5.12: Models Error (Patient 6)... 107
Figure 5.13: Pressure Models (Patient 7) ... 108
Figure 5.14: Models Error (Patient 7)... 108
Figure 5.15: Error Distribution (M1) ... 110
Figure 5.16: Power-error Relationship (Patient 1) ... 113
Figure 5.17: Power-error Relationship (Patient 2) ... 114
Figure 5.18: Power-error Relationship (Patient 3) ... 115
Figure 5.19: Power-error Relationship (Patient 4) ... 116
Figure 5.20: Power-error Relationship (Patient 5) ... 117
Figure 5.21: Power-error Relationship (Patient 6) ... 118
Figure 5.22: Power-error Relationship (Patient 7) ... 119
Figure 5.23: Power-error Relationship for Pressure-mode ... 120
Figure 5.24: Power-error Relationship for Volume-mode ... 121
Figure 5.25: Pressure wave with and without effort... 124
Figure 5.26: P-V loop with and without effort... 125
Figure 5.27: Patient effort ... 125
Figure 5.28: Original and Shuffled time series ... 127
Figure 5.29: DFA of Patient effort ... 128
XVI
List of Tables
Table 3-1: Arduino UNO specifications...60
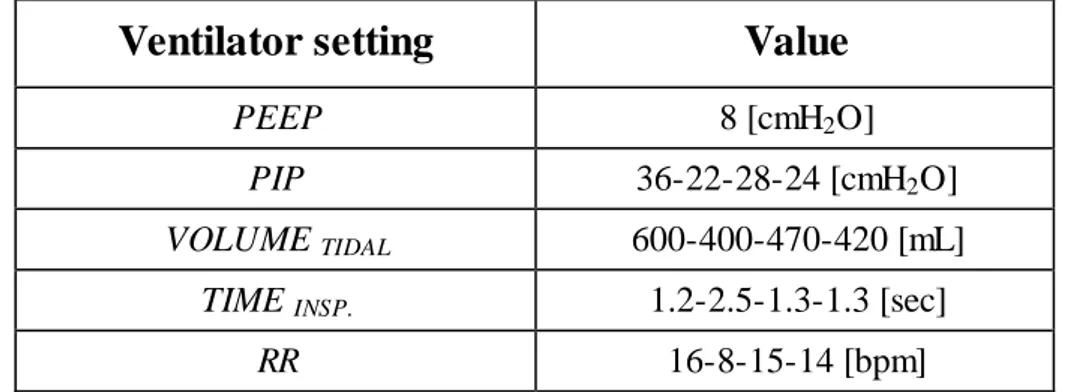
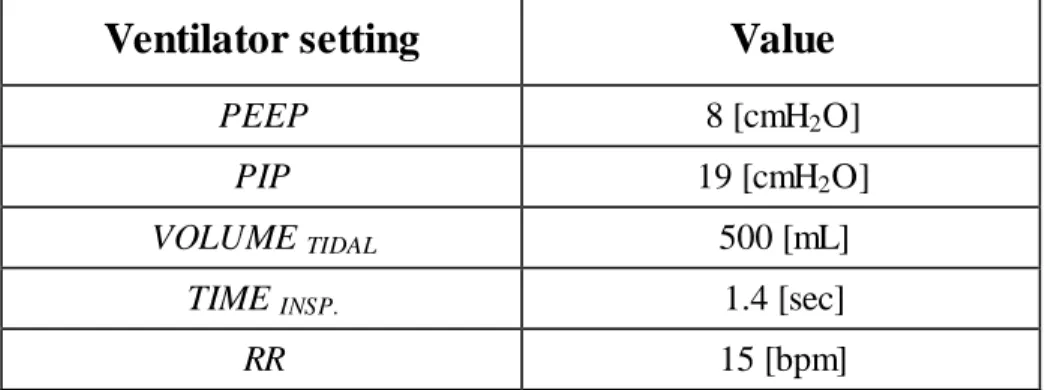
Table 4-1: Ventilator settings for Patient 1 ...92
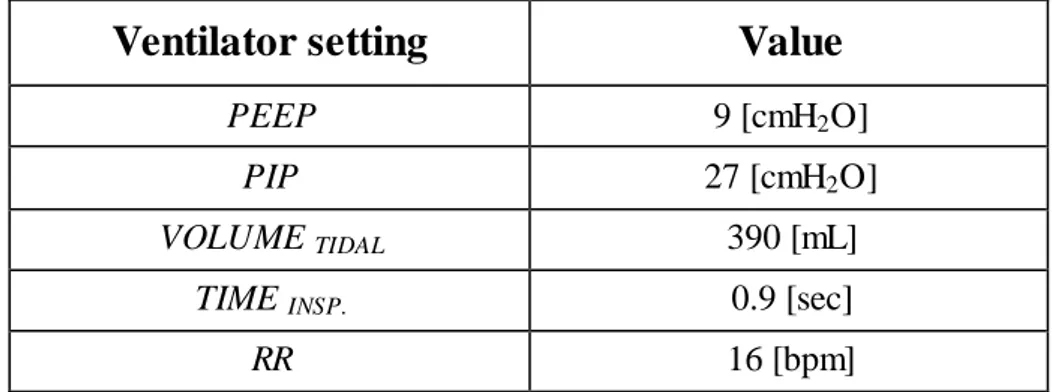
Table 4-2: Ventilator settings for Patient 2 ...93
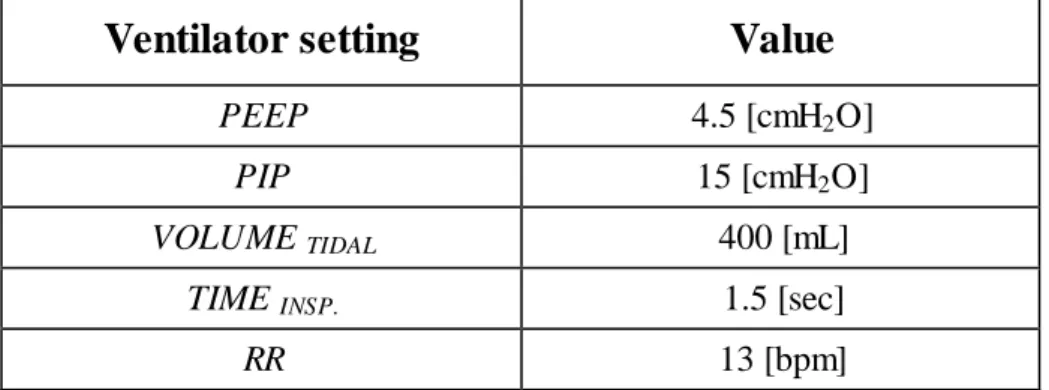
Table 4-3: Ventilator settings for Patient 3 ...93
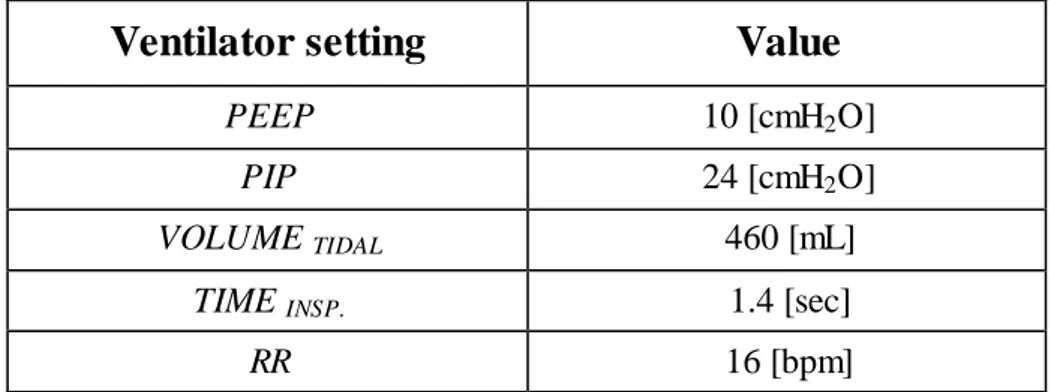
Table 4-4: Ventilator settings for Patient 4 (1 acquisition)...94
Table 4-5: Ventilator settings for Patient 4 (2 acquisition)...94
Table 4-6: Ventilator settings for Patient 5 ...94
Table 4-7:Ventilator settings for Patient 6 ...95
Table 4-8: Ventilator settings for Patient 7 (1 acquisition)...95
Table 4-9: Ventilator settings for Patient 7 (2 acquisition)...96
Table 4-10: Ventilator settings for Patient 7 (3 acquisition)...96
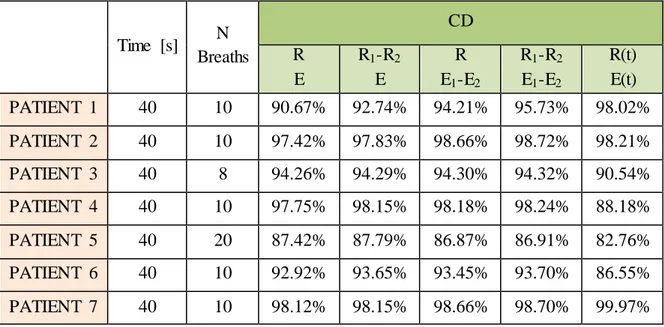
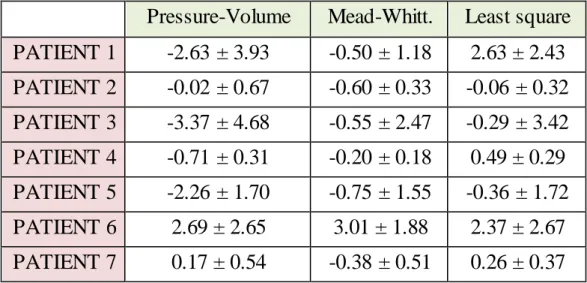
Table 5-1: Models Results ... 109
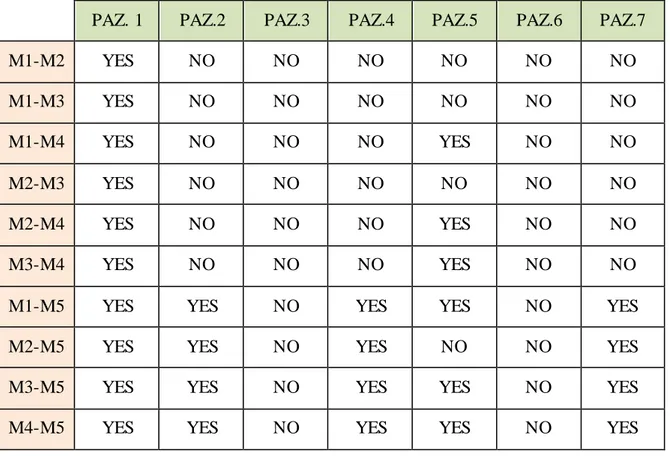
Table 5-2: Tuk ey test results ... 111
Table 5-3: Patients Characteristics ... 112
1
Chapter 1
1. Respiratory System
1.1 Principles of Breathing
1.1.1 Anatomy
The respiratory system is an anatomical structure which functioning allows gas exchange between environment and body, through respiratory airways. It is responsible for oxygen assumption and carbon dioxide ejection during two phases called inspiration and expiration.
As we already know, every cell in our body needs oxygen to accomplish its functions. The apparatus is made by different structures:
Nose/Mouth: This part allows air to flow inside and outside the body. It contributes in warming, humidifying and filtering air.
Pharynx: It is the part behind the mouth and nose, its function is to warm, humidify and filter air.
Larynx: It is situated just below the Pharynx. One its aim is the prevention of foreign objects from entering the lungs by coughing and other reflexive actions.
2
Trachea: It is a cartilaginous tube that connects the pharynx and larynx to the lungs, allowing the passage of air.
Bronchi: They are two airways in the respiratory tract that conduct air into the lungs. There is a right bronchus and a left bronchus and these bronchi branch into smaller secondary and tertiary bronchi which branch into smaller tubes, known as bronchioles.
Lungs: Organs in which the gas exchange take place through passive diffusion between the alveoli and the blood vessels that surround their external structure. These are made by elastic tissues which allows inflation and deflation movements, in order to take and eject air. Actually, being lungs a pure elastic structure, they normally tend to collapse. This phenomenon is impeded by the opposite nature of the chest wall, to which the lungs are pasted through pleura, which tend to expand.
Pleura: It is a membrane that covers both lungs and attaches them to the chest wall. This structure is fundamental in order to assure a negative pressure outside the lungs, allowing their expansion during inhalation.
►Figure 1.1: Respiratory System
Composition of inhaled air is roughly 78% Nitrogen, 20% Oxygen and the last 2% is made by Argon, Carbon dioxide and water vapor.
Exhaled air is slightly different, due to the gas exchange that occurs at lungs level. In detail, it is made by 78% Nitrogen, 16% Oxygen, 5% Carbon dioxide and 1% by Argon. Gas transfer between respiratory system airways and blood vessel occurs by passive diffusion at lung level, thanks to gradient of gasses partial pressures.
3
In fact, at alveolar level, oxygen and carbon dioxide have respectively a partial pressure of about 100mmHg and 40mmHg, while at venous level their pressures are around 40mmHg and 46mmHg. These differences allow the diffusion of O2 from alveolar space to venous
one and in opposite direction for CO2. This process leads to partial pressure values of
95mmHg for O2 and 40mmHg for CO2 in arteries, which then supply the entire body with
oxygen. Breathing is a process that requires the collaboration of different structures and apparatus in addition to the one described above, as the respiratory muscles and intercostal muscles. Respiratory muscles are contracted during inspiration which is an active process, while are relaxed during expiration which is a passive movement. The most important inspiratory muscle is the diaphragm, a dome shape muscle, placed immediately underneath the lungs. During inspiration, the diaphragm contracts and acquires a flat shape, provoking the expansion of both lungs. The execution of an inspiration and expiration is called respiratory cycle and the mean number of respiratory cycle is 12-18 in healthy humans. The basis of breath lies on the generation of pressure difference inside the respiratory system’s structures, in order to generate flow and thus gas volume movements.
In way to assure this continuously variation of pressure, different dynamic forces are applied by all the unit involved. If some of these structures stop to work correctly, the forces applied may not be able to allow a correct respiration. For this purpose, the study, comprehension and monitoring of respiratory mechanics, is essential to evaluate the functioning of the different structures involved, how their fail would affect the system and how they could be recovered or supported by mechanical ventilation.
1.1.2 Physiology
For a better understanding about how the respiratory system achieves its tasks, a full description of its physiological characteristics is necessary. As said previously, the main events that allows breathing, consist of changes in volume due to pressure differences among structures. The drop of pressure between airway opening and the inside of the system generates an air movement according to the Poiseuille law:
4
Assuming to be in stationary condition with Newtonian fluid in laminar flow flowing in a cylindrical duct with constant section, this law states that that a pressure difference (∆𝑃) between two points of the conduit generates a flow (𝑉̇) in the opposite direction to the pressure drop, which is inversely proportional to a resistance (𝑅) which depends on the fluid characteristics and the duct dimensions. Pressure (𝑃) and volume (𝑉) are also related between them through the Boyle law for gases, which states that in constant temperature condition, the gas pressure is inversely proportional to its volume.
𝑃 × 𝑉 = 𝐾 (1.2)
According to this, during inspiration, the inspiratory muscles produce a decrease of the inside pressure, followed by an inspiratory flow and consequently an increase of lungs volume as total effect. Instead, the relaxation of respiratory muscles increase the pressure, inducing an expiratory flow and then a decrease in lungs volume.
During each inspiration phase, the air taken into the lungs is called tidal volume and in a normal breath usually count up roughly to 500mL. The tidal volume sum up to the volume of air remained at the end of each normal expiration, called Functional residual capacity (FRC). The total volume, which can be forcedly expired after a maximal inspiration, is called vital capacity and in a healthy man is approximately 4.8L. The vital capacity can be also expressed as the difference between the total lung capacity and the residual volume, which is the volume of air that rests in lungs after a maximum expiration.
5
In order to better understand the real functioning of the system, the pressure P can be decomposed in different terms, describing the drop of pressure among the different compartments. Their measuring is essential for the assessment of the system’s mechanical properties. The pressures acting in the system are: the airway opening Pressure (PAO),
which refers to the pressure at the mouth, the alveolar Pressure (PAL), pleural Pressure
(PPL), abdominal Pressure (PAB) and body surface Pressure (PBS) (usually taken as the
atmospheric pressure).
The total pressure applied (PRS) is the difference between PAO and PBS, while in a
ventilated patient is given by the sum of the pressure generated by the mechanical ventilator (PVENT) and the pressure developed by the respiratory muscles (PMUS):
𝑃𝑅𝑆 = 𝑃𝐴𝑂− 𝑃𝐵𝑆= 𝑃𝑉𝐸𝑁𝑇 ± 𝑃𝑀𝑈𝑆 (1.3)
These sequence of pressures can be schematized as follow:
►Figure 1.3: Model of the entire respiratory system
Other pressures, which represents as well specific characteristic of respiration, can be determined as differences among those previously described.
The elastic recoil pressure (PEL), is defined as difference between PAL and PPL, and it
represents the rebound of the stretched lung after inhalation. Pressure drop due to airways flow resistance (PAW) is defined as PAO-PAL.
6
It is also possible to define the transpulmonary pressure (PT P), as difference between PAO
and PPL. PT P is usually positive during normal breathing, because PPL is always negative,
while PAW rests between slightly negative and slightly positive values.
Transdiaphrammatic pressure is given by PPL minus PAB, it is used to assess the force
executed by the diaphragm and so, it is used during clinical check to evaluate pathologic condition (as paralysis or weakness). Instead, chest wall pressure (PCW) is defined as the
pressure drop between PPL and PBS.
Consequently, PRS may be expressed as summation of the two terms PT P and PCW, as stated
in the following equation:
𝑃𝑅𝑆= 𝑃𝐴𝑂− 𝑃𝐵𝑆= (𝑃𝐴𝑂− 𝑃𝑃𝐿) + (𝑃𝑃𝐿− 𝑃𝐵𝑆) = 𝑃𝑇𝑃+ 𝑃𝐶𝑊 (1.4)
Pleural pressure plays an important role in avoiding lungs collapse at end expiration. This pressure always has negative value and so it induces a positive transpulmonary pressure and a consequent lung expansion.
1.1.3 Measurement of variables
In order to further design a model for respiratory mechanics, the experimental data of pressure, volume and flow are of fundamental importance.
Pressure is measured by pressure transducers, the most common sensors detect a deformation of a mechanical element due to pressure forces, and convert it in an electric signal. The most important pressures that can be measured in a low-invasive way in clinical application are the airway opening pressure and the esophageal pressure.
The PAO is measured by inserting a perpendicular tap into the tube in which the patient is
breathing (as the endotracheal tube in a mechanical ventilated patient or face masks for healthy subjects), disregarding the Bernoulli Effect for the driving pressure.
Esophageal pressure (PES) and gastric pressure (PGA) are used to approximate respectively
PPL and PAB, that can’t be clinically measurable. PES is measured by means of a thin
catheter with a 10-cm balloon at the tip, filled with 0.5mL of air and inserted in the lower third of the esophagus, while the distal part of it is connected to a pressure transducer. The position of the catheter is crucial to have a good approximation of PPL and because of this,
7
spontaneously breathing patients. This method is performed during end-expiratory occlusion maneuver with a simultaneous measure of airway and esophageal pressure during an inspiratory effort. Then, if the ratio PAO/PES is close to unity (deviation lower
than ±10%) the position of the catheter is acceptable. A similar system is used to assess the correct position of the catheter which measures PGA, evaluating the ratio PAO/PGA. Flow
is measured using sensors called flowmeters, which lies on various physical principles. Most common used are differential pressure sensors (also known as pneumotacographs), in which a drop of pressure over a resistive element is induced when flow is passing through it. Given the previously described Poiseuille law, the measurement of the pressure drop allows to obtain the relative flow.
A second type of flowmeters are based on thermic principle, in which a sensitive element changes its temperature when crossed by flow. This temperature variation is transduced in electrical signal proportional to the flow.
Volumes are obtained as integral of flow during time. The integration can be made in two different methods:
Rectangle method: Volume is obtained as the area under the flow signal curve during time. This area is subdivided in different rectangles whose height is determined by the flow signal value, and the width depends on the time interval between the consecutive flow data points. The summation of the each single rectangle area represents the total volume.
►Figure 1.4: Rectangle method
Trapezoidal method: Volume is obtained approximating the region under the flow signal curve in time as a trapezoid, and calculating its area.
8
►Figure 1.5: Trapezoidal method
For a real lung, the assumption that the flow is the time derivative of volume is not always true. The inspired air becomes warmed and humidified when it pass through the airways, in order to adapt to the lungs conditions. This event implies a mismatch between the integrated mouth flow and the thoracic expansion. The rate of change at which oxygen moves from lungs into the pulmonary blood in generally slightly greater than the rate at which carbon dioxide is excreted from the blood into the lungs.
Then, this problem implies a drift in volume calculation. The drift is observed as a slightly greater inspired volume than the one expired, one of the main cause is the different gas composition and temperature.
1.1.4 Diseases
Different pathologies can be related to malfunctioning of the respiratory system. Being a complex structure, every failure in one of its components can then lead to an insufficient work of the entire block. Diseases can be classified basing on the tract of the system that is affected. For example, pathologies for airway tract are asthma, chronic obstructive pulmonary disease, emphysema and so on, while at lungs level the most diffused are pneumonia, tuberculosis, edema, ARDS (acute respiratory distress syndrome) and cancer. Thanks to technological development in clinical field, now part of those disease can be treated by mechanical ventilation, in which a machine is used to assist or substitute spontaneous breathing. Clinical states that are treated with mechanical ventilation can be divided basing on the organ affected in pulmonary or non-pulmonary conditions.
9
1.1.4.1 Acute respiratory distress syndrome (ARDS)
The acute respiratory distress syndrome (ARDS) is a hypoxemic respiratory failure characterized by severe inflammatory damage to the alveolar–capillary barrier. This damage can be triggered by primary injury to the epithelium (pulmonary ARDS), as in cases of pneumonia or bronchial aspiration, or to the endothelium (extrapulmonary ARDS), as in cases of nonpulmonary sepsis.
Its definition has evolved in a significant way over the time. ARDS was first described by Ashbaugh and colleagues in 1967 [2] in a case series of 12 ICU patients who shared the common features of unusually persistent tachypnea and hypoxemia accompanied by opacification on chest radiographs and poor lung compliance. In 1971, Petty and Ashbaugh [3] described principles of management of ARDS based mainly on mechanical ventilation using high FiO2 and positive end-expiratory pressure (PEEP).
For more than 20 years, there was no common definition of ARDS so, in 1994, an international American–European Consensus Conference (AECC) laid the foundations for the first clinical definition of ARDS. This consensus conference aimed to bring uniformity to the definition of ARDS for research, epidemiologic studies, and individual patient care. ARDS was consequently defied using the following four criteria:
the acute onset of hypoxemia
a PaO2 to FiO2 ratio ≤ 200 mmHg regardless of PEEP level
the presence of bilateral infiltrates on chest X-ray
the pulmonary artery wedge pressure ≤18 mmHg or no clinical sign of left atrial hypertension.
Patients meeting all these criteria but having less severe hypoxemia with a PaO2/FiO2
between 201 and 300 mmHg were considered as having acute lung injury (ALI) and not ARDS. This clinical definition has been criticized leading to the establishment of a new statement in 2012, the Berlin definition [4]. This last aimed to provide a better clinical definition and to classify patients according to severity. The changes proposed in this document in order to address the major limitations of AECC definition are the following: 1) The “acute onset” of ARDS has been specified, and respiratory symptoms have to be
10
2) Patients have been stratified according to their severity in terms of hypoxemia and classified as mild, moderate, and severe ARDS when PaO2/FiO2 ratio is between 201
and 300, between 101 and 200, and equal to or below 100 mmHg, respectively.
3) The AECC definition considered that pulmonary arterial wedge pressure should not exceed 18 mmHg in ARDS.
4) The Berlin definition considered radiological findings as bilateral opacities on chest X-ray but also on CT scan, which were not fully explained by effusions, lobar or lung collapse, or nodules.
Four ancillary variables were assessed for severe ARDS, including more extensive opacities on chest radiograph, i.e., at least three quadrants, a high PEEP level ≥10 cmH2O,
low respiratory system compliance ≤40 ml/cm H2O, and a corrected expired volume ≥10
L/min. However, these criteria were not included in the Berlin definition because they did not help to discriminate patients with severe ARDS.
11
1.2 Mechanical Ventilation
1.2.1 Different types of mechanical ventilation
As stated in formula 1.3, the combination of ventilator and muscle pressure can drive the total pressure developed on the system. From this relationship different situations may occurs. For example, when the patient’s respiratory muscles are not functioning (PMUS=0),
the ventilator must generate all the pressure for inspiration. In the opposite situations, when ventilator is not needed all the pressure is developed by respiratory muscles, as happen during a spontaneous breathing. Between these two conditions, different combinations of muscles and ventilator contributes are possible, depending on patient condition, identifying a condition of ventilator support.
Different ventilation techniques are available nowadays, depending on the controlled variables, the type of breathing or the variable set on ventilator.
1.2.1.1 Control Variables
The classification made on the controlled variables identifies two main modalities:
Pressure Control: Pressure is the independent variable, and may take a specific waveform, while volume and flow waveforms depend on it. Pressure ventilation can be classified as positive if the airway pressure is raised above a threshold, or negative whether the body surface pressure is lowered below a baseline. Negative pressure ventilation requires a sub-atmospheric pressure applied outside the body, in order to expand the chest wall during inspiration, while allows passive patient exhalation when no negative pressure is present. During positive pressure inspiration a pressure greater than atmospheric is applied inside the chest to expand it. Expiration occurs passively, due to pressure difference between lungs and atmosphere and due to lungs’ elastic recoil. The main advantage of this modality is that the lungs can be protected from excessive pressures. A typical waveform of positive pressure ventilation is shown below:
12
►Figure 1.6: Pressure-controlled mode
Volume Control: The shape of volume waveform is specified, making flow and pressure dependent variables. This type of ventilation results in a more stable minute ventilation. A typical waveform of volume ventilation is shown below:
►Figure 1.7: Volume-controlled mode
Flow controlled ventilation may be not considered, because when the ventilator controls volume directly, flow is controlled indirectly and vice versa.
1.2.1.2 Breath Sequence
Ventilations may be distinguished also basing on the type of breaths which come in succession. A breath is defined as a positive airway flow relative to baseline, paired with a negative airway flow, both associated with ventilation of the lungs. Different type of
13
breathing may be discussed, depending on who generates it, between the patients or the ventilator.
Spontaneous breath: The patients determines both breath timing and size, defining the start and the end of inspiration.
Assisted breath: The breath is assisted by the ventilator, as for example increasing airway pressure above a baseline. Each breath is also spontaneous because the patient both triggers and cycles the breath.
Mandatory breath: The patient has no control on timing and size of breath. The start and end of inspiration are both determined by the ventilator. The machines triggers and cycles each breath.
Then, having defined the various types of breaths, there are several possibility of breath sequences to be used during mechanical ventilation:
Assist control (AC): the ventilator assist patient’s breathing with a specific number of breathing act during time.
Continuous positive airway pressure (CPAP): continuous pressure is given to the patients, improving oxygenation and reducing workload.
►Figure 1.8: CPAP ventilation
Intermittent mandatory ventilation (IMV): Spontaneous breaths are permitted between mandatory one. An example of IMV breaths sequence is depicted in Fig. 1.9
14
►Figure 1.9: Intermittent mandatory ventilation (IMV)
Continuous mandatory ventilation (CMV): The intent of this type of ventilation is to provide a mandatory breath for every patient inspiratory effort, thus spontaneous breaths are not permitted
1.2.1.3 Targeting schemes
Targeting schemes are feedback control systems used by mechanical ventilators to deliver specific ventilatory patterns. The targeting scheme is a key component of a mode classification system. Feedback signals are used in order to deliver specific ventilatory patterns. Ventilators use closed loop control circuit in order to maintain consistent pressure and flow waveforms. The output of the variable is compared to its set input values, the difference is used to drive the system towards the desired output. For example, during pressure control mode, airway pressure is used as feedback signal, to control gas flow from the ventilator. A schematic representation of a closed loop control circuit is in Fig. 1.10.
►Figure 1.10: Close loop control circuit
The controller convert the error signal into a signal that can drive the effector, in order to change the manipulated variable. The plant refers to the process under control, which is the patient. The transfer function which relates the input and the output of the controller is the targeting scheme. Several types of targeting schemes can be identified, mainly based on increasing levels of autonomy. Some of these schemes are:
15
Set Point: The operator sets specific target values and the ventilator attempt to deliver them. As example, in volume controlled mode, the tidal volume and inspiratory flow are set while in pressure mode, the operator may set the PIP or the inspiratory time. Servo: This control mechanism is capable of a high degree of synchrony with patient
breathing effort. Then, ventilator work output can be made to match patient work demand with a high degree of fidelity. In this scheme, the ventilator’s output automatically follows a varying input.
►Figure 1.11: Servo control circuit
Adaptive: In this targeting schemes, the transfer function between input and output is modified according to the varying patient conditions.
►Figure 1.12: Adaptive control circuit
Optimal: It is an advanced form of adaptive targeting. The ventilator controller automatically adjust the targets of the ventilatory pattern, to either minimize or maximize some overall performance characteristic. An example of target to minimize is the work of rate of breathing.
16
►Figure 1.13: Optimal control circuit
Intelligent: This schemes is useful for weaning procedures. The controller sets values of breathing frequency, tidal volume and end tidal CO2 in an acceptable range for
spontaneous breathing, automatically adjusting inspiratory pressure. The control process is divided in three steps. In the first one, the patient is stabilized in a “zone of respiratory comfort”. The second step is to progressively decrease the inspiratory pressure while making sure the patient remains in the “zone”. The third step tests readiness for extubation by maintaining the patient at the lowest level of inspiratory pressure. Once the lowest level of inspiratory pressure is reached, the patient’s breathing frequency, tidal volume and end-tidal CO2 are monitored for 1-hour. After
success of this step, the ventilator suggests to the clinician to consider the separation of the patient from the ventilator.
17
1.2.2 Operator Inputs
The operator input refers to the parameters of the ventilator setting by the operator. Each mode of ventilation has particular features, some of which can be adjusted by the operator. The effect of each parameter on the lung is better understood knowing the equation of motion (chapter 2). This explains that a change of one parameter will lead to changes in others (i.e., in volume control, for the same respiratory characteristics changing the tidal volume will cause a change in peak airway pressure).
The operator can control different types of variables during the ventilation:
1) Inspired Gas Concentration
A mechanical ventilator has the capacity of delivering different mixtures of gas. Most of ventilators allow the administration of specific concentrations of oxygen, while only a few allow the administration of helium, nitric oxide, or anesthesia gases
Oxygen
Oxygen is the most common gas administered to patients undergoing mechanical ventilation. The oxygen percentage in the inspired gas ( FiO2 ) can be regulated in most
ventilators by means of a direct adjustment of a specific control (21% to 100%). The following formula can calculate the flow of oxygen to achieve a desired oxygen concentration:
𝑂2 𝑟𝑒𝑞𝑢𝑖𝑟𝑒𝑑 = 𝑅𝑅 × 𝑉𝑡 × (𝑑𝑒𝑠𝑖𝑟𝑒𝑑 𝐹𝑖𝑂2 × 0.21)
0.79 (1.5)
where O2 required is 100% oxygen flow in L/min, RR is the respiratory rate in
breaths/min, Vt is the tidal volume in liters and the FiO2 is the patient O2 concentration
desired in decimal format (i.e., 30% = 0.3). An oxygen analyzer should be used to confirm the measurements. Changes in oxygen flow, breathing rate, or tidal volume brings a change in the FiO2.
Heliox
Mixtures of helium and oxygen (heliox, HeO2 ) instead of air and oxygen are occasionally
18
less dense than air so, the decrease in density interferes with flow measurements, inspiratory and expiratory valve accuracy, and gas mixing.
Nitric Oxide
Inhaled nitric oxide (NO) is used as selective pulmonary vasodilator for patients with pulmonary hypertension, life-threatening hypoxia, or right-heart failure. Most of devices to deliver NO are custom made and required the use of mixing chambers, stand-alone NO/nitric dioxide monitors, and manual titration of the gas flow.
2) Trigger Variables
A ventilator-assisted breath can be triggered by the machine or the patient. A machine-triggered breath is defined by the start of the inspiratory phase, independent of any signal from the patient. The operator typically sets a breath frequency for machine-triggered breaths. A patient triggered breath is one for which inspiration is started solely by a signal from the patient. The key variable for patient triggering is sensitivity, or the magnitude of the patient signal required to initiate inspiratory flow. The patient signal can be obtained from measuring the airway pressure, flow, volume, electromyogram (EMG), abdominal motion, etc.
Time
Time is measured by the internal ventilator processor. The next breath is time triggered (in the absence of a patient trigger event) when the expiratory time has reached the threshold to maintain a set respiratory rate (e.g., if the set rate is 10 breaths per minute and the inspiratory time is set at 1 second, then the expiratory time is 5 seconds).
Pressure
The patient inspiratory effort causes a drop in pressure in the airway and the circuit. Inspiration starts when pressure falls below the preset “sensitivity” threshold. The site of measurement will have an impact on the performance of the device. The farther the sensor is from the signal source, the longer the potential time delay.
Flow
Flow triggering is based on the detection of a change in a constant, small, baseline (bias) flow through the patient circuit. The operator sets a flow sensitivity threshold. When the change in flow reaches the threshold, a breath is delivered. The changes in flow are
19
detected at the expiratory valves or by a flow sensor in the patient circuit. The ventilator measures the flow from the ventilator and from the patient. In a closed circuit, the two flow values should remain equal in the absence of patient effort.
Volume
A breath may be triggered when a preset volume is detected as the result of a patient inspiratory effort. This is similar to flow triggering but using volume has the theoretical advantage of being less susceptible to signal noise (i.e., integrating flow to get volume cancels out some noise because of flow oscillations).
3) Target Variables
During inspiration, the variable limiting the magnitude of any parameter is called the target variable. A target is a predetermined goal of ventilator output. Within-breath targets are the parameters of the pressure, volume, or flow waveform
Peak Inspiratory Pressure (PIP)
The term inspiratory pressure is defined as the set change in airway pressure during inspiration relative to set end-expiratory airway pressure during pressure-control modes. The ventilator allows to the operator to set the PIP that can be achieved during the delivery of a mandatory breath. The goal is to prevent pressure peaks while maintaining the set tidal volume.
Positive End-Expiratory Pressure (PEEP)
PEEP is define as the elevation of the baseline pressure during any mode of ventilation and is generally a setting for a mode. The PEEP is established by the ventilator exhalation valve. Until recently, the selection of PEEP has been a relatively arbitrary process and the meaning of “optimum PEEP” is debatable, ,in the last years, Hamilton Medical has developed the INTELLiVENT system for the G5 ventilator that uses an algorithm for automatic targeting of PEEP. A closed-loop algorithm based on expert rules defines the response of the ventilator to measured ventilation variables, end-tidal carbon dioxide and pulse oximetry.
Rise Time
The speed with which the airway pressure reaches the set inspiratory pressure is called rise time. The rise time may be set by the operator or automatically adjusted based on a
20
computer algorithm. The name used to indicate pressure rise time varies by ventilator brand (e.g., inspiratory slope, P-ramp, plateau%, and slope rise time). Adjusting the rise time influences the synchronization between the patient and the ventilator secondary to changes in the initial inspiratory flow rate. The lower the rise time, the faster the pressurization rate and the higher the peak inspiratory flow. A higher initial inspiratory flow rate may decrease the work of breathing but can lead to patient discomfort and worse patient–ventilator synchrony.
Tidal Volume
The operator is required to enter a tidal volume in any volume-control mode. This may be a direct setting or an indirect one by setting frequency or minute ventilation. The ventilator will control the tidal volume and the pressure will be the dependent variable. A tidal volume target, however, may also be set when the mode uses adaptive targeting in pressure control. In such a case, inspiratory pressure is automatically adjusted between breaths by the ventilator to achieve an average measured tidal volume equal to the operator set target.
Minute Ventilation
In volume-control modes, the minimum minute ventilation is set by entering the tidal volume and respiratory rate. This assures that the patient receives a minimum amount of ventilatory support. The operator presets the target minute ventilation by setting tidal volume and frequency. The ventilator then monitors the total minute ventilation as the sum of the minute ventilations generated by mandatory and spontaneous breaths. If the total minute ventilation is below the target value, the mandatory breath frequency will increase.
4) Cycles Variables
The inspiratory phase of a mechanical breath ends (cycles off) when a threshold value for a measured variable is reached. This variable is called the cycle variable , and it ends the inspiratory time. Cycling is characterized by the initiation of expiratory flow. The cycle variable may be preset (by the operator or the ventilator manufacturer), or automatically defined by the ventilator.
Inspiratory Time
Inspiratory time is defined as the period from the start of inspiratory flow to the start of expiratory flow. Inspiratory time has two components; inspiratory flow time (period when inspiratory flow is above zero) and inspiratory pause time (period when flow is zero). In
21
pressure-controlled or volume-controlled breaths, the inspiration is cycled (terminated) when the set inspiratory time elapses. Inspiratory time is usually an operator-entered input but some modes of ventilation can automatically set it and change it based on expert rules and closed-loop feedback algorithms.
Inspiratory Pause
The inspiratory pause is the period during which flow ceases but expiration has not begun. The expiratory valves are closed during this period. The inspiratory pause time is part of the inspiratory time. When set directly, pause time may be entered in seconds or as a percentage of the inspiratory time. When it is activated, most ventilators display a plateau pressure (i.e., static inspiratory hold pressure). Increasing the inspiratory pause time increase the mean airway pressure and thus the time the lung is exposed to volume and pressure. This may have a positive effect on oxygenation and ventilation by increasing mixing time and decreasing dead space.
I:E Ratio and Duty cycle
I:E is the ratio of inspiratory time to expiratory time.
𝐼: 𝐸 = 𝑇𝐼: 𝑇𝐸 =
𝑇𝐼
𝑇𝐸 (1.6)
The I:E can also be described as the duty cycle or percent inspiration. In engineering, the duty cycle is defined as the time spent in active state as a fraction of the total time. In mechanical ventilation, the active state is the inspiratory time, and the total time is the sum of the inspiratory and expiratory times. It is expressed as a percentage. The larger the percentage, the longer the inspiratory time in relation to the total cycle time.