Contents lists available atScienceDirect
Journal of Clinical & Translational Endocrinology
journal homepage:www.elsevier.com/locate/jcteOriginal research
In
fluence of peroxisome proliferator-activated receptor-γ exon 2 and exon 6
and insulin receptor substrate (IRS)-1 Gly972Arg polymorphisms on insulin
resistance and beta-cell function in southern mediterranean women with
polycystic ovary syndrome
Annalisa Giandalia
a, Maria Angela Pappalardo
a, Giuseppina T. Russo
a, Elisabetta L. Romeo
a,
Angela Alibrandi
b, Flavia Di Bari
a, Roberto Vita
a,⁎, Domenico Cucinotta
a, Salvatore Benvenga
a,c,daDepartment of Clinical and Experimental Medicine, University of Messina, Messina, Italy bDepartment of Economics, University of Messina, Viale Gazzi, 98125 Messina, Italy
cMaster Program on Childhood, Adolescent and Women’s Endocrine Health, University of Messina, Viale Gazzi, 98125 Messina, Italy
dInterdepartmental Program of Molecular & Clinical Endocrinology, and Women’s Endocrine Health, University Hospital Policlinico G. Martino, Viale Gazzi, 98125
Messina, Italy
A R T I C L E I N F O
Keywords:
Polycystic ovary syndrome
Peroxisome proliferator-activated-receptor-gamma
Insulin receptor substrate-1 Polymorphisms
A B S T R A C T
Background and objective: The Pro12Ala (exon 2) and His447His (exon 6) polymorphisms of PPAR-γ, and Gly972Arg polymorphism of IRS-1 have been implicated in insulin resistance (IR) and adiposity. Our aim was to investigate the influence of these polymorphisms on metabolic features of polycystic ovary syndrome (PCOS). Methods: Fifty-three PCOS women and 26 control women underwent a clinical and biochemical evaluation, including a 75-g oral glucose tolerance test. Insulin secretion and insulin sensitivity indices were calculated. Results: Frequencies of PPAR-γ polymorphisms did not differ from those predicted by the Hardy-Weinberg equilibrium. Instead, the IRS-1 Gly972Arg allele was significantly more frequent in the PCOS group compared to controls. The most frequent allelic combinations were IRS1+/exon2-/exon6- (which prevailed in PCOS) and IRS-1-/exon2-/exon6- (which prevailed in controls). Among PCOS women, compared with the wild type pa-tients, carriers of the Gly972Arg IRS-1 allele had lower E2 levels, while carriers of the Pro12Ala PPAR-γ (exon 2) allele had lower free testosterone levels. No other significant relationships were noted. When compared with the wild type, in PCOS group IR and beta-cell function were: (i) trendwise greater in carriers of the variant IRS-1 allele; (ii) trendwise lower in carriers of the variant PPAR-γ exon 6 allele; (iii) significantly lower in carriers of the variant PPAR-γ exon 2 allele.
Conclusions: Our data support the protective influence of PPAR-γ-exon 2 and exon 6 variants on IR and beta cell function, whereas IRS-1 polymorphism is associated with an unfavorable metabolic profile. However, these associations do not fully explain the high metabolic risk associated with PCOS.
Introduction
PCOS is one of the most common endocrinopathies, as it affects 5–10% of the female population in the reproductive age[1]. In addition to the variable combinations of hirsutism, menstrual cycle irregularities and ultrasonographic ovarian abnormalities, PCOS is characterized by an insulin resistance-associated metabolic derangement [2]. Thus,
among PCOS women, the rate of metabolic syndrome is up to 46%, the rate of obesity is over 50%, and the risk of type 2 diabetes mellitus is approximately 7-fold greater compared with non-PCOS women[2].
Insulin resistance has been implicated in the pathogenesis of PCOS [3]. Insulin resistance leads to the development of metabolic syndrome and independently increases the cardiovascular risk[3]. Therefore, the AE-PCOS Society has advised to assess the cardiovascular risk in all
https://doi.org/10.1016/j.jcte.2018.05.002
Received 19 February 2018; Received in revised form 21 May 2018; Accepted 23 May 2018
⁎Corresponding author at: Department of Clinical and Experimental Medicine, University of Messina, Viale Gazzi, 98125 Messina, Italy.
E-mail address:[email protected](R. Vita).
Abbreviations: 17-OHP, 17-hydroxyprogesterone; E2, 17β-estradiol; AE-PCOS, Androgen Excess and Polycystic Ovary Syndrome Society; BMI, body mass index; DI, disposition index; FSH, follicular stimulating hormone; IRS, insulin receptor substrate; LDL, low-density lipoprotein; LH, luteinizing hormone; HDL, high-density lipoprotein; HOMA-IR, homeostasis model assessment; IGI, insulinogenic index; OGTT, oral glucose tolerance test; PCOS, polycystic ovary syndrome; PCR, polymerase chain reaction; PPAR-γ, peroxisome proliferator activated receptor-γ; SHBG, sex hormone binding globulin
2214-6237/ © 2018 The Authors. Published by Elsevier Inc. This is an open access article under the CC BY-NC-ND license (http://creativecommons.org/licenses/BY-NC-ND/4.0/).
PCOS women[4]. Particularly, AE-PCOS suggested to evaluate the lipid profile (total cholesterol, LDL cholesterol, HDL cholesterol and trigly-cerides) and the carbohydrate metabolism (a 2-h 75 g glucose chal-lenge) at least every two years[4].
Although insulin resistance is related to obesity, PCOS women are insulin resistant independently of body mass index (BMI). Indeed, about half of them are resistant to insulin irrespective of ethnicity[5]. Hy-perinsulinemia ensues in order to override the reduced peripheral in-sulin sensitivity. Only in PCOS women, but not in other hyper-insulinemic states (e.g. type 2 diabetes mellitus) hyperinsulinemia increases the ovarian and adrenal androgen production and androgen bioavailability by reducing circulating levels of SHBG[6]. This insulin-related hyperandrogenism implies that: i) insulin-sensitizing agents ameliorate hyperandrogenism[7]; ii) beta-cell dysfunction can be used as an independent predictor of hyperandrogenemia[8].
PCOS and insulin resistance share a common genetic background, as a number of polymorphisms of genes involved in insulin resistance were found in PCOS women. The most common polymorphisms are those involved in insulin signaling, such as insulin gene[9]and genes en-coding the IRS[10,11]. For instance, the Gly972Arg variant of IRS-1 gene has been associated to insulin resistance, type 2 diabetes, and PCOS [10]. We have found a significantly greater prevalence of this variant in PCOS women compared with controls[10,11]. A probable role in PCOS pathogenesis can be played by the calpain 10 gene poly-morphisms[12]and the PPAR-γ polymorphisms[13].
However, studies exploring the association with PCOS of either one of the two single-nucleotide polymorphisms of the PPAR-γ gene, viz. Pro12Ala (C/G replacement in exon 2) and His447His (C/T replace-ment in exon 6), have yielded contradictory results[14–16].
PCOS is a multifactorial disorder in which various gene-gene or gene-environment interactions may influence the pleomorphic pheno-type, including the metabolic profile. Hence, in the present study we have evaluated i) the prevalence of the two aforementioned PPAR-γ variants (Pro12Ala and His447His) and the Gly972Arg IRS-1 variant, and their relative combinations; ii) the influence of these polymorph-isms on phenotype, with respect to hyperandrogenism, insulin re-sistance and beta-cell function.
Materials and methods Study subjects
Fifty-three consecutive Caucasian women with PCOS attending the Endocrine outpatient clinic of the Department of Clinical and Experimental Medicine at our University hospital were recruited. All women were born and stably resident in the two southernmost regions of Italy, namely Sicily and Calabria. PCOS was diagnosed according to the Rotterdam criteria[1]. Women were excluded if they: i) had hy-perandrogenic conditions other than PCOS (such as non-classical con-genital adrenal hyperplasia, Cushing’s syndrome, and androgen-se-creting tumors); ii) had either type 1 or type 2 diabetes mellitus; iii) had either hypothyroidism or hyperthyroidism; iv) had been treated with contraceptive pills for the previous 6 months; v) had been treated with insulin-sensitizers (including metformin and inositol) for the previous 6 months. Twenty-six age-matched healthy women including nurses, medical students and young clinicians, were recruited as controls. They had neither PCOS nor other conditions mentioned above in the exclu-sion criteria. All participants gave their informed consent before en-tering the study, which was approved by the Internal Review Board. Methods
Clinical evaluation
Participants underwent a complete physical examination, including assessment of weight, height, BMI, and Ferriman-Gallwey score.
Basal biochemical measurements
Women underwent a fasting blood sampling in the morning (7:30–8:30 a.m.) between the second and the seventh day of the men-strual cycle. Metabolic parameters (plasma glucose, insulin, total cho-lesterol, HDL-cholesterol and triglycerides levels), SHBG, and hormonal parameters (FSH, LH, total testosterone, free testosterone, calculated free testosterone [using the formula available at http://issam.ch/ freetesto.htm], E2,Δ4-androstenedione, 17-OHP) were evaluated.
Indices of insulin-resistance andβ-cell function
A 2-h 75 g OGTT with blood sampling for glucose and insulin at baseline (time 0), 30, 60, 90 and 120 min was performed. Insulin re-sistance was evaluated by using the HOMA-IR and the Matsuda index (also known as insulin sensitivity index). HOMA-IR was calculated with the following formula: [glycemia at 0 min (mg/dl) × insulin at 0 min (μU/ ml)]/405. Matsuda index was calculated with the formula: (10,000/√ [(glycemia at 0 min (mg/dl) × insulin at 0 min (μU/ml) × (mean gly-cemia during OGTT x mean insulin during OGTT)].
β-cell function was evaluated by using the IGI with the formula [(in-sulin at 30 min)− (insulin at 0 min)]/[(glycemia at 30 min) − (glycemia at 0 min)]. We also calculated the DI, a composite measure of β-cell function. DI is calculated multiplying IGI by the Matsuda index.
Genetic analysis
Genomic DNA was extracted from peripheral blood mononuclear cells using the QIAamp DNA blood Mini Kit (Qiagen, Venlo, The Netherlands) according to the manufacturer’s recommended protocol. Gene polymorphisms were analyzed by PCR and restriction fragment length polymorphism.
IRS-1 polymorphism was genotyped as previously described[10]. Briefly, a 198 bp DNA sequence was amplified by PCR using oligonu-cleotide primers 5′-CTTTCCACAGCTCACCTTC-3′ (forward) and 5′-GTTAGGCCTGCAAATGTCTA-3′ (reverse). PCR products were di-gested with 2μL of the restriction enzyme SmaI (BioLabs, New England, USA) and the fragments were separated by 1.5% agarose gel electro-phoresis and visualized by UV illumination, after ethidium bromide staining. Genotype was indicated by the size of the resolved fragments: homozygosity (Arg972Arg on both alleles) by the undigested 198 bp fragment, heterozygosity (Gly972Gly on one allele and the variant Gly972Arg on the other allele) by the undigested 198 bp fragment plus the 171 bp and 27 bp fragments resulting from digestion, and wild-type (Gly-972Gly on both alleles) by the absence of the 198 band and the presence of the digested products (that is, the 171 bp and the 27 bp bands).
PPAR-γ gene polymorphisms in exon 2 (C/G transversion, resulting in Pro12Ala at protein level) and exon 6 (the silent C/T transition, re-sulting in maintenance of His at residue 447 of the protein) were ana-lyzed as described by Orio et al.[17]. Briefly, PPAR-γ exon-2 poly-morphism sequence was amplified by PCR using these primers: 5_ CTGATGTCTTGACTCATGGG_3 (forward) and 5_GGAAGACAAACTAC AAGAGC_3 (reverse). The PCR product of 295 bp was digested using HgaI restriction endonuclease. Generation of the 178 and 117 bp frag-ments identifies the mutant homozygous GG genotype. In contrast, the wild type CC genotype is identified by the undigested 295 bp product. Primers used for PPAR-γ exon-6 were 5_CCAGAAAATGACAGACCTCA GACA_3 (forward) and 5_CAGAATAGTGCAACTGGAAGAAGG_3 (re-verse). The resulting 181 bp PCR product was subjected to digestion by the restriction enzyme PmlI. The wild type CC genotype was identified by digested products 142 bp and 39 bp fragments, whereas the variant T allele was identified by the undigested 181 bp product.
Regardless of the polymorphism investigated, PCR products and digestion products were separated on 3% agarose gel electrophoresis and visualized under UV light after ethidium bromide staining of the gel.
Statistical analysis
Statistical analyses were performed using SPSS version. 11.0 (Statistical Package for the Social Sciences, Chicago, IL, USA) for Windows. Numerical data are given as m ± SD and categorical vari-ables as number and percentage.
Since the majority of the examined variables were distributed nor-mally, as verified by the Kolmogorov-Smirnov test, parametric tests were used. Differences between m ± SD of continuous variables were addressed by the two-tailed Student’s t–test, while differences between proportions of categorical variables by theχ2test or the Fisher’s exact
test, as appropriate.
Partial correlation coefficients between E2 levels and all study variables were analyzed, controlling for BMI. A formal test for inter-action between IRS-1genotype and E2 levels on metabolic parameters was performed to determine whether E2 levels modified the association between genotype and study variables. Finally, the possible dependence of IRS-1*E2 PPAR-γ exon 2*E2 PPAR-γ exon 6*E2 on each of the ex-amined variables was estimated by univariate linear regression models, both in the PCOS group and in the control group.
All statistical comparisons were two-tailed, and a P value < 0.05 was considered statistically significant; a P value comprised between 0.05 and 0.10 was considered borderline significant.
Results
Clinical characteristics of women with PCOS
Table 1 summarizes the relevant characteristics of the 53 PCOS women and the 26 controls. As expected, PCOS women were heavier, had worse clinical hirsutism, higher biochemical androgen levels and worse metabolic profile (i.e. greater fasting insulin and HOMA-IR,
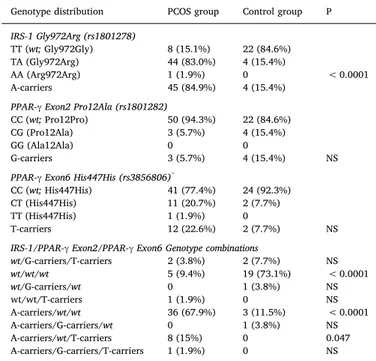
greater triglycerides and lower HDL-cholesterol levels). IRS-1, PPAR-γ exon 2 and exon 6 polymorphisms: distribution in PCOS andcontrols Because mutations in homozygosity were detected only in two PCOS women (one for the AA alleles of IRS-1, and one for the TT alleles of exon 6 of PPAR-γ), these variants were pooled with the corresponding heterozygous alleles for description and statistics. Data are summarized inTable 2.
PCOS women showed a significantly higher frequency of the Gly972Arg and Arg972Arg combined genotypes of IRS-1 as compared to control women (84.9% vs. 15.4%, P < 0.0001). In terms of allele frequency, the rates of the A allele in the two groups of women were 45/106 (42.4%) vs. 4/52 (7.7%, P < 0.0001; OR = 8.8, 95% CI = 3.0–26.3). The allelic distribution of the IRS-1 genotypes was in Hardy-Weinberg equilibrium in the control group, but not in the PCOS group.
Conversely, both PPAR-γ exon 2 and exon 6 polymorphisms fre-quencies did not differ from those predicted from the Hardy-Weinberg equilibrium both in PCOS women and in controls. The frequency of the PPAR-γ exon-2 rare G allele was 5.7% and 15.4% in control women (P = 0.21; OR = 0.33, 95% CI = 0.07–1.6), and that of the PPAR-γ exon-6 rare T allele 20.7% in PCOS women and 7.7% in control women (P = 0.20; OR = 3.2, 95% CI = 0.7–15.8). In brief, in the PCOS group compared to the control group, the IRS-1 A allele and the PPAR-γ exon-6T allele were overrepresented, while the PPRAγ exon-2 G allele was under-represented.
The bottom part ofTable 2shows the possible genetic combinations, and how they associate with the presence or absence of PCOS. Parti-cularly evident is the risk for PCOS associated with the heterozygous/ homozygous presence of A at codon 972 of the IRS-1 gene, and the protection associated with the heterozygous/homozygous presence of G at codon 12 and T at codon 447 of the PPAR-γ gene. Of 24 women (PCOS + controls) who were wild type for all three codons (and therefore were homozygous carriers of G, C and C at codons 972 of IRS-Table 1
Characteristics of PCOS women and controls. Data are expressed as m ± SD. Only P values < 0.05 or P values between 0.05 and 0.10 (italicized) are pre-sented. P1 indicates P values adjusted for BMI.
PCOS group Control group P P1
n 53 26 Age (years) 22.85 ± 5.30 25.00 ± 5.55 – BMI (kg/m2) 29.13 ± 8.32 24.92 ± 4.57 0.02 Hormonal profile Ferriman Score 11.74 ± 4.61 8.38 ± 3.11 0.001 0.004 FSH (mIU/ml) 5.59 ± 1.76 6.06 ± 1.70 – LH (mIU/ml) 7.71 ± 5.27 7.20 ± 4.64 – 17-β -estradiol (pg/ml) 45.52 ± 21.20 42.82 ± 17.12 – 17-OHPg (ng/ml) 1.31 ± 0.51 1.03 ± 0.46 0.04 0.045 SHBG (nmol/l) 37.98 ± 21.81 41.68 ± 18.28 – – Δ 4AND (ng/ml) 2.38 ± 1.23 2.30 ± 1.40 – Total testosterone (ng/dl) 69.41 ± 28.79 54.19 ± 21.45 0.02 0.068 Calculated free testosterone (pg/ml) 1.30 ± 0.83 0.94 ± 0.47 0.05 0.05 Free testosterone (pg/ml) 2.53 ± 1.52 1.57 ± 0.84 0.004 0.038 Metabolic parameters
Fasting plasma glucose (mg/dl)
76.79 ± 9.46 82.38 ± 13.24 0.03 0.005
Fasting insulin (mU/L) 12.87 ± 9.03 7.74 ± 4.70 0.01 0.071 Insulin-resistance HOMA-IR 2.48 ± 1.88 1.45 ± 1.00 0.01 – Matsuda index 5.11 ± 3.39 5.14 ± 3.10 – Β- cell function Insulinogenic index 1.90 ± 2.57 2.16 ± 1.30 – Disposition Index 7.57 ± 8.80 10.36 ± 7.67 – Lipid Profile Total cholesterol (mg/dl) 173.20 ± 41.09 193.54 ± 35.74 0.04 0.017 HDL cholesterol (mg/dl) 56.14 ± 12.81 66.44 ± 11.08 0.002 0.005 Triglycerides (mg/dl) 80.94 ± 42.43 68.85 ± 21.76 – – Table 2
Genotype distribution for IRS-1, PPAR-γ exon 2 and exon 6 alleles, and related combinations in PCOS women and controls. NS = not significant P value; wt = wild-type homozygotes. Only P values < 0.05 or P values between 0.05 and 0.10 (italicized) are presented. P1 indicates P values adjusted for BMI.
Genotype distribution PCOS group Control group P
IRS-1 Gly972Arg (rs1801278)
TT (wt; Gly972Gly) 8 (15.1%) 22 (84.6%) TA (Gly972Arg) 44 (83.0%) 4 (15.4%)
AA (Arg972Arg) 1 (1.9%) 0 < 0.0001 A-carriers 45 (84.9%) 4 (15.4%)
PPAR-γ Exon2 Pro12Ala (rs1801282)
CC (wt; Pro12Pro) 50 (94.3%) 22 (84.6%) CG (Pro12Ala) 3 (5.7%) 4 (15.4%)
GG (Ala12Ala) 0 0
G-carriers 3 (5.7%) 4 (15.4%) NS PPAR-γ Exon6 His447His (rs3856806)*
CC (wt; His447His) 41 (77.4%) 24 (92.3%) CT (His447His) 11 (20.7%) 2 (7.7%) TT (His447His) 1 (1.9%) 0
T-carriers 12 (22.6%) 2 (7.7%) NS IRS-1/PPAR-γ Exon2/PPAR-γ Exon6 Genotype combinations
wt/G-carriers/T-carriers 2 (3.8%) 2 (7.7%) NS wt/wt/wt 5 (9.4%) 19 (73.1%) < 0.0001 wt/G-carriers/wt 0 1 (3.8%) NS wt/wt/T-carriers 1 (1.9%) 0 NS A-carriers/wt/wt 36 (67.9%) 3 (11.5%) < 0.0001 A-carriers/G-carriers/wt 0 1 (3.8%) NS A-carriers/wt/T-carriers 8 (15%) 0 0.047 A-carriers/G-carriers/T-carriers 1 (1.9%) 0 NS
* The exon 6 polymorphism of PPAR-γ is a silent one, in that the C to T nucleotide substitution does not change the amino acid encoded.
1, 12 and 447 of PPAR-γ), 19 (79.2%) were PCOS-free. Instead, of 38 women who were wild type for the two codons of PPAR-γ but hetero-zygous/homozygous for the IRS-1 codon, only 3 (7.9%) were PCOS-free. However, carrying the T-allele of the PPAR-γ exon-6 poly-morphism is particularly risky for PCOS because there were 10 such women, excluding the 4 women who were so in association with the G-allele of the PPAR-γ exon-2 polymorphism and the G-G-allele carrier of IRS-1 gene (wild type). Indeed, all 10 women (100%) had PCOS (Table 2).
Hormonal and metabolic parameters according to IRS-1, PPAR-γ exon 2 and exon 6 polymorphisms distribution in women with PCOS
Table 3 summarizes the clinical, hormonal and metabolic para-meters in PCOS women as a whole, and PCOS women stratified di-chotomically (wild type vs. heterozygous/homozygous carriers of the variant) for each polymorphism disregarding the status for the other two polymorphisms. Taking into account the unequal size of any two strata, only two comparisons yielded a statistically significant differ-ence: E2 levels (IRS-1 polymorphism) and measured free testosterone levels (PPAR-γ exon 2 polymorphism). Because of only three carriers of the exon 2 variant of PPAR-γ, no inference can be drawn from the presence/absence of this polymorphism per se, disregarding the other two polymorphisms studied here. We explored further the association concerning E2 levels. In PCOS women, significant interactions were noted for IRS-1 polymorphism (IRS-1*E2) with DI (P for interac-tion = 0.048). Significant interactions were also noted for PPAR-γ exon 2 polymorphism (PPAR-γ exon 2*E2) with fasting insulin levels (P = 0.026) and HOMA-IR (P = 0.015), and trend wise interaction for PPAR-γ exon 6 polymorphism (PPAR-γ exon 6*E2) with fasting insulin levels (P = 0.052).
Carriers of the IRS-1 polymorphisms had greater serum levels of fasting insulin (+16.9%), and triglycerides (+21.4%) compared to the wild types. The worse glycometabolic status of the IRS-1 variant car-riers compared to noncarcar-riers (wild types) can be appreciated by the
greater HOMA-IR (+17.1%), greater compensatory insulin secretion, and greater both DI (+41.0%) and IGI (+28.9%) (Table 3).
In sharp contrast, carriers of the PPAR-γ exon 6 variant had lower levels of fasting insulin (−36.3%) and triglycerides (−26.3%) com-pared to noncarriers. The better glycometabolic status of the PPAR-γ exon 6 variant carriers compared to noncarriers is reflected by lower fasting insulin (−36.3%), lower HOMA-IR (−36.2%), lower DI and IGI (−32.7% and −42.7%), and greater Matsuda index (+50.6%). In turn, carriers of the PPAR-γ exon 6 variant had lower levels of fasting insulin (−32.1%), triglycerides (−23.8%), HOMA-IR (−33.2%), DI (−36.2%) and IGI (−39.0%) compared to carriers of the IRS-1 variant (Table 3). However, exon 6 PPAR-γ wild type PCOS women had greater levels of fasting insulin (+24.5%) and triglycerides (+25.5%), greater insulin resistance (HOMA-IR, +25%), greater DI (+40.8%) and greater IGI (+43.4%) compared to the IRS-1 wild type PCOS women. A similar trend, but more attenuated for the carbohydrate metabolism was true for the comparison between the 50 PCOS noncarriers of the PPAR-γ exon 2 variant and the 8 PCOS women noncarriers of the IRS-1 variant (fasting insulin, +14.8%; triglycerides, +19.0%; HOMA-IR, +14.3%; DI, +24.4%; IGI, +5.3%).
Hormonal and metabolic parameters based on combinations of IRS-1, PPAR-γ exon 2 and exon 6 polymorphisms in women with PCOS
Omitting the combination groups with 2 or fewer women,Table 4 confirms what shown inTable 3for the most favorable glycometabolic profile in carriers of the PPAR-γ exon 6 variant. The benefit associated with the IRS-1+/PPAR-γ exon 2−/PPAR-γ exon 6+ combination is
amplified by the lowest BMI, lowest triglycerides and highest HDL cholesterol. Furthermore, confirming data inTable 3, this combination was associated with the lowest E2 levels. Because the 8 women with this combination also had the highest levels of free testosterone, this could explain why they had the greatest degree of hirsutism (i.e. greatest Ferriman-Gallwey score) (Table 4).
Table 3
Clinical, hormonal and metabolic parameters in PCOS women stratified based on IRS-1, PPAR-γ exon 2 and PPAR-γ exon 6 genotypes. Data are expressed as m ± SD.
All IRS-1 PPAR-γ exon2 PPAR-γ exon 6
Wild type A-carriers Wild type G-carriers Wild type T-carriers
N 53 8 45 50 3 41 12 BMI (kg/m2) 28.62 ± 7.63 31.63 ± 12.69 28.68 ± 7.40 29.26 ± 8.40 27.0 ± 7.94 29.28 ± 7.77 28.60 ± 10.34 Ferriman Score 11.84 ± 4.69 11.75 ± 2.19 11.73 ± 4.93 11.98 ± 4.56 7.67 ± 4.04 11.51 ± 4.59 12.50 ± 4.80 FSH (mIU/ml) 5.60 ± 1.79 5.59 ± 1.93 5.59 ± 1.76 5.63 ± 1.80 5.01 ± 1.12 5.43 ± 1.61 6.0 ± 2.14 LH (mIU/ml) 7.76 ± 5.34 7.75 ± 5.20 7.70 ± 5.38 7.73 ± 5.39 7.30 ± 3.82 7.32 ± 5.26 8.68 ± 5.46 17β E2 (pg/ml) 42.45 ± 21.65 50.69 ± 8.16 40.93 ± 22.62* 42.56 ± 21.76 41.90 ± 11.79 43.33 ± 22.78 40.03 ± 15.97 17-OHPg (ng/ml) 1.31 ± 0.51 1.23 ± 0.57 1.32 ± 0.51 1.31 ± 0.50 1.30 ± 0.90 1.32 ± 0.51 1.27 ± 0.54 SHBG (nmol/l) 38.83 ± 21.88 38.45 ± 13.10 37.89 ± 23.29 37.73 ± 22.36 41.70 ± 12.60 37.92 ± 22.63 38.15 ± 20.1 Δ4 AND (ng/ml) 2.34 ± 1.24 2.93 ± 1.80 2.29 ± 1.12 2.40 ± 1.25 2.03 ± 0.90 2.38 ± 1.33 2.40 ± 0.87 Tot. testost (ng/dl) 67.47 ± 27.66 73.53 ± 33.79 68.74 ± 28.29 69.42 ± 27.38 69.25 ± 55.30 70.75 ± 31.66 65.17 ± 17.19 Calc Free T (pg/ml) 1.22 ± 0.78 1.14 ± 0.68 1.33 ± 0.86 1.30 ± 0.82 1.20 ± 1.54 1.33 ± 0.89 1.20 ± 0.65 Free T (pg/ml) 2.36 ± 1.34 2.58 ± 1.33 2.51 ± 1.57 2.65 ± 1.50 0.90 ± 0.36** 2.54 ± 1.52 2.48 ± 1.59 FBG (mg/dl) 76.35 ± 9.36 77 ± 12.35 76.76 ± 9.02 77.06 ± 9.61 72.33 ± 5.51 76.34 ± 9.51 78.33 ± 9.53 F. insulin (mU/L) 12.80 ± 9.20 11.26 ± 5.50 13.16 ± 9.54 12.93 ± 9.22 11.88 ± 6.18 14.02 ± 9.67§ 8.93 ± 4.87# HOMA-IR 2.45 ± 1.91 2.16 ± 1.22 2.56 ± 2.05 2.47 ± 1.95 2.15 ± 1.24 2.68 ± 2.08§ 1.71 ± 0.93# Matsuda index 5.21 ± 3.44 4.40 ± 1.93§ 5.34 ± 3.63 5.28 ± 3.52 4.27 ± 2.45 4.70 ± 2.59 7.08 ± 5.36# Insulinog. index 1.98 ± 2.61 1.52 ± 1.28 2.05 ± 2.78 1.60 ± 1.14 6.68 ± 8.75 2.18 ± 2.91§ 1.25 ± 0.78# Disposit. index 7.90 ± 8.88 5.41 ± 4.51 8.32 ± 9.40§ 6.73 ± 5.29 22.7 ± 26.6 7.88 ± 9.06 5.30 ± 3.31# Total chol. (mg/dl) 173.8 ± 41.7 168.0 ± 15.1 174.2 ± 44.5 173.4 ± 42.1 170.7 ± 15.5 172.3 ± 28.3 176.1 ± 68.8 HDL chol. (mg/dl) 56.0 ± 12.69 55.38 ± 10.23 56.37 ± 13.65 56.27 ± 13.2 54.0 ± 0.0 56.45 ± 13.65 54.67 ± 8.38 Triglycer. (mg/dl) 80.96 ± 42.9 68.75 ± 35.78 83.44 ± 43.66 81.82 ± 43.1 68.0 ± 34.83 86.25 ± 45.4 63.55 ± 25.21
* P = 0.029 between wild type vs. heterozygous/homozygous carriers of the IRS-1 polymorphism. ** P = 0.001 between wild type vs. heterozygous/homozygous carriers of the PPAR-γ exon2 polymorphism.
# Favorable glycometabolic indices, namely lower fasting insulin, HOMA-IR and higher Matsuda index values, lower insulinogenic index and lower disposition
index.
§ Unfavorable glycometabolic indices, namely higher fasting insulin, HOMA-IR and lower Matsuda index values, higher insulinogenic index and higher disposition
Association of genotypes with BMI
Because of the frequent presence of overweight/obesity in PCOS women, we wished to assess whether any single polymorphism was more likely to occur in PCOS women with ideal weight (BMI < 25 kg/ m2) or abnormally greater weight (BMI≥ 25 kg/m2). While the IRS-1 variant is equally distributed between the two BMI categories, the two PPAR-γ variants are approximately 3-fold more likely to be found in PCOS women with normal BMI (Table 5).
Discussion
PCOS is a polygenic, multifaceted disease with a frequent metabolic component (overweight/obesity, increased serum levels of triglycer-ides, fasting insulin and decreased insulin sensitivity)[2]. Among the various possible phenotypes resulting from combinations of clinical, endocrine and metabolic abnormalities, thefinal phenotype will de-pend from the interaction of the environment with the genetic back-ground. As mentioned in the section“Introduction”. Introduction, IRS-1 and PPAR-γ have emerged as significant candidate genes in the pa-thogenesis of PCOS. IRS-1 gene encodes the substrate of insulin re-ceptor, which is crucial in insulin signaling [10]. PPAR-γ gene is
involved in adipocyte differentiation, glucose and lipid metabolism [13]. Indeed, each of three polymorphisms (Gly972Arg of IRS-1 gene, Pro12Ala [exon 2] and His447His [exon 6] of PPAR-γ gene) have been associated with PCOS and variably with its metabolic aspects [10,11,13–16].
In this regard, we have recently reported a higher frequency of IRS-1 Gly972Arg variant in PCOS women compared to controls, and a more unfavorable metabolic profile in carriers of this polymorphisms[10,11] (Supplementary Tables 1 and 2).
In the present study, we explored whether exon 2 and exon 6 PPAR-γ variants may contribute, alone or in combination with IRS-1 poly-morphism, to the metabolic derangements observed in PCOS women (Table 6).
Consistently with our previous works[10,11]we have confirmed the higher frequency of the IRS-1 gene variant among our PCOS women compared with controls, in contrast with the PPAR-γ exon 2 and exon 6 variants whose frequencies were comparable in the two groups and did not differ from the frequencies predicted by the Hardy-Weinberg equilibrium. In this regard, in Italian [17,18], Spanish [19], Greek [15,20,21], German[22], Polish[23], Chinese[24], Turkish[25], and Korean women[14]PCOS women the PPAR-γ exon 2 variant has been reported as frequent as in controls. In contrast with these studies, others reported an increased frequency of PPAR-γ exon 2 variant in nonPCOS women, suggesting a protective effect of this polymorphism[26–28]. Also, in contrast with Europeans PCOS women, in non European ones this effect was not found[29]. Particularly, one study[17]found that the Pro12Ala variant in PPAR-γ exon 2 does not influence BMI, as op-posed to two other studies [13,20].
A few studies have examined concurrently both PPAR-γ exon 2 and exon 6 polymorphisms [15,17,27,30]. One of these study [30]on a large cohort found no difference in the genotype frequencies between PCOS and controls and lower testosterone levels and milder insulin resistance in controls that carried the PPAR-γ exon 2 variant. In another study, Christopoulos reported lower testosterone levels in PCOS carriers of the PPAR-γ exon 6 variant[15].
Only three studies have investigated the relationship between the silent polymorphism His447His of PPAR-γ exon 6 in PCOS with dif-ferent conclusions. For instance, Antoine et al.[30]have found that this variant did not increase the risk of developing PCOS and was not as-sociated with insulin-related traits or androgen levels in women with PCOS, but instead, they demonstrated that controls carrying the His447His allele had improved insulin sensitivity and decreased mean levels of free and total testosterone. Another study carried out on an Italian cohort of PCOS women[17]reported a significant increase in T allele frequency but not an association of this allele with circulating androgens. Furthermore this variant influences BMI and leptin levels [17].
In our population the different allelic combinations were unequally distributed among PCOS and controls, the most frequent being the IRS1+/E6-/E2- combination, which regarded two-thirds of PCOS Table 4
Clinical, hormonal and metabolic characteristics of PCOS women based on combination of the IRS-1, PPAR-γ Exon 2 and PPAR-γ Exon 6 genotypes. The following combinations are not reported since regarded one or no patient: wt/ G-carrier/wt, wt/G-carrier/T-carrier, A-carrier/G-carrier/wt, A-carrier/G-car-rier/T-carrier. Data are expressed as m ± SD or mean for groups with≥3 patients or 2 patients, respectively.
IRS-1 wt wt A carrier A carrier
PPARγ, exon 2 wt wt wt wt
PPARγ exon 6 wt T carrier wt T carrier
N. 5 2 35 8 BMI (kg/m2) 31.2 ± 11.0 49.5 28.0 ± 6.57 27.77 ± 8.16 Ferriman Score 12.40 ± 2.51 10 11.51 ± 4.96 14.25 ± 4.51 FSH (mIU/ml) 6.18 ± 1.89 3.2 5.29 ± 1.60 6.71 ± 2.07* LH (mIU/ml) 10.17 ± 4.46 1.5 6.83 ± 5.45 10.14 ± 5.47 17β E2 (pg/ml) 54.42 ± 7.54 45.2 41.83 ± 25.0 36.73 ± 18.65 17-OHPg (ng/ ml) 1.58 ± 0.28 0.5 1.28 ± 0.55 1.37 ± 0.40 SHBG (nmol/l) 42.52 ± 5.02 19.7 38.74 ± 25.0 40.5 ± 22.0 Δ4 AND (ng/ ml) 3.08 ± 2.46 2.8 2.27 ± 1.17 2.26 ± 0.98 Total testost (ng/dl) 80.40 ± 38.81 79.5 64.57 ± 27.64 68.54 ± 9.73 Calc Free T (pg/ ml) 1.01 ± 0.79 1.6 1.22 ± 0.83 1.25 ± 0.65 Free T (pg/ml) 2.48 ± 1.09 3.8 2.33 ± 1.32 2.61 ± 1.56 FPG (mg/dl) 73.40 ± 13.35 85.5 76.36 ± 8.82 77.37 ± 10.0 F insulin (mU/ L) 11.19 ± 5.99 8.0 14.48 ± 10.51§ 8.42 ± 4.84# HOMA-IR 2.08 ± 1.42 1.7 2.79 ± 1.19§ 1.58 ± 0.89# Matsuda index 4.63 ± 2.17 5.4 4.76 ± 2.71§ 8.12 ± 6.32# Insulinog index 1.76 ± 1.44§ 0.26 1.70 ± 1.17 1.29 ± 0.84# Dispos Index 6.61 ± 5.14§ 1.4 6.38 ± 3.67 5.23 ± 3.06# Total chol (mg/ dl) 174.4 ± 15.6 159.5 172.6 ± 30.9 182.4 ± 85 HDL chol (mg/ dl) 58.0 ± 11.64 49.5 55.91 ± 14.2 60.5 ± 12.0 Triglyc (mg/dl) 77.60 ± 43.60 61 87.46 ± 47.82 68.57 ± 30.41
* 0.10 < P < 0.05 between wild type vs. heterozygous/homozygous car-riers of the variant.
# Favorable glycometabolic indices, namely lower fasting insulin, HOMA-IR
and higher Matsuda index values, lower insulinogenic index and lower dis-position index.
§ Unfavorable glycometabolic indices, namely higher fasting insulin,
HOMA-IR and lower Matsuda index values, higher insulinogenic index and higher disposition index. For this purpose, only groups of 5 or more women were considered.
Table 5
Clinical, hormonal and metabolic parameters in PCOS women according to BMI. NS = not significant (P > 0.10).
BMI < 25 kg/m2 BMI≥ 25 kg/m2 P N 19 34 BMI (kg/m2) 21.68 ± 1.92 33.29 ± 7.56 NS Age (years) 23.74 ± 6.31 22.35 ± 4.68 NS Genotype IRS-1 wt 3 (15.8%) 5 (14.7%) NS IRS-1 A-carriers 16 (84.2%) 29 (85.3%) NS PPAR-γ Exon2 wt 17 (89.5%) 33 (97.1%) NS PPAR-γ Exon2 G-carriers 2 (10.5%) 1 (2.9%) NS PPAR-γ Exon 6 wt 12 (63.2%) 29 (85.3%) 0.065 PPAR-γ Exon6 T-carriers 7 (36.8%) 5 (14.7%) 0.065
Table 6 Summary of the literature on the PPAR-ɣ exon 2 (Pro12Ala) and PPAR-ɣ exon 6 (His447His) polymorphisms. PPAR γ exon 2 Country PCOS criteria No of women Polymorphism (Pro12Ala + Ala/Ala) Comments First author [Ref.] Controls PCOS Controls PCOS Russo, this study Italy (south) Rotterdam 26 53 15.4% 5.7% This polymorphism was as frequent in PCOS women as in controls. Carriers of the polymorphism had lower free testosterone levels compared with wild types. Orio Jr [17] Italy NIH 100 100 5% 7% The frequency of the G allele of exon 2 was similar in PCOS and controls. BMI, leptin levels and leptin to BMI ration did not di ff er signi fi cantly between or within both groups. Orio Jr. [18] Italy NIH 120 120 4.2% 5.9% Genotype frequencies did not di ff er between PCOS and controls. No di ff erence in body mass index, plasma glucose and lipid levels, and HOMA-IR was observed between and within genotype groups in PCOS and control women. Korhonen [26] Finland Anovulation and PCO 115 135 19.1% 12.6% The frequency of this variant was signi fi cantly reduced in PCOS women. Also, genotype distributions of this variant were di ff erent with borderline signi fi cance between PCOS and controls. Hahn [13] Germany NIH 104 102 23.1% 22.5% This polymorphism had a similar frequency in PCOS women and controls. Ala carriers had lower fasting insulin, HOMA index, insulin secretion, and lower frequency and severity of hirsutism Xita [21] Greece NIH 140 180 6.8% 9.7% (normal weight), 7.3% (overweight/obese) The frequency of this variant was similar in PCOS and controls. Insulin resistance, lipid and hormonal parameters were not di ff erent among genotypes. Koika [20] Greece NIH 56 156 14.3% 12.3% Genotype frequencies of the Pro12Ala polymorphism were similar in PCOS women and controls. Pro12Ala polymorphism was associated with lower basic metabolic rate measured with indirect calorimetry. In lean PCOS women the Ala variant was also associated with higher total testosterone values. San Millan [19] Spain NIH 42 72 21.4% 10% No di ff erence in genotype distribution between PCOS and controls. This variant neither in fl uenced phenotype nor insulin resistance. Christopolous [15] Greece Rotterdam 148 183 6.5% 5.5% The Pro12Ala polymorphism was as frequent in PCOS women as in controls. Bidzinska-Speichert [23] Poland Rotterdam 51 54 26.5% 23.1% Controls and PCOS showed a similar lower frequency of Ala occurrence. PPAR γ exon 2 Country PCOS criteria No of women Polymorphism (Pro12Ala) Comments First author [Ref.] Controls PCOS Controls PCOS Antoine [30] USA (white women) NIH 187 285 20.2% 20.2% The frequency of this variant did not di ff er in PCOS and controls. Controls who carried the Ala allele had trendwisely lower levels of total testosterone compared with noncarriers. This polymorphism was not in fl uence the risk of developing PCOS or their phenotypic traits. Yilmaz [27] Turkey Rotterdam 100 100 22% 15% Pro12Ala polymorphism, which was heterozygous in all women analyzed, was signi fi cantly more common in controls than in PCOS women. Both PCOS and controls who carried the Ala allele had lower levels of androgens, lower insulin, HOMA-IR, AUC insulin and waist-to-hip ratio, compared with the Pro allele carriers. Also, PCOS carriers of this variant had lower Ferriman-Gallwey and acne scores compared with the wild types. Tok [25] Turkey Hyperandrogenism, oligomenorrhea, PCO 60 60 21.7% 10% The frequency of this polymorphism did not di ff er in PCOS women and in controls. In both groups, no woman was heterozygous. Carriers of this variant were less insulin resistant and less glucose intolerant, as demonstrated by 2-h glucose concentrations. Dasgupta [16] India Rotterdam 299 250 16% 11% Departure from expected Hardy-Weinberg proportions was observed. Hapolotype association analysis revealed reduced frequency of hyperandrogenic and metabolic traits associated with PPAR-ɣ haplotypes. Shaikh [28] India Rotterdam 300 450 27% 15.3% Pro12Ala was more frequent in PCOS women compared with controls. Carriers of this variant had signi fi cantly reduced 2-h glucose levels compared with wild type women. Wang [24] China Rotterdam 147 201 6.5% 9% There was no statistical di ff erence in genotype distribution, in BMI and hormone levels between PCOS and controls. Chae [14] South Korea Rotterdam 256 184 10.1% 7.1% Genotype distribution was compatible with the expected Hardy-Weinberg equilibrium. Biochemical and clinical parameters of hyperandrogenism, indices of glucose tolerance and insulin resistance did not di ff er according to the genotype both in PCOS women and in controls. However, among PCOS women, HDL cholesterol levels were signi fi cantly higher in non-Pro/Pro women compared with Pro/Pro women. (continued on next page )
women and the IRS1-/E6-/E2-, which regard three-fourths of controls. The only study in literature that analyzed concomitantly these three polymorphisms, was an Indian study[16], in which the authors found different haplotype distribution between PCOS and control women, although the combinations explored were different from those in our analysis. Particularly, while the IRS-1 polymorphism was represented similarly in cases and controls, the PPAR-γ exon 2 and exon 6 poly-morphisms were significantly more frequent in the controls compared with PCOS women[16]. In contrast, in the present study we found an increased frequency of the IRS-1 variant in PCOS women, whereas the PPAR-γ exon 2 and exon 6 variants were similarly distributed in PCOS women and controls. Difference in ethnicity and clinical characteristics may account for disparities between these two studies.
Consistently with the studies above mentioned we found an effect of PPAR-γ polymorphisms on the weight of PCOS women, as carriers of the exon 6 variant were trendwisely less likely to be overweight or obese compared with the wild type. Furthermore, IRS-1 and PPAR-γ exon 2 variants were associated with lower 17-β estradiol and free testosterone levels, respectively.
Concerning glucose metabolism, carriers of A allele at position 972 of the IRS-1 gene showed a tendency toward higher HOMA-IR, IGI and DI, whereas carriers of T allele at position 447 of the PPAR-γ exon 6 gene showed a borderline lower degree of insulin resistance, as de-monstrated by lower HOMA-IR, higher Matsuda index, lower IGI and higher DI. Finally, carriers of G allele at position 12 of the PPAR-γ exon 2 gene showed lower HOMA-IR, significantly higher IGI and DI. These data are consistent with a protective or detrimental effect of PPAR-γ exon 2 and exon 6 or IRS-1 variants on insulin-resistance and beta-cell function. Certain allelic combinations may also modulate the degree of insulin resistance, as PCOS women heterozygous for IRS-1 and PPAR-γ exon 6, and wild type for PPAR-γ exon 2 showed higher Matsuda index values when compared with those heterozygous for IRS-1, wild type for PPAR-γ exon 6, and wild type for PPAR-γ exon 2 (P = 0.03). In this regard, Dasgupta[16]similarly found that PCOS women carrying both IRS-1 and PPAR-γ polymorphisms had a lower frequency of hyperan-drogenic and metabolic derangements compared to the wild types, al-though measurements of insulin resistance and beta-cell function was not performed.
Strengths of our research include selection of a homogenous popu-lation and evaluation of both insulin resistance and insulin secretion indexes. Although glucose clamp still represents the gold standard for evaluation of insulin resistance, both HOMA-IR and Matsuda index are well-known proxy of insulin resistance and sensitivity, and show a good correlation with glucose clamp [25]. Furthermore, there is no gold standard method for evaluating insulin secretion, and it is well known that insulin secretion may depend on insulin resistance according to a hyperbolic rule, as defined by the DI. This study has, however, two main limitations: i) the limited sample size and the lack of statistical power sufficient to detect small difference between groups; ii) the ab-sence of glucose clamp.
In conclusion, both PPAR-γ and IRS-1 polymorphisms, alone or combined in specific haplotypes, were associated with differences in hormonal and metabolic parameters in women with PCOS, thus con-firming the protective influence of PPAR-γ exon 2 and exon 6 variants on insulin resistance and beta-cell function, and the detrimental effect of IRS-1 polymorphism. However, some of these associations were weak and do not fully explain the high metabolic risk associated with PCOS. Declaration of interests
None.
Appendix A. Supplementary data
Supplementary data associated with this article can be found, in the online version, athttp://dx.doi.org/10.1016/j.jcte.2018.05.002.
Table 6 (continued ) PPAR γ exon 6 Country PCOS criteria No of women Polymorphism (His447His) Comments First author [Ref.] Controls PCOS Controls PCOS Russo, this study Italy Rotterdam 26 53 7.7% 20.7% PCOS carriers of this polymorphism were less frequently overweight or obese and showed lower indice s of insulin-resistance compared with the wild type women. Orio [17] Italy (south) NIH 100 100 12% 21% The T allele was more common in PCOS compared to controls. Also, within both groups, the CC genotype was signi fi cantly more frequent than genotypes CT and TT. PCOS carriers of this variant had higher BMI and leptin levels compared with controls. Christopolous [15] Greece Rotterdam 148 183 13.2% 13.9% Genotype frequencies did not di ff er from those predicted. Carriers of this polymorphism had signi fi cantly lower levels of total testosterone. Antoine [30] USA (white women) NIH 187 285 22.1% 19.9% This variant did not in fl uence the risk of PCOS. Carriers of the T-allele had signi fi cantly decreased free and total T levels, and HOMA-IR. Dasgupta [16] India Rotterdam 299 250 13% 9% Genotype distribution was similar in PCOS women and controls. Hapolotype association analysis revealed reduced frequ ency of hyperandrogenic and metabolic traits associated with PPAR-ɣ haplotypes. Shaikh [28] India Rotterdam 300 450 34% 25.5% This polymorphism was more common in controls. Carriers of this polymorphism had better insulin sensitivity than in wild types.
References
[1] ESHRE/ASRM Revised 2003 consensus on diagnostic criteria and long-term health
risks related to polycystic ovary syndrome. Fertil Steril 2004;81:19–25.
[2] Legro RS, Kunselman AR, Dodson WC, Dunaif A. Prevalence and predictors of risk
for type 2 diabetes mellitus and impaired glucose tolerance in polycystic ovary syndrome: a prospective, controlled study in 254 affected women. J Clin Endocrinol
Metab 1999;84:165–9.
[3] Ovalle F, Azziz R. Insulin resistance, polycystic ovary syndrome, and type 2 diabetes
mellitus. Fertil Steril 2002;77:1095–105.
[4] Wild RA, Carmina E, Diamanti-Kandarakis E, Dokras A, Escobar-Morreale HF,
Futterweit W, et al. Assessment of cardiovascular risk and prevention of cardio-vascular disease in women with the polycystic ovary syndrome: a consensus state-ment by the Androgen Excess and Polycystic Ovary Syndrome (AE-PCOS) Society. J
Clin Endocrinol Metab 2010;95:2038–49.
[5] Ehrmann DA, Liljenquist DR, Kazsa K, Aziz R, Legro RS, Ghazzi MN, et al.
Prevalence and predictors of the metabolic syndrome in women with polycystic
ovary syndrome. J Clin Metabol 2006;91:48–53.
[6] Ehrmann DA. Polycystic ovary syndrome. N Engl J Med 2005;352:1223–36.
[7] Diamanti-Kandarakis E, Kouli C, Tsianateli T, Bergiele A. Therapeutic effects of
metformin on insulin resistance and hyperandrogenism in polycystic ovary
syn-drome. Eur J Endocrinol 1998;138:269–74.
[8] Goodarzi MO, Erickson S, Port SC, Jennrich RI, Korenman SG. Beta-Cell function: a
key pathological determinant in polycystic ovary syndrome. J Clin Endocrinol
Metab 2005;90:310–5.
[9] Jones MR, Goodarzi MO. Genetic determinants of polycystic ovary syndrome:
progress and future directions. Fertil Steril 2016;106:25–32.
[10] Pappalardo MA, Russo GT, Pedone A, Pizzo A, Borrielli I, Stabile G, et al. Very high
frequency of the polymorphism for the insulin receptor substrate 1 (IRS-1) at codon 972 (glycine972arginine) in Southern Italian women with polycystic ovary
syn-drome. Horm Metab Res 2010;42:575–84.
[11] Pappalardo MA, Vita R, Di Bari F, Le Donne M, Trimarchi F, Benvenga S. Gly972Arg
of IRS-1 and Lys121Gln of PC-1 polymorphisms act in opposite way in polycystic
ovary syndrome. J Endocrinol Invest 2017;40:367–76.
[12] Gonzalez A, Abril E, Roca A, Aragón MJ, Figueroa MJ, Velarde P, et al. Specific
CAPN10 gene haplotypes influence the clinical profile of polycystic ovary patients.
J Clin Endocrinol Metab 2003;88:5529–36.
[13] Hahn S, Fingerhut A, Khomtsiv U, Khomtsiv L, Tan S, Quadbeck B, et al. The
per-oxisome proliferator activated receptor gamma Pro12Ala polymorphism is asso-ciated with a lower hirsutism score and increased insulin sensitivity in women with
polycystic ovary syndrome. Clin Endocrinol (Oxf) 2005;62:573–9.
[14] Chae SJ, Kim JJ, Choi YM, Kim JM, Cho YM, Moon SY. Peroxisome
proliferator-activated receptor-gamma and its coactivator-1alpha gene polymorphisms in Korean women with polycystic ovary syndrome. Gynecol Obstet Invest
2010;70:1–7.
[15] Christopoulos P, Mastorakos G, Gazouli M, Deligeoroglou E, Katsikis I,
Diamanti-Kandarakis E, et al. Peroxisome proliferator-activated receptor-gamma and -delta polymorphisms in women with polycystic ovary syndrome. Ann N Y Acad Sci
2010;1205:185–91.
[16] Dasgupta S, Sirisha P, Neelaveni K, Anuradha K, Sudhakar G, Reddy BM.
Polymorphisms in the IRS-1 and PPAR-γ genes and their association with polycystic
ovary syndrome among South Indian women. Gene 2012;503:140–6.
[17] Orio Jr F, Matarese G, Di Biase S, Palomba S, Labella D, Sanna V, et al. Exon 6 and 2
peroxisome proliferator-activated receptor-gamma polymorphisms in polycystic
ovary syndrome. J Clin Endocrinol Metab 2003;88:5887–92.
[18] Orio Jr F, Palomba S, Cascella T, Di Biase S, Labella D, Russo T, et al. Lack of an
association between peroxisome proliferator-activated receptor-gamma gene Pro12Ala polymorphism and adiponectin levels in the polycystic ovary syndrome. J
Clin Endocrinol Metab 2004;89:5110–5.
[19] San Millan JL, Corton M, Villuendas G, Sancho J, Peral B, Escobar-Morreale HF.
Association of the polycystic ovary syndrome with genomic variants related to in-sulin resistance, type 2 diabetes mellitus, and obesity. J Clin Endocrinol Metab
2004;89:2640–6.
[20] Koika V, Marioli DJ, Saltamavros AD, Vervita V, Koufogiannis KD, Adonakis G,
et al. Association of the Pro12Ala polymorphism in peroxisome proliferator-acti-vated receptor gamma2 with decreased basic metabolic rate in women with
poly-cystic ovary syndrome. Eur J Endocrinol 2009;161:317–22.
[21] Xita N, Lazaros L, Georgiou I, Tsatsoulis A. The Pro12Ala polymorphism of the
PPAR-gamma gene is not associated with the polycystic ovary syndrome. Hormones
(Athens) 2009;8:267–72.
[22] Knebel B, Janssen OE, Hahn S, Jacob S, Gleich J, Kotzka J, et al. Increased low
grade inflammatory serum markers in patients with Polycystic ovary syndrome (PCOS) and their relationship to PPARgamma gene variants. Exp Clin Endocrinol
Diabetes 2008;116:481–6.
[23] Bidzinska-Speichert B, Lenarcik A, Tworowska-Bardzinska U, Slezak R,
Bednarek-Tupikowska G, Milewicz A, et al. Pro12Ala PPAR gamma2 gene polymorphism in
women with polycystic ovary syndrome. Ginekol Pol 2011;82:426–9.
[24] Wang Y, Wu X, Cao Y, Yi L, Fan H, Chen J. Polymorphisms of the peroxisome
proliferator-activated receptor-gamma and its coactivator-1alpha genes in Chinese
women with polycystic ovary syndrome. Fertil Steril 2006;85:1536–40.
[25] Tok EC, Aktas A, Ertunc D, Erdal EM, Dilek S. Evaluation of glucose metabolism and
reproductive hormones in polycystic ovary syndrome on the basis of peroxisome proliferator-activated receptor (PPAR)-gamma2 Pro12Ala genotype. Hum Reprod
2005;20:1590–5.
[26] Korhonen S, Heinonen S, Hiltunen M, Helisalmi S, Hippeläinen M, Koivunen R,
et al. Polymorphism in the peroxisome proliferator-activated receptor-gamma gene
in women with polycystic ovary syndrome. Hum Reprod 2003;18:540–3.
[27] Yilmaz M, Ergün MA, Karakoç A, Yurtçu E, Cakir N, Arslan M. Pro12Ala
poly-morphism of the peroxisome proliferator-activated receptor-gamma gene in women
with polycystic ovary syndrome. Gynecol Endocrinol 2006;22:336–42.
[28] Shaikh N, Mukherjee A, Shah N, Meherji P, Mukherjee S. Peroxisome proliferator
activated receptor gamma gene variants influence susceptibility and insulin related traits in Indian women with polycystic ovary syndrome. J Assist Reprod Genet
2013;30:913–21.
[29] He J, Wang L, Liu J, Liu F, Li X. A meta-analysis on the association between PPAR-γ
Pro12Ala polymorphism and polycystic ovary syndrome. J Assist Reprod Genet
2012;29:669–77.
[30] Antoine HJ, Pall M, Trader BC, Chen YD, Azziz R, Goodarzi MO. Genetic variant in
peroxisome proliferator-activated receptor gamma influence insulin resistance and testosterone levels in normal women, but not those with polycystic ovary syndrome.