UNIVERSITY OF ROME
"TOR VERGATA"
FACULTY OF ENGINEERING
Department of Mechanical Engineering
Ph.D. course
MATERIALS ENGINEERING
XXI Cycle
STUDY OF ANELASTIC PHENOMENA IN
MATERIALS OF ENGINEERING INTEREST
Paolo Deodati
Tutor
Prof. Roberto Montanari
Table of contents
Introduction I
Chapter 1
Internal Friction Theory 1
Part I
Chapter 2
Titanium Composite
2.1 Introduction 12
2.2 State of the art 13
2.3 Property and production 15
2.4 Low temperature damping
2.4.1 Experimental 22
2.4.2. Results 23
2.5 High temperature damping
2.5.1 Experimental 26
2.5.2 Results 29
2.5.3 Discussion 32
2.6 High temperature comparison between Ti6Al4V-SiCf producted by HIP and RDB
2.6.1 Experimental 36
2.6.2 Results and discussion 37
References 44
Chapter 3
High Nitrogen Steel produced by Pressurized-Electroslag-Remelting
3.1 Intoduction 47
3.2 Manufacture 48
3.3 Pressure Metallurgy 51
3.4 Powder Metallurgy 53
3.5 Relaxation phenomena in HNS Austenitic steel
3.5.1 Experimental 55
3.5.2 Results and discussion 56
Chapter 4
Internal friction peak due to nitrogen in tungsten
4.1 Introduction 63
4.2 Material and experimental 63
4.3 Results and discussion 64
4.4 Conclusions 68
References 69
PART II
Chapter 5
Nickel Based Superalloys
5.1 Introduction 70
5.2 Strength versus Temperature 73
5.3 Alloy Compositions 74
5.4 Applications of nickel based superalloys 77 5.5 Dislocation rearrangement and damping phenomena
for PWA 1483 SX and IN792DS superalloy
5.5.1 Introduction 79 5.5.2 Experimental 80 5.5.3 Results 83 5.5.4 Discussion 90 References 93
Chapter 6
Spark Plasma Sintering (SPS)
6.1 Introduction 94
6.2 Process 95
6.3 Applications 96
6.4 Part Characteristics 98
6.5 Benefits 99
6.6 Damping of nanostructured Alloy FeMo produced by Spark Plasma Sintering
6.6.1 Introduction 100
6.6.2 Materials and experimental 101
6.6.3 Results 103
6.6.4 Discussion 107
Chapter 7
Human Teeth 7.1 Introduction 110 7.2 Parts 111 7.2.1 Dentin 112 7.2.2 Cementum 112 7.2.3 Pulp 113 7.3 Development 1137.4 Damping on human teeth
7.4.1 Introduction 115
7.4.2 Material and Methods 116
7.4.3 Results and discussion 117
7.4.4 Conclusions 120
______________________________________________________________________
Introduction
The theoretical principles of anelastic phenomena in solids were formulated for the first time by C. Zener in 1937 – 1938. Virtually at the same time N. N. Davidenkov formulated the principles of the nonlinear mechanics of materials. Special literature operates with various terms for describing inelastic phenomena in solids, for example, internal friction, physical acoustics, absorption of ultrasound, static and dynamic hysteresis loops, internal dissipation of energy, and damping of oscillations. In 1990 De Batist and Magalas suggested a generalized concept for the description of these phenomena known today as mechanical spectroscopy of materials. Mechanical spectroscopy (MS) studies absorption spectra of mechanical energy under the conditions of applied periodic external mechanical field. Mechanical spectroscopy is a powerful tool for the study of materials. In particular, it is shown that such a technique can help the mechanical characterisation of materials.
The elastic and anelastic properties of the material have been investigated by using a vibrating reed technique with electrostatic excitation and frequency modulation detection of flexural vibrations mode of cantilevered mounted reed samples.
All measurements of the internal friction (Q−1) and of the resonance frequency (f) were performed from -150 °C up to 1000°C, so it was possible to determine, continuously, the dynamic Young modulus. This is an important step forward compared to traditional methods of tensile testing, because there are some problem to determine the elastic modulus at lower and higher temperature. With this method all the instrumentation errors was cleared.
______________________________________________________________________
In this work we have studied the elastic and anelastic properties of a wide range of materials:
− Titanium matrix composite (Ti6Al4V/SiCf), Titanium alloys (SP700,
Ti6Al4V)
− High nitrogen steel − Tungsten
− Nickel based super alloys (single crystal and directional solidified) − Nanostructured alloys
− Human teeth.
This work has been divided into two parts: the first one is based on anelastic relaxation phenomena and the second one is focused on irreversible phenomena.
Chapter 1
Internal Friction Theory
1.1 The anelasticity
Hooke's law establishes a linear relationship between stress and deformation in the elastic range, provided that the effort increases so infinitely slow so that the system state has the opportunity to follow changes of the load. In the elastic field, the energy stored throughout the system during the load is released during the unloading.
In this case the process is energetically reversible.
A repetition of cycles of loading and unloading will not cause any energy loss.
In the stress/deformation curve the energy stored by the system is represented by the area under the curve, therefore so that the area will be zero the two ways, corresponding to the increase and decrease the load must be the same.
About a real material, were the is an application of external load not infinitely slow (as in reality precisely), there is never an immediate adjustment of the system to the variation of this load, but it conforms after a certain period of time. This delay, due to physical reasons of different nature, implies a clear deviation from the “ideal” elastic behaviour characterized by the Hooke law. This process of loading and unloading of stress, applied in the range of reversibility, involves friction of a quantity of energy, precisely defined internal friction.
In the stress/deformation curve the loading way do not coincide with the unloading one, the cycle presents a hysteresis phenomena, and the area between the loading and unloading curve represent the energy loss in the cycle, namely the transformation of mechanical energy in heat.
In general the mechanical phenomena characterized by internal friction are called anelasticity.
The Hooke law describes the behaviour of an ideally elastic body.
Taking in account the time dependence of strain and deformation the Hooke law can be written as follow:
)
(
)
(
t
M
ε
t
σ
=
(I-1)in this equation σ and ε are in linear relation.
In the real process we have to consider the derivate of the velocity of loading variation, so we have to introduce in Eq. I-1 the derivate, on time, of strain and deformation so we obtain:
ε
ε
σ
σ
2&
1 2&
1a
b
b
a
+
=
+
(I-2)This equation describes quite well the behaviour of a real solid, so are called Standard Linear Solid (SLS).
So the equation can be written:
σ
+
τ
εσ
&
=
M
r(
ε
+
τ
σε
&
)
(I-3)Where τε is the relaxation time of the stress at constant deformation, τσ is the relaxation
time of deformation at constant stress, Mr is the relaxed elastic modulus.
Applying at time t=0 a constant strain σ0 the Eq. I-3 can be written:
0
σ
ε
τ
ε
+
r σ&
=
rM
M
(I-4)The solution is:
τσ
σ
ε
σ
ε
0 / 0 0(
)
)
(
t r re
M
M
t
=
+
−
−The trend is showed in Fig.I-1
At loading point the deformation go instantaneously to ε0 than grow exponentially until the value r M 0 σ ε∞ = .
Figure I-2 show the stress deformation curve relatively at the same phenomena at σ constant.
Fig. I-2 Stress deformation curve relatively at σ constant.
Mn and Mr are respectively the elastic modulus not relaxed and relaxed.
0 0 ε σ = n
M represent the relation between the applied stress at time t=0 and the deformation, ε0, that the solid assume instantaneously, while Mr correlate the stress and
the deformation after the relaxation.
Imposing constant the deformation the eq. I-3 become
0
ε
σ
τ
σ
+
ε&
=
M
rAnd the solution is:
σ
ε
σ
ε
τε t r rM
e
M
t
)
=
+
(
−
)
−(
0 0 0Fig. I-3 Stress deformation curve relatively at σ (a) and ε constant (b).
in the considered case of relaxing at stress and deformation constant, τσ and τε determine
the velocity with which the system going to the thermodynamic equilibrium.
1.2 Dynamic properties of the standard anelastic solid
If the applied stress to the sample is cyclical, in particular sinusoidal, stress and deformation can be defined, using the complex notation, as follows:
σ t σ eiωt 0 ) ( = ε t ε eiωt 0 ) ( = (I-5) Replacing in the Eq. I-3 and simplifying we obtain:
0
0(1 ωτ ) (1 ωτ )ε
σ +i ε =Mr +i σ
It’s now possible to define the complex modulus Mc
) 1 ( ) 1 ( ε σ ωτ ωτ i i M Mc r + + =
Mc is a complex quantity so σ(t) and ε (t) are out of phase, and if we indicate with δ the
phase angle we can consider tan (δ) the measure of the loss energy
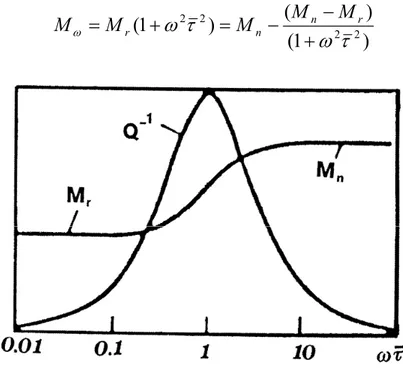
] ) 1 ( )][ [( ) 1 ( ) ( ) Re( ) Im( tan 2 2 2 τ ω τ ω τ τ ω τ τ ω δ ε σ ε σ + − = + − = = M M M M M n r c c (I-6)
The first factor it’s the measure of the relatively variation of stress and deformation during the relaxation.
The second factor determines the dependence of the internal friction on the frequency. We obtain the maximum value of tanδ when ωτ=1.
Defining Dynamic Modulus the component of the Complex Modulus responsible of the component of the stress in phase with the deformation, that’s the real part of the complex modulus ) 1 ( ) ( ) 1 ( 2 2 2 2
τ
ω
τ
ω
ω + − − = + = n r n r M M M M MFig. 4 Trend of tanδ and Mω versus frequency
From figure I-4 we can observe:
− At lower frequency there isn’t energy loss due to the lack of time for the deformation to follow the applied stress. The relationship between stress and deformation in characterized by Mr.
− At higher frequency the relaxation can not proceed due to the time less, and the internal friction go to zero again. The relationship between stress and deformation in characterized by Mn.
− At intermediate frequency, with ωτ ≅1, we obtain the maxima amplitude of
internal friction. The value of the modulus is included between Mr and Mn.
1.3 Measurement of internal friction
There are several ways to measure the internal friction of metal materials, here we describe only the method of frequency modulation, one of the most widely used for precision and reliability of results.
The frequency modulation method is based on the electric conversion of a mechanical vibration: the sample excited electro statically by an electrode become in vibration and the consequent variation of capacity of sample/electrode modulate an oscillator. Working with a single electrode is of great importance because it reduces the parasitic capacitance, the noise due to the secondary mechanical system and also allows to operate in a wide temperature range.
The high sensitivity of this method, that allows to use one electrode not in contact with the sample, reduces the instability of the measure and provides the ability to appropriately adjust the distance electrode/sample via software.
Specimen and electrode can be considered like the plate of a condenser and the mechanical vibration of the sample, in resonance, cause changes of the capacitance. These capacity variation modulate in frequency a periodic electrical signal; the variation of the pulse carrier is :
C C h ∆ − = ∆ω ω 2 1
Were
ω
h is the carrier pulse and ∆CC is the variation of the capacity of the system dueto the mechanical vibration.
The amplitude of the modulation is proportional to the variation of capacity, which clearly show the importance of reducing parasitic capacitance.
In the measurement of internal friction of material in resonance, the shape of the sample have a great importance because the equation of propagation of elastic waves in solid can be solved with good approximation only for simple geometries.
The most used shape are reeds and circular plates, in this work we used only the first one.
Starting from the equation of propagation of elastic waves in solid it’s possible to know the frequencies of the sample.
The electronic noise can be minimized by the use of appropriate filters while on the friction of air is necessary to perform the measure in vacuum with pressure values of up to 10-2 torr.
An internal friction measure is performed by placing the specimen in resonance and after a certain time removing the signal of excitement; the way in which the sample is de-energized and losses energy depends only on the internal structure, if as we have said, become irrelevant external factors of friction.
The mechanical vibration of the sample modulate in frequency an electrical signal, then this will be sufficient to demodulate the signal and then amplify it in order to obtain an electrical signal proportional in amplitude to changes in capacity specimen / electrode. Removing the exciting signal the mechanical vibration, owing to internal friction of energy, decrease in amplitude and the electrical signal in output have an sinusoidal damped trend.
The energy loss in the half-cycle, called Q-1, can be written by:
0 1 2 0 1 2 1 ln 1 ω ω ω π δ π π − = ∆ = = ⎟⎟ ⎠ ⎞ ⎜⎜ ⎝ ⎛ = = − E E tg V V n d Q n
Fig. I-5 Two methods for determine the Q-1.
In this work we use the cantilever method as shown in figure I-6, and the equation of the propagation of the wave in solid is:
0 4 4 2 2 2 = ∂ ∂ + ∂ ∂ x y a t y Where S EI a ρ =
2 , I moment of inertia, E the elastic modulus ρ the density and S is the
area of the section of the sample.
With the boundary condition the differential equation can be written:
1 cosh
cosHiL⋅ HiL=− , so the solution is the resonance frequency:
ρ π E L h m fr 2 2 12 2 = (I-7)
Fig. I-6 Model of cantilever of VRA 1604.
Where m is a constant (m=1.875), L the length, h the thickness and ρ the material density.
The main mechanism which produce anelastic damping are associated with the diffusive motion under stress of point defects, the motion of dislocations or part of them, and the motion of grain boundaries or other interfaces.
Points defect relaxation generally means an anelastic relaxation caused by a diffusive redistribution of point defects under the action of an applied stress. This necessarily requires an elastic interaction between the applied stress and the distortions of a crystal lattice created by the point defects, so that under the action of the external stress the
internal equilibrium distribution of the defects is changed and the driving force for a directed diffusion is produced.
One possibility , is the movement of interstitial atoms from compressed to dilated regions in an inhomogeneous stress field, i.e., a long range diffusion driven by the hydrostatic stress component. The other possibility, named reorientation, is related to the anisotropy of both the applied stress and the defect induced distortions. Compared with the movement of interstitial atoms relaxation, reorientation processes have much more practical importance for two reasons:
1. they apply to a much larger variety of point defects and their clusters; 2. they require only short-range diffusion, ideally over atomic distances.
So that the relaxation times are much shorter and more likely to cause internal friction of elastic vibrations practically relevant frequency ranges.
However, not all point defects in metals are subjected to a reorientation mechanism: some of them may cause damping, while others may not. This ability depends on specific symmetry relations and on the direction of the oscillating applied stress. The main condition is that the symmetry of the local elastic distortions, caused by the defects in the crystal lattice, is lower than the symmetry of the lattice itself; when specified in crystallographic terms, this is known as so-called selection rules for anelasticity.
The temperature of anelastic relaxation (i.e., of internal friction peak) is determined by the activation energy of diffusion of the phenomena and by the frequencies of vibrations.
The anelasticity phenomena are governed by a relaxation time (τ) as seen in equation I-3, i.e. τ is the time required for the deformation for reaching the equilibrium with the applied load.
We have also seen that the maxima amplitude of internal friction it is observable when
1 ≅
ωτ , so we can express the relaxation time in the from:
e
RTΗ
=
τ
0The equation of a Debye peak show that, to trace out a peak reasonably completely, requires the ability to vary ω over about two decades. For a resonance method, this requirement usually means that several specimens, possibly vibrating in different modes, must be used to cover the range. There is, however, another way of tracing out the peak, namely, by varying τ while keeping ω constant.
So imposing that ωτ ≅1 and substituting in the eq. I-8 we obtain:
⎟ ⎠ ⎞ ⎜ ⎝ ⎛ ⎟ ⎠ ⎞ ⎜ ⎝ ⎛ + = T R H 1 ln lnωτ ωτ0
So that there is a linear relation between lnωτ and the reciprocal absolute temperature. It is clear then, that a plot of a given dynamic response function versus Q/RT differs from a plot of the same function versus lnωτ only by a constant shift parallel to the abscissa. On the other hand, a plot versus 1/T involves an additional change in the scale of the abscissa by the factor H/R.
For the case of a Debye peak, the condition that lnωτ = 0 at the peak gives
0 1 ln 0 ⎟⎟= ⎠ ⎞ ⎜ ⎜ ⎝ ⎛ ⎟ ⎠ ⎞ ⎜ ⎝ ⎛ + p T R H ωτ (I-9)
Where Tp is the temperature at the peak. If a series of peaks is obtained at a number of
different frequencies, a straight line plot can be made of lnω versus 1/Tp, whose slope is
then H/R. this method, wich is one of the most common ways of obtain the activation energy.
Often it is desirable to obtain an approximate value for the activation energy knowing only the peak temperature at one frequency, or conversely, knowing H, one may wish to determine at what temperature the peak will appear for a given frequency.
These objectives can only be accomplished if the value of τ0 is known. From the type of
phenomenon occurring, one can often estimate τ0 to within an order of magnitude, and
then estimate H from Tp or vice versa, using Eq. (I-9). In practice, such estimates are
made so often that it is convenient to have a graph from which one ca read the values directly.
In cases in which data are given at only two frequencies ω1 ω2 , it is convenient to use
⎟ ⎟ ⎠ ⎞ ⎜ ⎜ ⎝ ⎛ − ⎟ ⎠ ⎞ ⎜ ⎝ ⎛ = ⎟⎟ ⎠ ⎞ ⎜⎜ ⎝ ⎛ 2 1 1 2 1 1 ln p p T T R H ω ω (I-10)
To calculate the activation energy from the shift, (T-1p1- T-1p2), in the peak position. A
disadvantage of this simple procedure is that the location of the peak temperature is difficult to determine with high precision. It is therefore useful to note that Eq. I-8 applies not only to the shift of the peak temperature itself, but also to the shift of every point of the peak. To improve this statement, we need only note that any normalized dynamic response function of a standard anelastic solid is a function only of the product
Chapter 2
Titanium Composite
2.1 Introduction.
A great effort has been made in the last 20 years to develop new composites with Ti-alloy matrix reinforced by long ceramic fibres [II-1-7], which result equipped unidirectional with high-performance. About that the research and development about specific components are still active in many countries and few technical details are published in this regard.
In a conventional aircraft engine, most of the weight depends by mechanical components as rotors or anchorages, that a lot of parts is in the rotation during work condition. So it would be desirable to decrease the weight of the external elements to reduce the radial contribution. An high savings about this weight it is possible to have by the composites, that reduce the need for heavy structures through their high strength along the circle by optimal radial property.
The Ti6Al4V-SiCf composite has proved a promising material for aeronautical
applications including turbine components and structural high stressed parts (Fig.II-1), and however that applications including high thermic-mechanical stresses.
Fig. II-1 Application for the composite Ti6Al4V-SiCf
To value the real suitability of the material, in this section several studies have been carried out especially about the fiber /matrix interface. In fact mechanical behaviour is
chemical reactions may occur leading to structural instability. So the main target of this work was to assess how mechanical and micro-chemical properties are affected by long-term heat treatments.
Moreover an important part of the experimental study has been the comparison between two type of the aforesaid composite, different about their specific fabrication process.
2.2 State of the art
Since the real and the potential Ti6Al4V-SiC applications are attractive for both industrial and scientific aim, especially in recent years various studies about the chemical, thermal mechanical characterization of this material has been developed. The studies have been directed mainly to microstructural analysis of the fiber-matrix interface and to the diffusion kinetics about the same area, trying to predict and to monitor any changes in the mechanical properties of the material.
In most cases the situation has been studied by SEM and TEM micrograph analysis, or XPS and AES technical, adopted on the perpendicular plane to the major axis of fiber. In particular firstly there the interaction between C and Ti at moderate temperature (between 400 and 750 ° C) has been reported. At these temperatures during short heat exposure time, there is the formation of a titanium carbide compound TiC, controlled by the diffusion of Ti in C [II-8]. The study element diffusion evaluated through the XPS spectrum, the analysis of the thickness of the carbide layer and in particular the comparison with the more general diffusion theories, have reported discrepancies in the results [II-8].
These discrepancies appear to be due to difficulties about the assessing the real value of the carbide thickness and the activation energy for the diffusion of C in TiC, higher in this case than for the diffusion C-Ti [II-8].
The complexity of the diffusion phenomena increases logically on the interface zone between the fiber and the matrix of a composite material. First, by the literature this situation seems to be confirmed, i.e. the formation of titanium carbide increase with the temperature. The presence of SiC fibers coated with a carbon layer also includes a complex diffusion that involves more elements and especially the aforesaid carbon layer degradation. A situation, can cause the contact Ti-SiC and the formation of elements such as Ti5Si3. In fact, while with the presence of the carbon layer it is possible to note
SiC-Ti5Si3, forms near the already constituted TiC layer. This fact means that both the C that
the Si take part in the diffusion reactions [II-9].
In the reaction zone presence of elements apparently “unrelated” were detected, too. In fact on the fiber oxygen high concentrations has been identified especially by Auger spectroscopy, but also the existence of high-temperature empty (~ 950 °C) in the same zone, due to a vacancy saturation [II-10]. To this point, about the interesting zone quantity of solid precipitates and solutions is a detectable, involving an hardness increase and ductility reduction of the areas on the matrix immediately adjacent with the fiber, with the consequent influence about the ability to transfer load from matrix to fiber [II-10].
After the measures of the elements present at the interface and their concentration, the diffusion kinetics evaluation is fundamental. Generally, a study of this kind begins by observing the thickness of the reaction zone by optical microscopy [II-11]. In this case the difficulties, however, are caused by the irregular nature of this area especially in the part devoted to the matrix. That's why you choose an “average” value thickness is placed.
It is known primarily as the formation rate of the reaction zone grows very rapidly with the temperature increasing of a heat treatment [II-11]. This growth can be characterized, as shown in [II-4], by a not constant value of the diffusion coefficients during the heat exposure time . This situation first is due to the interaction between the outer layer of carbon fiber and titanium (with formation of titanium carbide), then to the interaction with the SiC (with the formation of more complex reaction ) that produces a second zone that may be related to different diffusion phenomena, as soon as the aforesaid layer is consumed [II-11].
About aluminium and vanadium, alloy elements in the matrix, they seem to be detected in the interface only in very little amount (especially vanadium can be found at the Ti5Si3). Howerer it results demonstrated that the rates of growth are lower in this case
than that in the fiber- pure Ti diffusion, reflecting the influence of these factors about the kinetics of reactions.
2.3 Property and production
The studied material is a composite constituted by a titanium matrix in Ti6Al4V alloy, used in the 90% of the aerospace and aeronautical applications. About the micro-structural aspect, this alloy is a mixed phase α+β (with few percent of β phase), where the α phase is a {hcp} phase, β a {ccc} phase. About the additional elements in the alloy (Al and V), they act especially as stabilizing for the two phase into the titanium alloy: Al is a substitutional element in the α phase, V is an interstitial element in β phase.
Tab. II-1 Ti6Al4V chemical composition
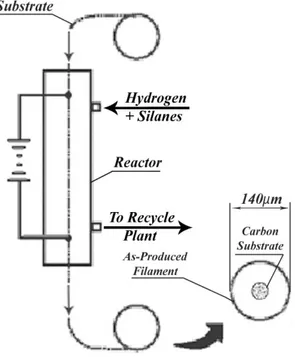
About the SiC fibers, these are as long fibers reinforcement. The fibers, usually denominated by the mark SCS-6, have a diameter of 140 µm and they are produced by PVD deposition, where the SiC accretion occurs on a carbon precursory (Fig. II-2).
Fig. II-2 PVD technology production to the SiC fiber (type SCS-6) fabrication
Ti Al V Fe C O2 N2 H2
- fine grain
Graphite
C Coating
Fiber
- fine grain
The final microstructure consists in a fiber constituted by three concentric parts: a first part is the internal carbon core of the fiber; the second is a silicon carbide (by two different phases) part; the third is a carbon coating by a thickness of 3 µm ( this part has used to increase the strength of the fiber by a curing of surface defects). The fiber structure is showed in Fig. II-3.
Fig. II-3 SCS-6 fiber microstructure on the trasversal section
The fiber property are summarized about the following points: - Not too expensive costs
- High strenght
- High resistence to high temperatures (up 1200÷1400 °C) - Low density
- Excellent chemical and corrosion resistance - Good wettability by metals
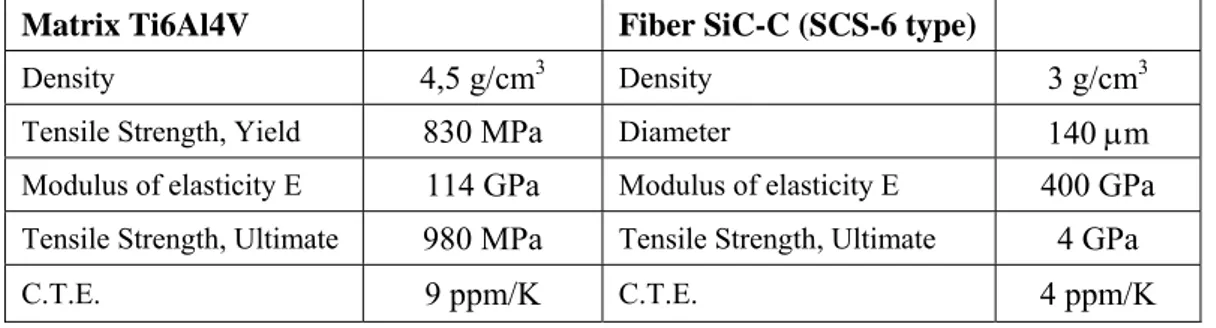
As summarizing, in the Tab.II-2 is possible to see the principal mechanical and thermic property for the two components of the studied composite.
Tab. II-2 Mechanical and thermic property for the components of the
Ti6Al4V-SiCf composite
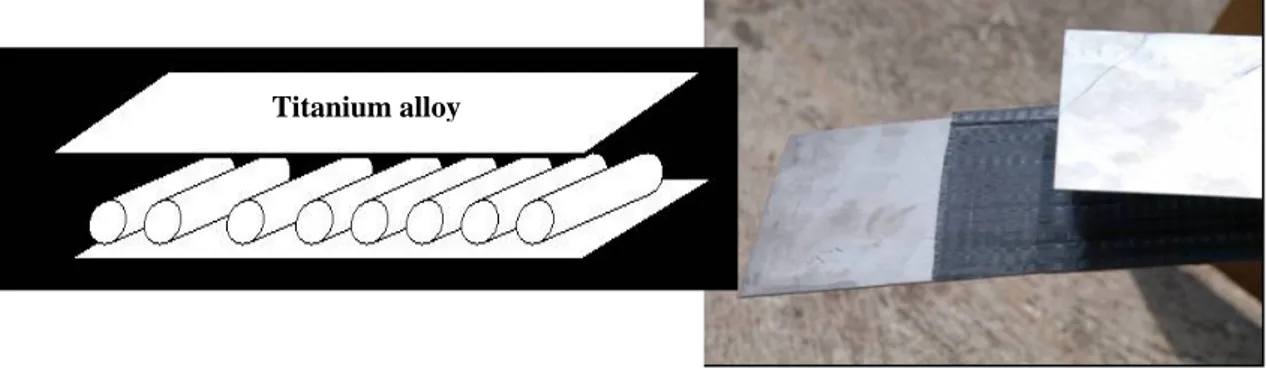
The composite has produced at C.S.M. laboratories in Castel Romano (Rome). It has been fabricated by hot isostatic pressure (HIP) in a multi-step process. Preforms (450 x 200 mm2) made of four layers of unidirectional SCS-6 fibres alternated with five Ti6Al4V sheets (thickness of 0,6mm for the external, 0,1 for the internal sheets) have been prepared. They were then put inside a AISI 304 steel die, which was then evacuated (3x10⁻⁶ mbar) and sealed. HIP cycle (showed in Fig II-.4) has been realized by a hot isostatic press ASEA-QH21, which permits to control independently temperature and pressure. The material (Fig. II-5) was kept at 1163 K for 1.8 x 10³ s under a pressure of 1200 bar; after cooling to room temperature the panels were extracted from the die. Finally by that for the experimental tests samples (with dimension of about 10 mm x 20 mm) have been obtained by spark erosion wire cutting (Fig. II-6).
Matrix Ti6Al4V Fiber SiC-C (SCS-6 type)
Density 4,5 g/cm3 Density 3 g/cm3
Tensile Strength, Yield 830 MPa Diameter 140 µm
Modulus of elasticity E 114 GPa Modulus of elasticity E 400 GPa Tensile Strength, Ultimate 980 MPa Tensile Strength, Ultimate 4 GPa
Tab. II-3 Process parameters for the HIP production
Fig. II-5 Ti6Al4V-SiCf : result of the HIP process and particular micrography
Fig. II-6 Samples of the composite obtained to the experimental tests
Tmax (°C) Pmax (bar)
Time stop die (min)
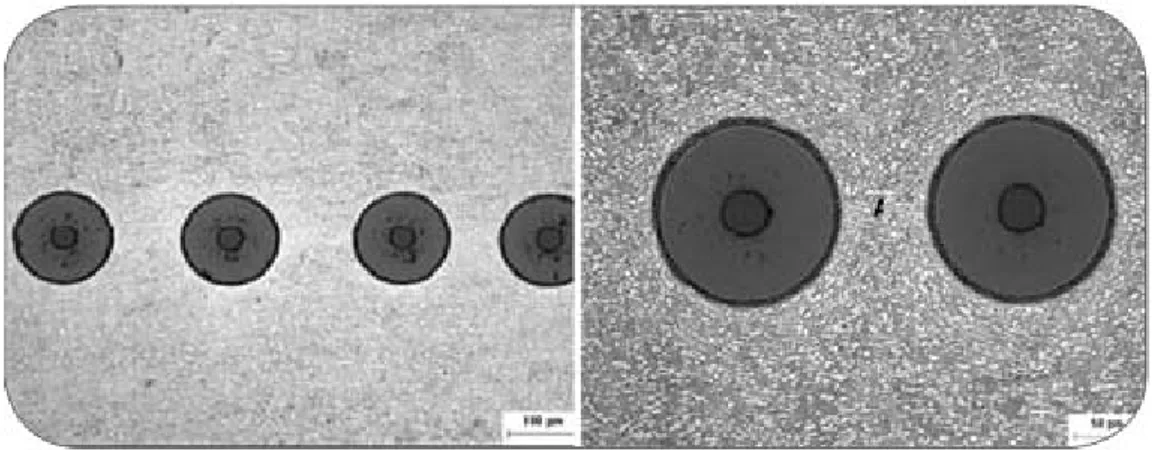
About the internal friction probes, samples constituted by only one layer of fibers have been tested, cause to the necessary vibrational characterization of the sample during the starting test.
The experimental development of this work has regarded the analysis and the studies also about the Ti6Al4V-SiCf composite produced by Roll Diffusion Bonding, thanks to
a innovative pilot project realized at the C.S.M. laboratories. Details are present in [II-12].
The process consists in the manufacturing of composite samples reinforced by the unidirectional SCS-6 fibres, by the mean of a semi-continuous/continuous approach. The matrix is constituted by Ti6Al4V sheet.
The materials are assembled as a lay-up of two metallic sheets between that one layer of fibers is inserted, as shown in Fig. II-7.
Fig. II-7 Composite lay-up and preparation of a precursor for the studied composite
During the Roll-Diffusion Bonding phase, the just-assembled sample (precursor) has been put under a backward and forward strip-tension under inert gas. As well as the pressure also the rolling speed and mill-stand temperature is computer controlled to improve the bonding reaction and this is the reason for the process called: Roll-Diffusion-Bonding (RDB). The metallic strips play the role of the composite matrix and under the combined effects of temperature and pressure flows from the surfaces through the fibre inter-spaces inside the fabric resulting in a complete metallic and ceramic-to-metal bonding.
The process phase is summarised as follows:
1- heating-up of a portion of the lay-up in the rolling-inert gas chamber;
2- plastic deformation of the metal matrix that starts the flow between the fibres; 3- first chemical reactions (inter-diffusion) at the fibre-matrix interfaces;
4- facing and contact between the two metal flows in the spaces between the fibres; 5- matrix recrystallisation in the joining surfaces;
The bonding process is stabilised and is completed in about 10 seconds. A further diffusion bonding phase is improved by mean of post-heat treatment just controlling the composite strip temperature to improve the diffusion strength.
The design parameters adopted for the pilot equipment first dimensioning are reported in Tab. II-4
Tab. II-4 Experimental reference parameters adopted for the pilot plant design
About the composite production, the adopted solution consist in the heating up a sealed chamber with inside the work rolls by mean of electrical resistance, in fact all other devices, micro-waves, induction, joule effect have shown higher complexity and higher costs. By this way a compacted working region has been manufactured (electric resistance are distributed on a crown of about 240 spatial degrees on each work roll) where has been possible to control both composite strip and rolling tool temperature, with also the atmosphere. In particular the large thermal mass of the rolling tools, simulated as an infinite heat source, is able to heat up the Ti-MMC precursor reaching 900°C in about few tenths of seconds.
To warranty a safe working temperature of the work-rolls has been necessary a special cooling circuit. Moreover to avoid an excessive cooling effect, it was necessary to design special “concentric work-rolls”: an inner force-roll and an external high-temperature resistant alloy work-ring (Fig. II-8).
Exercise temperature (°C)
Mean pressure in the contact arc (MPa)
Time (s)
Fig. II-8 Rolling Cylinders with the splitting of the thermal-tool (external ring) and the pressure-tool (inner cylinder)
This solution has permitted two advantages: the heating up only of the external special alloy-rings, and the manufacturing of cheap standard tool-steel inner-cooled work-rolls. Obviously the space between inner and external tool has been insulated with special ceramic shields in order to reduce the thermal dispersions.
The work-rolls rotation starts when the external ring high temperature surface reaches a temperature that is sufficient to warranty at least 900°C in the contact-arc.
Fig. II-9 Ti6Al4V-SiCf: result of the Roll Diffusion Bonding process and particular
micrography
External special heat resistant alloy ring and inner work roll scheme
Simmetry plane
External special heat resistant alloy ring and inner load cylinder
2.4 Low temperature damping
2.4.1
Experimental
In the Titanium fiber reinforced composites gaseous impurities such as hydrogen, nitrogen and oxygen absorbed during manufacturing processes and in operating conditions can strongly modify their mechanical behavior . In these composites further structural instability phenomena may occur at the fiber matrix interfaces determined by diffusion processes and chemical reaction thermally driven [II-13-15].
The Ti6Al4V (α +β) alloy, is characterized by a duplex hcp (α) and bcc (β) microstructure. The microstructure of the composite matrix consisted of the hcp α phase and a minority bcc β phase, approximately 4%. The monolithic Ti6Al4V alloy display a similar α+β microstructure.
It is known that the solubility of hydrogen in the β phase is much higher than in the α one. The reported hydrogen diffusion activation energy in the β phase is much lower than in the α phase [II-16].
Anelasticity measurements through mechanical spectroscopy has been extensively employed to understand details of point defects dynamics in Ti alloys [II-17] and to investigate transient or permanent damping effects depending on the evolution of thermal stresses at the fiber-matrix interfaces in composites [II-18].
The inverse mechanical quality factor (Q-1) and the resonance frequency, proportional to the square root of the dynamic young modulus at constant density and shape :6 cm lenght, 0.5 cm width, 0.08 cm thickness. All measurements of the internal friction (Q- 1)
and of the resonance frequency (f r) , were performed in the 0.6-3.5 kHz frequency
range at a strain amplitude ε< 10-5 and a pressure in the vacuum chamber 10-4-10-3 Pa. Before each thermal run of measurements , in the 80-350 K range at a constant heating rate of 1 K/min, all samples where thermally equilibrated at the lower temperature for 30 mins. All ageing treatments at temperatures in the 600-900 K range have been performed in a vacuum of 10-4 Pa .
2.4.2. Results
Fig. II-10 shows the internal friction and the resonance frequency vs. temperature for the monolithic Ti6Al4V alloy and the prepared fiber reinforced composite. A prominent peak thereafter indicated P1, is observed in both materials at appoximately 120 K
(1kHz), the relaxation strength is significantly enhanced in the composite in comparison with the monolithic matrix alloy. A second very broad peak P2 centered at around 250
-270 K is observed respectively in the alloy and the composite spectra. The background damping in the whole temperature range investigated appears higher in the composite.
Fig. II-10 Internal friction and resonance frequency of the Ti6Al4V
monolithic alloy and the Ti6Al4V-SiCf composite as prepared.
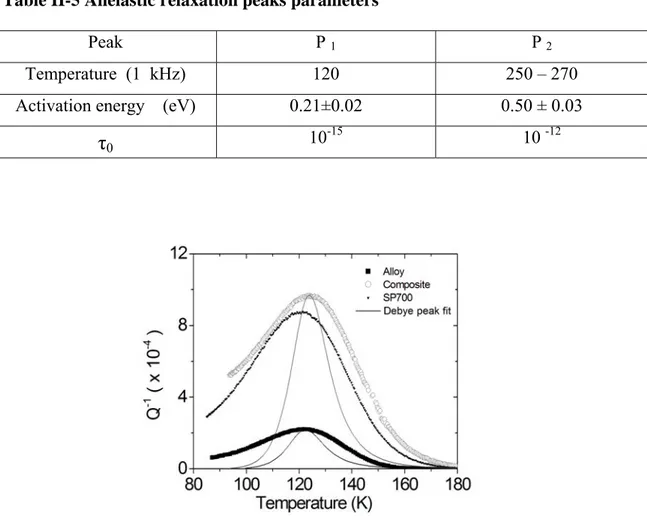
The relaxational nature of both peaks was confirmed by the shift of the peaks
temperature with frequency. The values obtained for the activation energy and frequency factors are reported in Table II-5. After thermal ageing up to 900 K in a 10 –4 Pa vacuum, a significant reduction of the P1 peak relaxation strenght both in the
monolithic alloy and the composite, up to 50%, is experienced, as can be seen in Figure II-11 .
Table II-5 Anelastic relaxation peaks parameters
Fig. II-11 Internal friction and resonance frequency of the Ti6Al4V monolithic
alloy and the Ti6Al4V-SiCf composite after ageing at 900 K.
In the composite the background damping with respect to the as received samples (Fig. II-10) increases with temperature, moreover a small reduction of the modulus (frequency) occurs with reference to the values experienced in as fabricated condition (Fig. II-10). The P1 peak with a relaxation strenght similar to that observed on the
composite and significantly higher than that of the monolithic matrix alloy is observed also on the SP-700 alloy (Fig. II-12).
Peak P 1 P 2
Temperature (1 kHz) 120 250 – 270 Activation energy (eV) 0.21±0.02 0.50 ± 0.03
τ
0 10
Fig. II-12 Comparison of the internal friction of the P1 peak for the composite, the alloy and SP-700. The P1 peak is broader with respect to that resulting by assuming a Debye relaxation.
On the basis of the internal friction spectra presented above, the P1 peak can be
attributed to hydrogen . The activation energy obtained from the peak shift (Table II-5) is slightly lower than that reported for hydrogen diffusion in the β phase of vanadium free titanium [II-15], but is slightly higher than those obtained by NMR in titanium with vanadium additions [II-20]. A value comparable with our results, within the uncertainty of measurements, was obtained by internal friction measurements on the Ti6Al4V alloy [II-21] . In the SP-700 alloy spectra (Fig.II-12), a well resolved peak having roughly the same activation energy of the Ti6Al4V alloy is present. In the SP-700 alloy measurements performed at low frequency [II-22] yeld similar activation energy. The prominent P 1 peak can be therefore attributed to a Snoek type relaxation caused by
redistribution of interstitials hydrogen atoms in the β phase.
A significant difference in the P1 relaxation strenght is yet observed (Fig. II-12)
between the matrix alloy and the composite. Moreover the peak relaxation strenght in the SP-700 , mainly β phase alloy, is similar to that of the composite (Fig. II-12). The overall hydrogen content, measured was respectively : 116 ppm in the monolithic Ti6Al4V alloy, 187 ppm in the composite and 97 ppm in the SP-700 alloy. These values are within the low concentration solubility limit where a linear dependence of the (200) β phase XRD line breadth in Ti6Al4V was reported [II-22] and a proportionality
between the relaxation strenght and the amount of interstitial hydrogen responsible for Snoek relaxation , in the β phase is observed [II-23]. Therefore an apparent inconsistency for the differences in the relaxation strenght of the alloy and the composite Fig. II-12, could be explained by assuming different redistribution or segregation of hydrogen in different phases or at dislocations. In this regard it must be considered that dislocation density evaluated by XRD analysis [II-19] is one order of magnitude higher in the matrix alloy with respect to the composite.The relaxation strenght reduction Fig. II-12 after ageing, which is of the same order ( 50%) in the alloy and in the compositefor similar dynamic ageing treatments, is anyway consistent with a similar mechanism of hydrogen occupancy reduction of the interstitial sites in the bcc β phase responsible for the P 1 Snoek type relaxation. As regard the broad peak P 2
observed at around 250 K the average activation energy obtained by the peak shift method in the matrix alloy , Table II-5, correspond well within the measurement uncertainty, to that reported for hydrogen diffusion in the β phase [II-16] .
2.5 High temperature damping
2.5.1 Experimental
The microstructure and the mechanical properties of the Ti6Al4V-SiCf composite, have
been extensively investigated in as-fabricated condition and after long-term (up to 1,000 h) heat treatments at T = 873 K, i.e. the temperature foreseen for its application in aeronautical engines [II-13-26]. The experimental results demonstrated that the mechanical characteristics of this composite are preserved even after the treatments in the most severe conditions examined by us. This is possible due to the formation of thin TiC sublayer between the matrix and the fibres during the fabrication process at high temperature (1163 K). Because the diffusion of C in TiC is much slower than that in α-Ti, the chemical reaction is retarded and the interface remains substantially stable. This technique has been already used to study the monolithic alloy and a review of results is reported in the book of Blanter et al. [II-17]. In Mg composites, reinforced by C fibres, Schaller [II-27] has showed that thermal stress relaxation at the interface gives rise to transient mechanical loss due to dislocation motion.
IF results on the Ti6Al4V-SiCf composite have been reported in [II-19]: a new IF peak
was explained by considering a mechanism of re-orientation of interstitial-substitutional (i-s) pairs, induced by the applied alternate stress. This hypothesis, based on previous observations [II-24] of chemical gradients at the fibre-matrix interface, needed to be supported further by some experimental evidence. In particular it was necessary to determine the depth distribution of C not affected by a possible contamination occurring during the mechanical preparation of sample surface. Therefore, a physical simulation has been made by depositing a layer of graphite on Ti6Al4V foils and by investigating the depth profiles of chemical elements by means of X-ray photoelectron spectroscopy (XPS) before and after sample annealing in an ultra-high-vacuum (UHV) chamber at 773 K, a temperature quite lower than that used in composite fabrication (1163 K).
Fig. II-13. Cross-section of the composite. Fig. II-14. Microstructure of the composite near the fibre.
The matrix of the composite mainly consists of the hcp α phase with a minor amount (∼ 4 %) of the bcc β phase, i.e. of the same structure of the monolithic Ti6Al4V alloy. As it is shown in Fig. II-13, the SCS-6 fibres are coated by a 3 µm thick carbon layer. TEM investigation demonstrated the following features: (i) good quality of the fibre-matrix interface without debonding, (ii) the presence of a layer of TiC between graphite coating and matrix, (iii) a banded structure of the matrix near the fibres (Fig. II-14), (iv) few free dislocations near the fibres. The dislocation density in the α phase, determined by X-ray diffraction (XRD), was 6.1 x 109 cm-2 for the composite and 5.5 x 1010 cm-2 for the monolithic alloy [II-25].
The dynamic modulus is proportional to f 2 thus its relative change as temperature
increases can be described by the curve (f/f0)2 vs. T , being f0 the resonance frequency at
room temperature.
The temperature has been increased from room temperature to 1173 K at a heating rate of 1.7 x 10⁻² Ks-1. Strain amplitude was kept lower than 1 x 10⁻⁵. For comparison, all these experiments have been performed for the samples of the composite and monolithic Ti6Al4V alloy.
For physical simulation of the interface between the matrix and graphite, ad hoc samples have been prepared by depositing (thermal evaporation) a thin layer of graphite
on Ti6Al4V foils. Then these samples were annealed in UHV (< 10-8 mbar) at
T = 773 K. XPS depth profiling of the samples before and after annealing has been
performed in order to determine the chemical composition of the interface.
XPS experiments have been carried out in an ESCALAB MkII spectrometer (VG Scientific Ltd), equipped with standard Al Kα excitation source and a 5-channeltron detection system, at a base pressure of ∼ 10-10 mbar. For the depth profiling, the Ar+ ion
gun has been set to the energy of 1.0 keV and the sample current density of about 2 µA cm-2. The binding energy (BE) scale was calibrated by fixing the C 1s peak of the graphite at BE = 284.6 eV. The accuracy of the measured BE was ± 0.1 eV. More experimental details on XPS depth profiling have been reported elsewhere [II-15,25].
2.5.2 Results
The trends of Q-1 and (f/f
0)2 vs. T for monolithic alloy and composite are shown in
Fig. II-15. The Q-1 curve of the composite displays a peak superimposed to an
exponentially increasing background. In correspondence of the peak, the modulus exhibits a change.
Fig. II-15 Q-1 and (f/f0)2 vs. T trends of the composite (f0= 898 Hz). The Q-1curve is
the superposition of a Debye peak and an exponential background. The IF curve of the monolithic Ti6Al4V alloy is displayed for comparison.
The IF spectrum vs. temperature T can be fitted by the sum of two contributions: an exponential curve for the background, Q-1
B (T), and a single Debye peak, Q-1P (TP):
⎟⎟ ⎠ ⎞ ⎜⎜ ⎝ ⎛ − ∆ + = + = − − − − P B P B T T R H h T Q T Q T Q T Q sec 1 1 2 ) ( ) ( ) ( ) ( 1 1 1 1 (II-1)
being ∆/2 the peak maximum, H the activation energy of the physical process giving rise to the IF peak, R the gas constant and TP the temperature of peak centre. The peak
position depends on the resonance frequency thus it is a relaxation peak. This is supported by another result: repeated test cycles on the same sample do not induce any permanent changes of resonance frequency f0 and Q-1 at room temperature.
For a relaxation peak, the temperature of peak maximum TP depends on the resonance
=2 0 RTP =1 H e f
τ
π
ωτ
. (II-2) Therefore, the activation energy H and the relaxation time τ0 can be determined by thetests carried out with different resonance frequencies. From the Arrhenius plot in Fig. 16, the values of H = 186 kJ mol-1 and τ0 = 2.3 x 10⁻¹⁵ s have been obtained.
Fig. II-16 Arrhenius plot for the determination of H and τ0
In the alloy, the IF peak was not observed, while the exponential background was higher than that of the composite.
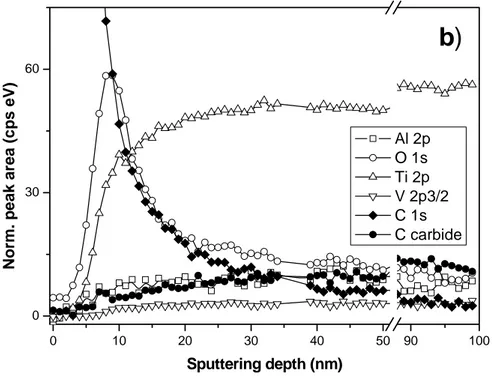
XPS depth profiles of ad hoc samples (thin C film deposited on Ti6Al4V alloy) before and after annealing in UHV for 22 hours at 773 K are shown in Fig. II-17. Zero point of sputtering depth in both profiles corresponds to the surface of graphite overlayer characterized by C 1s peak at BE = 284.6 eV. Going deeper into the sample, the signal of C 1s remains at the same value of BE, however this fact does not indicate the continuation of graphitic structure, but corresponds to atomic C diffused into metallic alloy. A sublayer of native metal oxides (O 1s line) without any changes after annealing is observed at the graphite/metal interface. The presence of titanium carbide (C carbide line) in the as-prepared sample can be explained by the sample modification induced by
ion sputtering [II-15,25]. Such a modification, promoting the formation of TiC even at low ion energies, has been observed also in metallic Ti samples [II-26]. The increase of carbide signal in annealed sample (Fig. II-17b) is caused by thermal formation of TiC, which was detected previously in pure Ti samples [II-15,29]. However, the most important feature of micro-chemical composition of annealed sample is a deep diffusion (∼ 100 nm) of atomic carbon (C 1s line in Fig. II-17b) into metallic matrix.
2.5.3 Discussion
The IF background of the monolithic Ti6Al4V alloy is noticeably higher than that of the composite. The background is strongly structure-sensitive [II-30] and the difference can be explained by considering a different contribution from dislocation damping in the two materials: the grain size is near the same (~ 30 µm), while they have a different dislocation density (one order of magnitude higher in the alloy).
0 10 20 30 40 50 90 100 0 50 100
a)
N o rm . pe a k a re a (c ps e V ) Sputtering depth (nm) Al 2p O 1s Ti 2p V 2p3/2 C 1s C carbide0 10 20 30 40 50 90 100 0 30 60
b)
Norm. p e ak a rea (c ps eV) Sputtering depth (nm) Al 2p O 1s Ti 2p V 2p3/2 C 1s C carbideFig. II-17 XPS depth profiles of of the C/Ti6Al4V sample before (a) and after (b)
annealing in UHV at T = 773 K.
The IF spectrum of the composite shows a Debye peak which is not observed in the alloy. Therefore, its origin is connected to the presence of the fibres and their effects on the surrounding matrix. To identify the physical origin of this peak, some hypotheses have been considered. Several phenomena, giving rise to the energy dissipation, may occur at the fibre-matrix interface, when the composite is subjected to thermal and/or mechanical stresses. At high stresses, plastic flow and interface de-bonding may occur, while at low stresses, the matrix and the fibres undergo only elastic distortions.
The effects of plastic flow and fibre-matrix de-bonding on damping have been discussed by Schaller [II-27]. Due to the different thermal expansion of matrix and fibres, internal stresses arise during the production process, when the samples are cooled from HIP temperature of 1163 K to room temperature. However, TEM observations show few free dislocations near the fibres. On the other hand, a simple calculation shows that these stresses are not sufficiently high to induce the formation of dislocations. The mean stress αM in the matrix caused by cooling from HIP temperature (THIP) to room
( )( ) )) 1 ( ( M F HIP R M F M F M T T E E E E − − − + = φ α α φ φ σ (II-3) where EF , αF and EM , αM are the Young’s modulus and the coefficient of thermal
expansion of fibre and matrix, respectively; φ is the volume fraction of fibres.
Introducing in Eq. (II-3) the values of EF = 400 GPa, EM = 114 GPa, αM = 9.6 x 10⁻⁶
K-1, αF = 4.1 X 10⁻⁶ K-1 and φ = 0.3, was obtained σM = 350 MPa. This value is much
lower than the matrix yield stress (850 MPa). Therefore, plastic flow and de-bonding at the fibre-matrix interface can be ruled out as possible causes of the IF peak. The attention has been focused then on elastic strains at the interface. This condition has been analysed by He and Lim [II-31] on the basis of the interfacial diffusion mechanism [II-32]. When a shear stress is applied to the interface, which is not perfectly planar on a microscopic scale, it is under tension at some locations and under compression at some others, as shown schematically in Fig. II-18. The stress gradient induces the atom diffusion along the interface, causing anelastic behaviour. However, the activation energy H = 186 kJ mol-1, determined from present experiments, is quite different from those controlling the atomic diffusion of Ti, Al and V in both α and β phases, present in the matrix, thus the IF peak can not be ascribed to such a mechanism.
Fig. II-18 Schematic view of the fibre-matrix interface, which is not perfectly planar on a
microscopic scale. When a shear stress is applied some locations are in tension, others in compression.
τ
Compression
Tension
Fibre
Also the diffusion processes inside the fibres, which have a stratified axial-symmetric structure, are not compatible with the peak activation energy because H = 318 kJ mol-1 for C in SiC [II-33] and H = 911 kJ mol-1 for Si in SiC [II-34] .
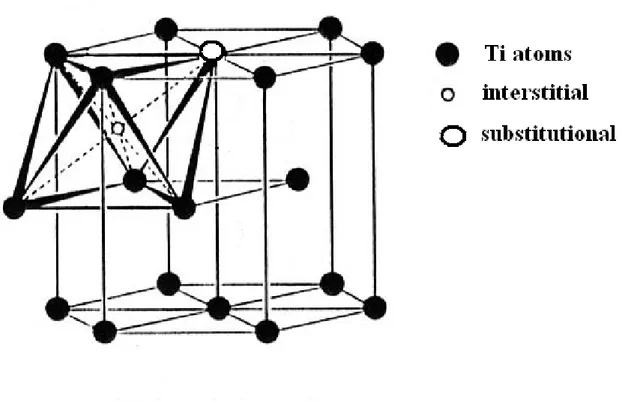
As shown in Fig. II-13, the fibres are coated by a carbon layer (thickness ≈ 3 µm) which separates SiC from the matrix. During the process of composite fabrication, carried out at high temperature (1163 K), carbon reacts with titanium, forming a thin layer (few nanometers thick) of titanium carbide (TiC) [II-15,17,25]. TiC thickness is increasing when the material is heated, but this kinetics is very slow. The activation energy for TiC growth, independently determined by Naka et al. [II-31], is of 194 kJ mol-1, i.e. it is very close to that of IF peak. Therefore, the peak seems somehow connected to the growth of the TiC layer between the carbon coating of the fibre and the matrix. Furthermore, it is necessary to consider that TiC activation energy is very close to that of carbon diffusion in the α phase of Ti (H* = 182 kJ mol-1). The distribution of elemental composition determined by XPS depth profiling microchemical profiles (Fig. II-17) testifies that in the matrix around the fibre exists an extended zone (at least 100 nm wide), where the content of carbon is relatively high. Of course, this process can not occur in monolithic alloy, where a very low concentration carbon is homogeneously distributed. On these grounds, it is possible to suppose that the IF peak is caused by the stress-induced reorientation of i-s pairs (C-Al and C-V) in the hcp α phase of the matrix near the fibres. Fig. II-19 illustrates the presence of i-s pair in the α phase.
Fig. II-19 Interstitial substitutional (i-s) pair in the h.c.p. lattice of the composite α phase.
This mechanism for hcp metals has been discussed by Gupta & Weining [II-36] and Povolo & Bisogni [II-37].
2.6 High temperature comparison between Ti6Al4V-SiC
fproducted by
HIP and RDB
2.6.1 Experimental
Roll Diffusion Bonding onding (RDB) is a new process, developed at C.S.M., for producing Ti composite composites reinforced by long fibres. The prototypal “diffusion bonding” plant p permits t ermits to co co-roll at high temperature in superplastic rolling field (under tempe temperature and strain rate control) rature foils of titanium alloy and fabrics made of SiC monofilaments.
The innovative RDB laboratory laboratory-equipment has been developed at C.S.M. laboratories and patented (n° 2006A000261, May 2006) [II-40].
The process permits to manufactur manufacture Ti-composite sheets with a mono-directional reinforcement of SiC fibres; in this case the matrix is the Ti6Al4V
alloy and the reinforcement consists of fibres SCS-6, whose internal structure is displayed in Fig. II-20a). Two metallic strips are assembled with a layer of fibres between them (Fig. II-20b) and co-rolled.
Fig. II-20 a) SCS-6 fibre structure. b) RDB composite layering.
The bonding process is completed in about 10 s. The main parameters adopted for the first dimensioning of the pilot plant are: process temperature = 900 °C, mean pressure in the contact arc = 500 MPa, time = 6 s. More details are reported in [II-40].
Samples for observations and analyses were obtained by spark erosion from composite sheets.
Optical and electron microscopy observations have been performed on cross-sections, after mechanical polishing and etching in Kroll reagent.
XPS and AES analyses, described elsewhere [II-38], have been done by using an Escalab Mk II spectrometer (VG Scientific, UK) equipped with 5-channeltron detection system. Photoelectrons were excited by using a standard Al Kα excitation source, while
Auger electrons were induced by electron gun LEG 200, operated at 10 keV and 1 – 10 nA current. XPS spectra were collected at constant analyzer pass energy of 20 eV, while AES spectra were registered in constant retard ratio (1:2) mode.
XRD measurements have been carried out using the Co-Kα radiation ( λ = 1.79 Å). Spectra were collected in step step-scanning mode with 2 Θ steps of 0.05° and counting time of 2 s per step in the angular range 10° - 100 °.
High precision peak profiles of the most intense reflections of α phase were recorded with 2 Θ steps of 0.005° and counting time of 20 s per step.
Micro-hardness tests have been carried out on cross-sections of RDB and HIP composites.
Mechanical spectroscopy experiments, i.e. internal friction and dynamic modulus measurements, have been carried out on bar-shaped samples using the method of frequency modulation. The VRA 1604 apparatus used in the experiments has been described in deta detail in [II-41]. The resonance frequencies were in the he kHz range. The samples . have been heated from room temperature to 850 °C with a heating rate of 1.7 x 10⁻²°Cs-1.
2.6.2 Results and discussion
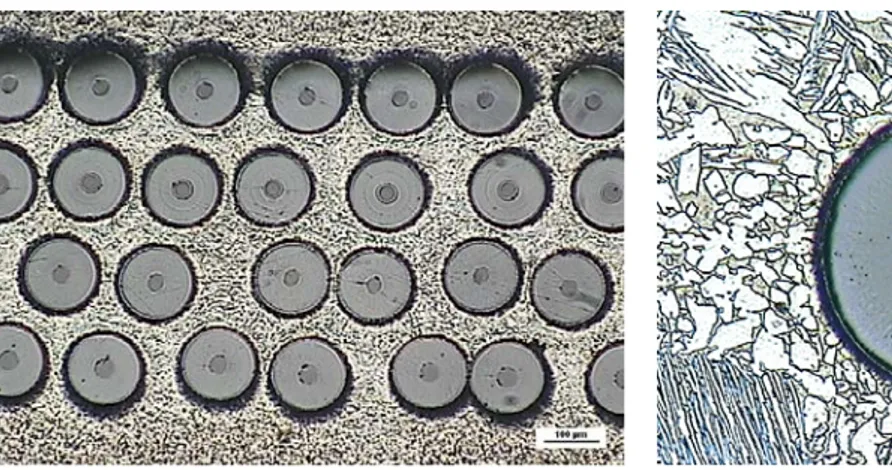
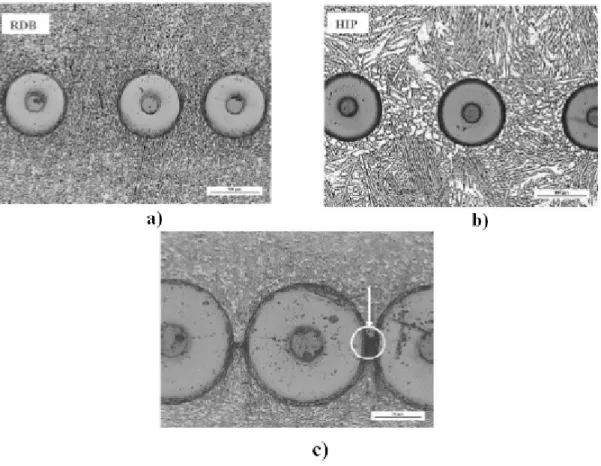
Micro-hardness of RDB composite is higher ( 500 HV) than that of HIP one (323 HV). Fig. II-21 (a-b) compares the structures in t the cross section he sections of s RDB (a) and HIP (b) composites. It can be observe observed that the grains after RDB have smaller size and more homogeneous shape than those after HIP. The mean grain sizes are 5 and 30 µm for RDB and HIP composites respectively.
Sometimes samples of RDB composite, cut near the rim of the sheet, exhibit cavities due to an incomplete metal flow in the interstices between the fibres ( Fig. II-21 c).
Fig. II-21 Cross sections of the RDB (a and c) and HIP composites. In c) a cavity due to an incomplete metal flow is evidencied.
XPS results are summarized in Table II-6, where the atomic concentrations and binding energy (BE) values of the main XPS peaks of elements (Ti, Al, C, Si and O) are reported reported. These peaks were assigned to the oxidized Ti (BE = 458.3 eV) and Al (BE = 74 ÷ 75 eV) in the alloy matrix and SiC fibres (C 1s at BE = 283.0 eV and Si 2p at BE = 100.2 eV). The lowest BE of Ti 2p3/2 peak (~ 454 eV) corresponds to metallic
Ti. Moreover, the contribution of graphitic carbon (BE = 284.4 eV) from the core and external coating of the fibres was also revealed. The amount of surface oxides (BE = 530.5 ÷ 531.8 eV) and carbon contamination (BE = 285 eV) was significantly reduced after a brief cycle of Ar+ sputtering at 2 keV. However, in XPS results it is difficult to identify the presence of TiC because the component of another carbide (SiC) is already present in C 1s spectra, while the first component in Ti 2p spectra (BE = 454.3 eV) could be due to carbide, but it overlaps with metallic Ti.
Tab II-6-XPS quantitative analyses: atomic concentrations and BE values of the elements in the composite (after 30 minutes of ion sputtering) and in the alloy (without fibres).
The results of AES measurements carried out on the five points across the fibr fibre/matrix interface indicated in Fig. II-22a, are shown in Fig. II-22b. The peak intensity o he of AES spectra demonstrate that Ti-C inter inter-diffusion occurs during RDB process, in particular C deeply penetrates into the matrix.
Moreover, the O presence is confirmed in the fibre but especially in the matrix. Similar results have e been obtained from analyses of the HIP composite [II-37].
Fig. II-22 a) SEM image (80 x 80 µm2 ) of teh fibre-matrix interface; the markers
(1-5) indicate the pionts of Auger spectra acquisition. b) Auger spectra measured in the points 1-5.
XRD showed that peak profiles of RDB composite are quite broader than the corresponding profiles
of HIP composite. An example is displayed in Fig. II-23 where the intensities and positions of the {100 } peaks have been normalized for making easier the comparison.
Fig. II-23 Precision {100 } peak profiles of HIP and RDB composites.
For each XRD reflection the total line broadening βT , corrected from instrumental
broadening, is basically due to two contributions, the size of coherently diffracting domains ( βD ) and the micro micro-strains ( βε ). βT can be written as:
ε θ θ λ β β β ε 2 tan cos + = + = D K D T (II-4)
where D is the domain size, ε the average micro micro-strain, ϑ the Bragg angle, λ the X-ray wavelength and K a constant (= 0.89). In the case of Ti and Ti alloys the coherently diffracting domains are the grains.
Introducing in Eq. II-4 the D values determined for the two composites by metallographic observations
the micro micro-strain ε has been determined. Finally, the dislocation density ρ was calculated by means of the Williamson -Smallman relationship [II-42]:
2 0 2 b k ε υ = Ξ (II-5) where Ξ =16 is a constant, b is the modulus of Burgers vector and k0 ≅ 1 is a factor
depending on dislocation interaction. From this calculation the values of tion ρ = 1.1 x 1012cm-2 for the RDB composite and ρ = 6.0 .0 x 10 9cm-2for the HIP composite have been obtained obtained; they are in good agreement with the larger hardness exhibited by the RDB composite.
Fig. II-24 a) shows Q-1 and (f/f
0)2 vs. T trends of the RDB composite. From the
resonance frequency the elastic modulus E = 137 GPa has been determined determined, which is the same value of HIP composite. The Q-1curve shows a peak at about 900 K
superimposed to an exponentially erimposed increasing background, in correspondence of the peak the elastic modulus, proportional to f 2, exhibits a change. In tests with
different frequencies the peak position changes indicating that the IF peak is a relaxation peak. The corresponding activation e energy nergy H = 189 kJ/mol and the relaxation time τ0 = 2 x 10 10-15s are very close, inside the experimental error, to those
determined for the HIP composite ( H = 186 kJmol-1, τ0 = 2.3 x 10⁻¹⁵ s) thus it is the
same IF peak in the two materials. The anelastic phenomena giving rise to the peak have been extensively discussed in [II-19]: it was ascribed to stress induced reorientation of interstitial interstitial-substitutional (i-s) pairs (C-Al and C-V) in the hcp α phase of the matrix near the fibres according to the mechanism discussed by Gupta & Weining [II-36] and Povolo & Bisogni [II-37] for hcp metals.
Moreover, comparing the IF curve curves of the two materials in Fig. II-24 b) the RDB composite exhibits a higher background. The background is strongly structure-sensitive [II-30] thus the result can be easily explained by considering the smaller grain size and the higher dislocation density of the RDB composite which provide a greater contribution to the damping.
a)
b)
Fig. II-24 a) IF and (f/f0)2 trends of RDB composite. The IF curve exhibits the
superposistion of an exponentially increasing background and a Debyepeak. b) Comparison between IF curves of RDB and HIP composites.
The microstructure of Ti6Al4V+SiCf composite produc produced by RDB shows
smaller grains and higher dislocation density with respect to that prepared by HIP; these features guarantee better mechanical properties.
As shown by XPS and AES analyses, the structure of the fibre fibre-matrix interface is substantially the same after RDB and HIP, therefore it is reasonable to expect a similar mechanical behaviour of the two materials after long term heat treatments at temperatures up to 600 °C. The mechanical properties of RDB composite should be scarcely affected by the treatments also in the most severe conditions (1000 hours), as
already observed for HIP composite. Experimental tests are underway to assess the hypothesis.
Also the IF spectra of the composites are similar. They exhibit a relaxation peak superimposed to an exponentially increasing background. The peak is due to C-Al and C-V pairs reorientation in the α phase of Ti6Al4V matrix around the fibres. The background, which is strongly structure sensitive, is higher for the RDB composite owing to its dislocation density and smaller grain size.
On the basis of present results RDB seems to be advantageous with respect to HIP for producing Ti-composites because the costs are lower and the mechanical properties better.
References
[II-1] Debolt H.E., ‘‘Boron and Other High Strength, Low Density Filamentary Reinforcing Agents’’, Handbook of Composites, ed. G. Lubin, Van Nostrand Reinhold, 1982, 69-76.
[II-2] Nourbakhsh S. and Margolin H., Proc. TMS annual meeting in Anaheim, CA, U.S.A., ‘‘Metal and Ceramic Matrix Composites’’, 75, (1990) p75.
[II-3] Mittnick M.A., Proc. TMS annual meeting in Anaheim, CA, U.S.A., ‘‘Metal and Ceramic Matrix Composites’’, 605, (1990) p605.
[II-4] Jha S.C., Forster J.A., Pandey A.K., Delagi R.G., Cold Rolled Titanium
Aluminide and Titanium Alloy Foils ISIJ International Vol.31 10, 1991, pp.1267-1271.
[II-5] Structural Materials Handbook, Vol. 2: new advanced materials(section XI), ed. European Space Agency, 1994.
[II-6] Clyne T.W., “3.7.12. Metal Matrix Composites: Matrices and Processing”,
Encyclopaedia of Materials: Science and Technology, §3.7, Composites: MMC, CMC, PMC, ed. A Mortensen, Elsevier, 2001, 1-14.
[II-7] Upadhyaya D. et al., ‘‘A Comparison of SCS-6/Ti-6Al-4V and Sigma SM1240/Ti-6Al-4V Composite System: a Microstructural Characterization’’, Recent
Advances in Titanium Metal Matrix composites, ed. F. H. Froes and J. Storer.
Warrendale, PA: TMS The Minerals, Metals & Materials Society 139, 1995, 139-145. [II-8] C.Arvieu, J.P.Manaud, J.M.Quenisset, Interaction between titanium and carbon
at moderate temperatures, Journal of Alloys and Compounds 368 (2004), 116-122
[II-9] Y.C.Fu, N.L.Shi, D.Z.Zhang, R.Yang, Effect of C coating on the interfacial
microstructure and properties of SiC fiber-reinforced Ti matrix composites, Materials
Science and Engineering A426 (2006), 278-282
[II-10] G.Das, Study of the Reaction Zone in an SiC Reinforced Titanium Alloy
Composite, Metallurgical Transactions A Vol.21A (1990),1571-1578
[II-11] P.Martineau, R.Pailler, M.Lahaye, R.Naslain: SiC filament/titanium matrix
composites regarded as model composites (Part2: Fibre/matrix chemical interactions at high temperature), Journal of Materials Science 19 (1984), 2749-2769
[II-12] Testani C. and Ferrato F., Sviluppo di un processo a basso costo per realizzare
materiali compositi a matrice di titanio mediante “Roll Diffusion Bionding”, La
Metallurgia Italiana (2008), 9-14
[II-13] M.E. Tata, R. Montanari, C. Testani, G. Valdrè, La Metallurgia Italiana 7-8 (2005) 43.