Agrosystems
Genotype × Environment Interactions of Industrial Hemp Cultivars
Highlight Diverse Responses to Environmental Factors
Brian J. Campbell, Abdel F. Berrada, Chris Hudalla, Stefano Amaducci, and John K. McKay* Core Ideas
• Some hemp traits are more strongly affected by environmental factors than others.
• Multi-environment testing is an integral part of hemp cultivar development. • Water availability can have a significant
impact on yield and other traits.
B.J. Campbell and J.K. McKay, Colorado State Univ., Dep. of Bioagricultural Sciences and Pest Management, 307 University Ave, Fort Collins, CO 80523; A.F. Berrada, Colorado State Univ., Dep. of Soil and Crop Sciences, 307 University Ave, Fort Collins, CO 80523; C. Hudalla, ProVerde Laboratories, 420 Fortune Blvd., Milford, MA 01757; and S. Amaducci, Dep. of Sustainable Crop Production, Univ. Cattolica del Sacro Cuore, via Emilia Parmense, 84, Piacenza, Italy.
Received 17 Nov. 2018. Accepted 21 May 2019.
*Corresponding author (jkmckay@colostate. edu).
ABSTRACT
Starting with the 2014 Farm Bill, hemp (Cannabis sativa L.) is being re-introduced as an industrial
crop in the United States. Since the crop has been absent for over 70 yr, little is known regarding the genetic mechanisms controlling economically relevant traits. Particularly, with federal legality of the crop hinging on a stringent tetrahydrocannabinol (THC) content of 0.3% or less, it is necessary to assess variance in this trait due to environmental effects and genotype × environment interactions (GEI) to avoid running afoul of federal law. Understanding how physical and biochemical traits respond to the environment also plays a strong role in selecting and developing appropriate cultivars for production in diverse growing regions. In 2016 we performed cultivar trials in multiple environments in Colorado to assess performance characteristics of a diverse set of germplasm from breeding programs across Europe and Asia. From these data, we were able to identify traits nearly entirely controlled by genetic factors, like days to maturity and THC and cannabidiol (CBD) production. We also identified traits strongly influenced by the environment and GEI, like grain yield, plant height, and water use. Individual cultivars also exhibited widely varying degrees of sensitivity to the environment. This underscores the importance of continued work to characterize genetic control of hemp traits to expedite breeding of cultivars that are well-adapted to target growing regions.
Abbreviations: d13C, carbon isotope ratio; AMMI, Additive Main Effect and Multiplicative Interaction; CBC, cannabichromene; CBD, cannabidiol; CBDA, cannbidioalic acid; CBDV, cannabidivarin; CBG, cannabigerol; CBGA, cannabigerolic acid; CBN, cannabinol; DTM, days to maturity; GC-FID, gas chromatography–flame ionization detector; GEI, genotype × environment interactions; PLHT, plant height; QTL, quantitative trait locus; THC, tetrahydrocannabinol; THCA, tetrahydrocannabinolic acid; THCV, tetrahydrocannbivarin; WUE, water use efficiency.
© 2019 The Authors. This is an open access article distributed under the CC BY-NC-ND license (http://creativecommons.org/licenses/by-nc-nd/4.0/)
Agrosyst. Geosci. Environ. 2:180057 (2019) doi:10.2134/age2018.11.0057
I
ndustrial hemp (Cannabis sativa L.) has been primarily a fiber or a dual-purpose (fiber andgrain) crop (Amaducci et al., 2015), but it is generally recognized as a multi-purpose crop having a vast diversity of actual and potential end uses, including food, fuel, textile, non-intoxicating medicine, and many industrial products like lubricants, bioplastics, paper, and concrete (Amaducci and Gusovious, 2010; Salentijn et al., 2015; Schluttenhofer and Yuan, 2017). The United States placed de facto prohibition on hemp farming until 2014. In 2014 the US Farm Bill (US Government Printing Office, 2014) defined hemp as Cannabis sativa
with a tetrahydrocannabinol (THC) content of 0.3% or less and permitted cultivation of the crop in states with amenable laws under the oversight of university research or State Depart-ments of Agriculture (US Government Printing Office, 2014). Since then, most US states have passed legislation to allow cultivation of hemp. The 2018 Farm Bill removed hemp from the Controlled Substances Act and will force various federal agencies to regulate hemp like “normal” crops.
Since no US germplasm has been maintained through the 77 yr of prohibition and coordinated efforts were made to remove hemp seeds from American gene banks during the Reagan Drug War era (Small and Marcus, 2003), only feral hemp remains in the United States, and testing unadapted germplasm from abroad is a logical starting point for the reintroduction of hemp. This study represents the first attempt in Colorado to perform hemp trials using germplasm developed abroad. These types of cultivar trials help
to establish both the fitness of current cultivars for production in a novel target population of environments, as well as to assess stability of commercially important traits. Due to inherent plasticity, it is important that these newly introduced cultivars are tested in multiple environments to assess the degree of trait variance in the phenotypes produced by a cultivar. These multi-environment trials are common in plant breeding, helping to discriminate cultivars with wide or specific adaptation, as well as determining environmental factors that are strongly influencing traits of interest (Makahiya et al., 2017).
Utilizing these types of multi-environment trials, it is possible to discriminate trait variation that is due to genetic effects, environmental effects, and genotype × environment interactions (GEI). This is useful information to ascertain whether observed phenotypes are a product of genetic factors, which may be heritable, vs. environmental factors, which are not. Trait variance due to GEI is also interesting because it demonstrates a range of plasticity in a population. Visible or measurable phenotypes are a complex product of many factors, and dissecting trait variance in this way is an important first step in understanding how specific phenotypes are produced, as well as the overall stability or plasticity of a trait or cultivar. Cultivars that are less sensitive to environmental changes exhibit broad adaptation and may be suitable for production in a wide range of environments, whereas more plastic cultivars may be highly adapted to a specific region, but an unsuitable choice for other areas.
Yield of all crops in Colorado is limited by available precipitation. This is particularly true for summer row crops, where lack of soil moisture affects stand establishment, plant development, and yield. In this experiment, we manipulated irrigation as a major environmental factor to which genotypes may differ in response and which plays a significant role in crop management. One of the primary traits of interest to farmers is cannabinoid content, particularly THC content due to its legal implications. Tetrahydrocannabinol imparts the psychoactive effects that cannabis is known for, and if a crop of industrial hemp tests above the stringent threshold of 0.3%, it is in violation of federal law. There is also current interest in cannabidiol (CBD) as THC’s non-psychoactive counterpart with potential therapeutic uses covering a wide range of ailments (Gallily et al., 2015). Little has been published on the genetic control of cannabinoids in general. A single quantitative trait locus (QTL) study characterized genetic control of chemotype (high THC–low CBD, high CBD– low THC, or intermediate types), but did not detect any significant QTL for cannabinoid content (Weiblen et al., 2015). Although this is an important first step in understanding the genetic architecture of cannabinoid production, understanding the relative influence of genetics and environment warrants further exploration to mitigate risk and inform efforts to create high yielding, federally compliant cultivars. In addition to major cannabinoids, hemp also produces a wide range of terpenes that contribute aroma and flavor to the hemp flower, act as a natural insecticide, and have potential medicinal and therapeutic uses (Russo, 2011). These compounds can be extracted from the hemp flower to create additional value-added by-products for hemp farmers.
However, the chemical makeup of hemp is not its only important feature. Depending on markets and infrastructure the most valuable parts of the plant may vary, but the majority of its potential products are produced in the flowers, stalks, and grain. Therefore, a host of agronomic characteristics are important for successful crop production, including grain and fiber yield and crop phenology. We assessed many of these agronomic traits, as well as measuring
carbon isotope ratio (d13C) in leaves, which is directly related to water use efficiency in plants (Donovan and Ehleringer, 1994). There is a clear need for all performance-related and physiological traits to be explored to help hemp breeding and production “catch up” to other crops that have not had the same legal restrictions and stigmatization. Genotype × environment interaction studies are a first step to selecting or breeding appropriate hemp cultivars for new environments in the United States and abroad. The aim of this study is (i) to assess the performance of a diverse set of hemp cultivars from Europe and Asia in multiple environments representative of Colorado’s population of target environments, and (ii) to determine the extent to which genetic and environmental factors influence economically important traits.
MATERIALS AND METHODS Plant Materials
Seed from a set of 13 cultivars of industrial hemp collected in the frame of the European project Multihemp (multihemp.eu) were imported from Italy to Colorado for the 2016 cultivar trials. Supplemental Table S1 lists the cultivars assessed, as well as their country of origin, latitude, and whether or not the cultivars were dioecious or monoecious types. Monoecious types have been bred to be “dual-purpose” (i.e., useable for both grain and fiber applications), whereas dioecious types are historically intended for fiber production (Tang et al., 2017).
Environments
Trials were planted at two separate locations, representing distinct growing regions of Colorado. One location was at Colorado State University’s primary research farm, the Agricultural Research, Development, and Education Center. This facility is in Fort Collins, Colorado at latitude 40.65 and longitude -105.00, with an elevation of 1557 m and average annual precipitation of 408 mm. The soil texture at this location is a sandy clay loam. The Agricultural Research, Development, and Education Center is equipped with an overhead linear sprinkler irrigation system, which was used to irrigate these trials. The second location was at the Southwestern Colorado Research Center, near Yellow Jacket, CO, at latitude 37.53 and longitude -108.72. This site has an elevation of 2103 m and an average annual precipitation of 405 mm. The soil at this research facility is Wetherill silty clay loam (fine-silty, mixed, superactive, mesic Aridic Haplustalfs) and irrigation was applied by an overhead pivot sprinkler system.
To reduce visibility of the trials, dent corn (Zea mays L.) was
planted as borders on all sides of the experiments. The seedbed was prepared by disking and soil tests were performed to determine the levels of minerals present in the soil. Target fertilizer levels were 112 kg ha-1 N, 90 kg ha-1 P, 112 kg ha-1 K, and 39 kg ha-1 S. To
achieve these levels, 54 kg ha-1 N, 45 kg ha-1 P, and 13 kg ha-1 S were
incorporated into the soil at the Fort Collins site and 61 kg ha-1 N and
39 kg ha-1 of P were added at Yellow Jacket. Glyphosate (RoundUp
Powermax, Monsanto) and ethalfluralin (Sonolan, Dow Agrosciences) were applied before planting to remove weeds.
Planting methods were the same at both sites. A seed drill was used to plant at a depth of approximately 2.5 cm, with a target plant density of 120 plants m–2 (Tang et al., 2017). Seeding rates
were increased from that target density proportional to germination rates among cultivars, and this rate was then doubled to account for
expected seedling mortality due to challenging soil conditions in Colorado. Weeds were controlled by hand and no pesticides were applied during either growing season. Weather data for both locations were obtained from the Colorado Agricultural Meteorological network and the National Oceanic and Atmospheric Administration National Climatic Data Center.
Precipitation and Irrigation
Yellow Jacket received more rainfall than Fort Collins. For the purpose of analyzing environmental data, we defined the growing season as the date of planting to the date that the last plot was harvested. In 2016, minimal rainfall was experienced at Fort Collins, with growing season rainfall of 53 mm (27.3% of the 30-yr average for the growing season). Two irrigation treatments were utilized at Fort Collins (described below). A “limited irrigation” treatment received 147 mm of overhead sprinkler irrigation and “fully irrigated” treatment received 398 mm of supplemental irrigation throughout the season. Yellow Jacket also experienced lower than average rainfall, with a season total of 121 mm, representing 73.6% of the 30-yr average. Irrigation at this site was also delivered by overhead sprinkler irrigation in the amount of 203 mm. Precipitation for the 2016 growing season is compared with 30-yr averages in Supplemental Table S3.
Experimental Design
At Fort Collins, a Latinized row-column design was used, and a randomized complete block design was used at Yellow Jacket. In both locations, cultivars were replicated four times in the experiment, but with slightly different plot sizes. The plots at Fort Collins were six row plots that were 6.1 m in length with approximately 0.25 m spacing between rows. Plots at Yellow Jacket were six row plots, 9.1 m in length with 0.20 m spacing between rows. Because previous data for hemp evapotranspiration and irrigation rates in Colorado were not available, irrigation rates were adjusted as necessary throughout the season.
At Fort Collins, two different irrigation treatments were employed in 2016, one “fully irrigated” treatment approximating 100% of evapotranspiration and one “limited irrigation” treatment where irrigation was only applied to establish seedlings and if severe wilting was observed, effectively doubling the size of the experiment (i.e., four replications of the set of cultivars in each treatment). These treatments are referred to as “wet” and “dry,” respectively, and were treated as discrete environments. The differential irrigation was employed to explore the effects of drought stress on hemp productivity. At Yellow Jacket, only a “fully irrigated” treatment was planted due to resource limitations. The Fort Collins trial was planted on 31 May 2016 and the Yellow Jacket trial was planted on 7 June 2016.
Data Collection
Plant height was measured as the vertical distance from the soil surface to the apical tip of a plant. Plant heights were measured once weekly from mid-July until plants stopped growing near maturity. Five random plants were chosen per plot each week and all four replications were measured. Plant heights reported are final plant heights.
The procedure used for determining flowering stage and maturity is fully described in Supplemental Table S2. The date that more than 50% of plants in a plot reached a given growth stage was scored and the number of days that elapsed between planting and that stage were calculated. Observations were taken three times weekly for these traits and were based on visual observations. Plant maturity was
only measured for female/monoecious plants and was considered as seed maturity (i.e., when bracts began to dehisce and darkening of the seed coat was visible). Plots were harvested within 3 d of being scored for seed maturity and plants were bundled and hung to dry.
Total plant biomass, referred to as biomass or dry biomass, was measured as the mass of the aboveground portion of all of the plants in a plot. Plants were cut at the soil surface and air-dried for a minimum of 30 d. The plants were then weighed before threshing.
Grain was separated from the flowers using a mechanical thresher (Almaco, Nevada, IA) and seed was cleaned using a column blower (Agriculex, Guelph, ON, Canada). Grain was air-dried to approximately 8 to 10% seed moisture, as determined by a GAC 500XT grain moisture tester (Dickey-John, Auburn, IL) and weighed to obtain grain yield.
Stand establishment was calculated as the number of plants standing at harvest, divided by the total number of seeds planted, and multiplied by 100. Since this trait was based on an “over-seeding” rate, a stand establishment rate of 50% is considered optimal.
Biochemical Trait Analysis
Biochemical traits were analyzed from flower and leaf samples collected at Fort Collins only. The top 10 cm of female flowers were collected from three random plants per plot at maturity. Seeds were removed from the flowers by hand and composite samples were made with the flower chaff from each plot. Cannabinoid and terpene profiles were analyzed using high-performance liquid chromatography and gas chromatography with flame ionization detector (GC-FID) by ProVerde Labs (Milford, MA). Carbon isotope composition was measured by mass spectrometry of dried and ground leaf samples as described by Ehleringer and Osmond (1989).
Sample Preparation for Cannabinoid Analysis
Sample preparation for the analysis of cannabinoid profiles was performed by extraction of the cannabinoids in organic solvent. Approximately 300 mg of homogenized plant material was extracted with 4 mL of isopropanol with sonication for 20 min. The resulting extract was filtered with a syringe filter, and further diluted with 71% acetonitrile to the appropriate concentration for liquid chromatographic analysis, and transferred to an auto-sampler vial.
Chromatographic Cannabinoid Analysis
The liquid chromatographic analyses were performed using an ultra-high-pressure liquid chromatographic system (Waters UPLC) with Photo Diode Array, UV Detection, with a Cortecs C18 column (2.7 mm, 2.1 × 100 mm) (Waters Corporation, Milford, MA). Mobile phases were water (A) and acetonitrile (B), both acidified with 0.1% formic acid. Separation was achieved under gradient conditions of 59 to 100% mobile phase B over 2.5 min at a flow rate of 0.56 mL min-1 at 40°C. Samples were introduced with a 3.5 mL injection, with
chromatographic data collected at 225 nm.
Cannabinoid certified reference materials (Cerilliant, Sigma-Aldrich and Cayman Chemicals) were used for peak identification and generation of calibration curves used for quantitation, and included: THC, tetrahydrocannabinolic acid (THCA), CBD, cannbidioalic acid (CBDA), cannabigerol (CBG), cannabigerolic acid (CBGA), cannabichromene (CBC), cannabinol (CBN), tetrahydrocannbivarin (THCV), and cannabidivarin (CBDV). Data was recorded and processed using Empower Software (Version 3, Waters Corporation).
Sample Preparation for Terpene Analysis
Analysis of terpene profiles was performed using Full Evaporative Technique GC-FID Chromatography (FET-GC-FID). The Full Evaporative Technique is a form of head-space sampling, for which standards or samples are placed and sealed directly in a head space vial. The sealed vial is equilibrated at elevated temperatures to vaporize volatile compounds for head-space sampling. For these evaluations, samples were homogenized and sealed directly in to the head-space vials, then equilibrated for 30 min at 140°C prior to injection using a Hewlett-Packard head-space autosampler (HP G1290A).
Chromatographic Terpene Analysis
The GC analyses were performed using Shimadzu GC-2014 gas chromatograph with FID, with an Rxi-624Sil MS column (30 m × 0.25 mm × 1.4 mm) (Restek, Bellefonte, PA). Samples were introduced directly from the head-space auto sampler via a transfer line held at 160°C to prevent condensation of sample vapors prior to injection.
Nitrogen was used as the GC carrier gas at a flow rate of ~80 mL min-1. Hydrogen and compressed air were used as the combustion
gases. The following instrument parameters were employed: air, 50 psi; H, 70 psi; N, 60 psi; linear velocity flow control, 33 cm s-1;
split ratio, 20:1; injector temperature, 250°C; detector temperature, 320°C; oven program, 75°C (hold 0.4 min) to 160°C at 8°C min-1;
ramped to 250°C at 20°C min-1; ramped to 300°C at 12.5°C min-1
(hold 3 min); run time, 22.2 min.
Terpene certified reference materials (Restek CRMs no. 34095 and no. 34096) were used for peak identification and generation of calibration curves used for quantitation. Data was recorded and processed using Clarity Software (Version 5.0.4.158).
Statistical Analysis
Analysis of variance (ANOVA) was used to determine effects due to genotype, environment, and GEI by linear regression using the aov function in R (R Core Team, 2013), with genotype and environment treated as fixed effects to determine significance and as random effects to calculate variance explained. Traits in common
were analyzed across all environments and traits only measured at Fort Collins were analyzed across the wet and dry irrigation treatments. Data were organized and visualized using the tidyverse and ggplot2 packages in R (Wickham, 2009, 2017). Before the regression analysis, traits were tested for normality with a Shapiro-Wilk test in R (R Core Team, 2013). Non-normally distributed data were transformed using the bestNormalize package in R (Peterson, 2017) to determine the optimal transformation for each trait. Percent variance explained was calculated as the sum of squares for each variable divided by the total sum of squares. Pearson’s product moment correlation analysis was performed using the corrplot package in R (Wei, 2013). The Additive Main Effect and Multiplicative Interaction (AMMI) biplot was created using the agricolae package in R (de Mendiburu, 2015).
RESULTS Physical Traits
Grain Yield
Mean grain yield for the cultivars tested varied dramatically, from 27 to 2366 kg ha-1. These observed extremes were a nearly
equal contribution of genetics, environment, and GEI (Table 1). Genetic effects explained 28% of trait variance, with 25% of variance attributed to environmental effects and 35% attributed to GEI. As expected, grain yield increased with additional irrigation, with a limited irrigation mean yield of 404 kg ha-1 at Fort Collins and
a fully irrigated mean yield of 782 and 1123 kg ha-1 at the Yellow
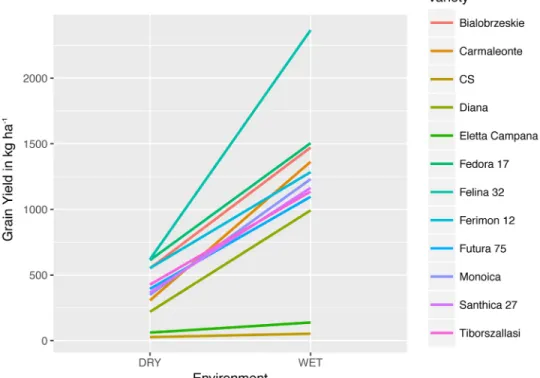
Jacket and Fort Collins sites, respectively. However, not all cultivars were affected equally by increased access to water. Every cultivar produced more grain with increased irrigation, but some exhibited a much more plastic response than others (Fig. 1). The yield reaction norm shows characteristic divergent GEI (Malosetti et al., 2013). The cultivar Félina 32 produced the most grain under both drought and full irrigation at Fort Collins and also showed the largest response to increased irrigation. This cultivar produced an average of 611 kg ha-1 of grain under limited irrigation and 2337 kg ha-1 of grain under
full irrigation. The cultivar Uso 31 was not included in the reaction norm due to grain loss in the limited irrigation treatment plots caused by birds during the harvest process (Fig. 1). Grain yield GEI
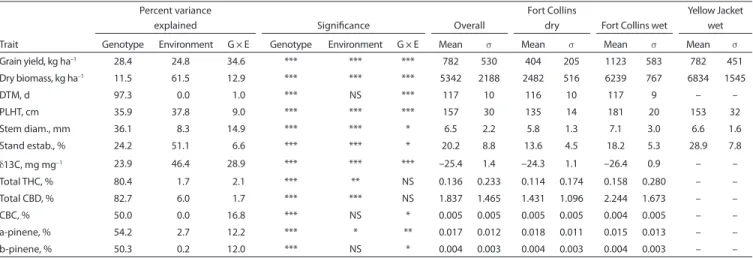
Table 1. ANOVA and summary statistics at Fort Collins, CO, and Yellow Jacket, CO, in 2016.†
Trait
Percent variance
explained Significance Overall
Fort Collins
dry Fort Collins wet
Yellow Jacket wet
Genotype Environment G × E Genotype Environment G × E Mean s Mean s Mean s Mean s
Grain yield, kg ha–1 28.4 24.8 34.6 *** *** *** 782 530 404 205 1123 583 782 451 Dry biomass, kg ha–1 11.5 61.5 12.9 *** *** *** 5342 2188 2482 516 6239 767 6834 1545 DTM, d 97.3 0.0 1.0 *** NS *** 117 10 116 10 117 9 – – PLHT, cm 35.9 37.8 9.0 *** *** *** 157 30 135 14 181 20 153 32 Stem diam., mm 36.1 8.3 14.9 *** *** * 6.5 2.2 5.8 1.3 7.1 3.0 6.6 1.6 Stand estab., % 24.2 51.1 6.6 *** *** * 20.2 8.8 13.6 4.5 18.2 5.3 28.9 7.8 d13C, mg mg–1 23.9 46.4 28.9 *** *** *** –25.4 1.4 –24.3 1.1 –26.4 0.9 – – Total THC, % 80.4 1.7 2.1 *** ** NS 0.136 0.233 0.114 0.174 0.158 0.280 – – Total CBD, % 82.7 6.0 1.7 *** *** NS 1.837 1.465 1.431 1.096 2.244 1.673 – – CBC, % 50.0 0.0 16.8 *** NS * 0.005 0.005 0.005 0.005 0.004 0.005 – – a-pinene, % 54.2 2.7 12.2 *** * ** 0.017 0.012 0.018 0.011 0.015 0.013 – – b-pinene, % 50.3 0.2 12.0 *** NS * 0.004 0.003 0.004 0.003 0.004 0.003 – – * Significant at p ≤ 0.05. ** Significant at p ≤ 0.01. *** Significant at p ≤ 0.001.
† DTM, days to maturity; PLHT, plant height at maturity; estab., establishment; d13C, carbon isotope ratio; THC, total potential D9-tetrahydrocannabinol; CBD, total potential cannabi-diol; CBC, cannabichromene; NS, not significant.
was also visualized using an AMMI biplot (Fig. 2). Cultivars closest to specific environmental vectors exhibited higher yields in those environments, and the direction of the vectors shows whether those environments produced yields that were above or below average. Means and standard deviation for all traits are reported by cultivar in Supplemental Tables S4.1 to S4.12.
Total Plant Biomass
Aboveground total plant biomass showed a more substantial influence of environmental factors than grain yield, with 61% of trait variance due to environmental effects. Genotype and GEI were responsible for a similar amount of variance, at 11 and 13%, respectively. Although the fully irrigated plots at Fort Collins produced more grain than at Yellow Jacket, the opposite was true for biomass. Under limited irrigation at Fort Collins, plants produced an average of 2482 kg ha-1. Under full irrigation at Fort Collins, average
dry biomass was 6239 kg ha-1 and, under full irrigation at Yellow
Jacket, produced an average of 6834 kg ha-1. However, biomass was
more variable at Yellow Jacket than at Fort Collins, with a standard deviation of 1545 kg ha-1. Comparatively, standard deviation at Fort
Collins was 516 kg ha-1 under limited irrigation and 767 kg ha-1
under full irrigation.
Days to Maturity
Due to resource limitation, days to maturity was not measured at Yellow Jacket, so these data represent the differentially irrigated environments at Fort Collins. The number of days from planting to maturation of grain had a very strong genetic component, with 97% of variation observed at Fort Collins attributed to genetic effects. There was not a significant effect of environment (irrigation) for this trait, but GEI accounted for slightly over 1% of trait variation. There was a 40-d spread for maturity at Fort Collins in 2016, from 93 to 133 d. Mean days to maturity were nearly identical in the limited and fully irrigated treatments at 116 and 117 d, respectively. However,
crossover GEI led some cultivars to take longer to mature under full irrigation, whereas others matured more quickly with increased irrigation. In general, this trait was largely determined by genotype with only small differences in maturity due to interactions with the environment.
Plant Height
Plant height was strongly influenced by both genetic and environmental factors. Genotype accounted for 36% of variance in height, and environment and GEI accounted for 38 and 9%, respectively. Plant height followed the expectation that increasing irrigation would result in taller plants. Mean plant height at maturity was 135 cm under limited irrigation at Fort Collins. This increased
Fig. 1. Reaction norm of grain yield from industrial hemp cultivars under limited and full irrigation. All of the cultivars exhibited higher yield with increased irrigation, but with changing ranks, a profile that is characteristic of divergent genotype × environment interactions.
Fig. 2. Additive main effect and multiplicative interation (AMMI) bip-lot, showing genotype × environment interactions for grain yield in three environments. The direction of the environmental vectors shows whether the cultivars performed above or below trial averages in those environments. FC16D, Fort Collins, CO, 2016, limited irrigation (Dry); FC16W, Fort Collins, CO, 2016, full irrigation (Wet); YJ16W, Yellow Jacket, CO, 2016, full irrigation (Wet).
to 153 cm at Yellow Jacket and to 181 cm at Fort Collins when fully irrigated. Values for mean plant height by cultivar ranged from 113 to 210 cm, with later flowering/maturing cultivars exhibiting taller phenotypes.
Stem Diameter
Although stem diameter showed nearly the same degree of genetic effects (36%) as plant height, a much smaller proportion of variance was attributed to environmental effects (8%). There was a statistically significant and slightly higher amount of variance attributed to GEI at 15%. There was a large amount of residual variance for this trait as well (41%). Cultivar means for stem diameter had a minimum of 4.52 mm and a maximum of 11.70 mm. Similar to grain yield and plant height, stem diameter in general increased with more access to water. The limited irrigation treatment at Fort Collins had the smallest mean stem diameter at 5.77 mm. Yellow Jacket produced a mean stem diameter of 6.61 mm, whereas the fully irrigated treatment at Fort Collins had a mean diameter of 7.06 mm.
Stand Establishment
The composite trait of stand establishment showed highly significant effects of genotype, environment, and GEI, with the highest proportion assigned to environment. Genetic effects accounted for 24% of trait variance. Environmental effects were the strongest contributing factor at 51%, whereas GEI accounted for a smaller but significant (p value = 0.02) 7% of trait variance. Stand
establishment was lowest in the limited irrigation treatment at Fort Collins, with a mean of 14%. Establishment was higher under full irrigation at 19%, and the highest stand establishment was observed at Yellow Jacket with a rate of 29%. Genotype × environment interactions for this trait changed rankings dramatically, but some cultivars were relatively consistent across locations and treatments. For instance, the cultivar Diana had the lowest stand establishment rates in all environments. However, other cultivars were highly variable. For example, the cultivar Bialobrzeskie was ranked at 12/13 at Fort Collins Dry (5%), 11/13 at Fort Collins Wet (16%), and 1/13 at Yellow Jacket Wet (38%). Plant density, from which stand establishment was calculated, ranged from 8 to 111 plants m–2, with
a mean of 48 plants m–2.
Biochemical Traits
Cannabinoids
To account for the loss of the carboxylic acid group during decarboxylation, total THC levels were calculated as the sum percentage by dry weight of THCA × 0.877 plus delta-9-tetrahydrocannabinol (D9-THC). The THC content was primarily an effect of genotype, with a small but significant effect of environment. Over 80% of trait variance was attributed to the effect of genotype, whereas 1.7% of variance was explained by environment. The mean across treatments at Fort Collins in 2016 for total THC was 0.14%. The mean THC content by cultivar ranged from 0.002 to 0.63%, with a median value of 0.09%. A single cultivar, Tiborszállási, tested over the 0.3% threshold in 2016.
The total CBD content was also calculated as the sum of the acid form and decarboxylated form of the compound, CBDA multiplied by 0.877 and CBD, respectively. Similar to THC, the regression model detected significant effects of genotype and environment. The magnitude of effects was also very similar. Genotype explained 83% of variation in CBD content, with 6% of variation attributed to
environmental effects. The overall mean content of total CBD varied by treatment, with a fully irrigated mean value of 2.24% and a limited irrigation mean of 1.43% of dry flower weight. The highest mean CBD content was found in the Italian fiber cultivar Carmagnola Selezione at 5.95% in the fully irrigated treatment; the lowest mean CBD content was found in the French cultivar Santhica 27, at 0.003% in the limited irrigation treatment.
Although THC and CBD exhibited similar patterns of genetic control, CBC showed a different pattern. Genotype explained 50% of trait variance and GEI explained 17%. This cannabinoid did not have a detectable influence of environment. However, there was also a much larger error variance for this trait of 33%, indicating that other factors contributed to variance in this trait that were not included in our model. The levels of this compound were lower than the other cannabinoids, but showed a clear quantitative range. On average, cultivars in the limited irrigation treatment had slightly higher levels at 0.0052% of dry flower weight. The fully irrigated samples had mean CBC content of 0.0045% by weight. However, the range of CBC content was quite similar between the two treatments, from 0.0003 to 0.0133% under drought stress and from 0.0001 to 0.0112% under full irrigation. Despite the very similar ranges, rankings of the individual cultivars changed considerably, which contributed to the significant GEI that were observed.
Terpenes
Of the 23 terpenes found in measurable amounts in the samples, only two showed evidence of significant GEI, a-pinene (p value =
0.007) and b-pinene (p value = 0.049). Although a-pinene and
b-pinene levels were largely influenced by genetic effects (54 and 50% variance explained), there was still a significant effect of GEI (12% of trait variance for both terpenes). The genetic control of these traits was quite similar overall, but there was a small and significant (p value = 0.011) effect of environment for a-pinene (3%) that
was not detected for b-pinene. The observed GEI in a-pinene and b-pinene were particularly dramatic, as can be seen in a reaction norm of a-pinene content (Fig. 3). Levels of these compounds did not show any clear trend, increasing or decreasing to varying degrees based on a particular genotype’s response to each environment (Table 1). Although the levels appear to be quite low when described as percentage mass, there was measurable quantitative variation, particularly when viewed on a ppm scale. We chose to report these values as percentage mass for uniformity and ease of comparison with cannabinoid measurements.
Carbon Isotope Ratio
Although cannabinoid and terpene production appeared to be largely products of genetic effects, carbon isotope ratio (d13C) exhibited a different pattern. The variance in this trait showed significant effects of genotype, environment, and GEI, with the largest proportion attributed to environmental effects at 46%. A substantial 29% of variance is attributed to GEI effects, whereas 24% is due to genotype. Mean d13C was -24.23 mg mg-1 under limited
irrigation and -26.44 mg mg-1 under full irrigation, with a higher
degree of isotope discrimination under full irrigation.
Correlations
To reduce estimates of correlation due to plasticity, Pearson’s product moment correlations were calculated using cultivar means from each environment. For physical traits, this included data from all
Table 2. Trait correlations (r values) at Fort Collins, CO, and Yellow Jacket, CO, in 2016.† Trait Grain yield Biomass DTM PLHT Stem diam. Stand establishment d13C THC CBD CBC a-pinene Grain yield – Biomass 0.62 – *** DTM -0.53 -0.15 – ** NS PLHT 0.33 0.58 0.42 – * *** * Stem diam. 0.05 0.29 0.46 0.68 – NS NS * *** Stand est. 0.29 0.63 -0.20 -0.07 -0.17 – NS *** NS NS NS d13C 0.35 0.68 0.19 0.74 0.46 0.28 – NS *** NS *** * NS THC -0.20 -0.13 0.38 0.05 -0.11 0.12 0.04 – NS NS NS NS NS NS NS CBD -0.51 -0.28 0.68 0.01 0.02 -0.02 0.00 0.55 – ** NS *** NS NS NS NS ** CBC 0.26 0.35 -0.32 -0.05 -0.25 0.18 0.11 -0.22 -0.15 – NS NS NS NS NS NS NS NS NS a-pinene -0.01 0.16 0.45 0.26 0.00 0.33 0.30 0.66 0.61 -0.04 – NS NS * NS NS NS NS *** *** NS b-pinene -0.25 -0.02 0.58 0.24 0.09 0.15 0.24 0.69 0.82 -0.12 0.91 NS NS ** NS NS NS NS *** *** NS *** * Significant at p ≤ 0.05. ** Significant at p ≤ 0.01. *** Significant at p ≤ 0.001.
† Abbreviations: DTM = days to maturity; PLHT = plant height; Stand est. = stand establishment; d13C, carbon isotope ratio; THC, total tetrahydrocannabinol; CBD, total cannabidiol; CBC, cannabichromene; NS, not significant.
Fig. 3. Reaction norm of a-pinene content in industrial hemp cultivars under limited and full irrigation. The extreme rank changes are characteristic of crossover genotype × environment interactions.
three of the environments measured in 2016. Since the biochemical traits were only assessed in the differential irrigation experiment at Fort Collins in 2016, those correlations reflect data from two environments rather than three. Correlation coefficients and significance levels for each trait are reported (Table 2) and significant relationships are represented as a heat map to visualize strength and directionality (Fig. 4).
Grain yield was statistically significantly correlated with four of the traits analyzed: total plant biomass, plant height, days to maturity, and CBD. Yield was strongly and positively correlated with biomass (r =
0.62, p value = 6.18 × 10⁻⁵). Plant height was also positively correlated
with grain yield, but to a lesser extent than biomass. The r value for this
relationship was 0.33, with a narrowly significant p value of 0.046. These
results support that larger plants yielded more grain, with biomass being a stronger indicator of grain yield than height.
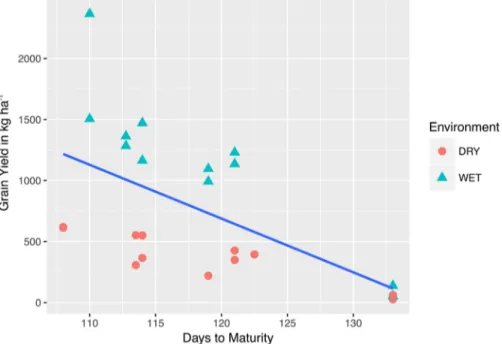
Days to maturity was also correlated to grain yield, with a negative
r value of -0.53 (p value = 0.007). This indicates that, in general, grain
yield was reduced in cultivars that took longer to mature. However, this was not an entirely linear relationship. A bivariate scatterplot of grain yield vs. days to maturity (Fig. 5) shows that late maturing phenotypes led to decreased yield, whereas the highest yields were obtained from moderately early flowering cultivars.
The only biochemical trait that shared a genetic correlation with grain yield exhibited a negative relationship. The correlation between grain yield and CBD, with r = -0.51and p value = 0.009, showed
that levels of this cannabinoid tended to decrease when grain yield increased.
Total plant biomass was correlated with three other traits, in addition to grain yield. It was expected that taller plants would accumulate more biomass, and the data supported that expectation. The correlation between biomass and plant height had an r value
of 0.58 and a p value of 2.48 × 10⁻⁴. Stand establishment was also
positively correlated with biomass (r = 0.63, p value = 5.29 × 10⁻⁵).
Plots that had more plants emerge and survive produced more biomass.
Another correlation that confirmed an expected relationship was between biomass and d13C. A correlation of r = 0.63 and p value = 4.66 × 10⁻⁴ shows that as the d13C grows, more biomass is
produced. This was also reflected in the correlations between d13C and the other indicators of plant growth, plant height, and stem diameter. Positive correlations between d13C with plant height and stem diameter (r = 0.74, p value = 1.71 × 10⁻⁵ and r = 0.46, p value = 0.02, respectively) show that a less conservative pattern
of water use (higher d13C) is associated with more vigorous plant growth and mass.
Phenology, in particular, affected an entire suite of traits. Days to maturity was significantly correlated with grain yield, plant height, stem diameter, CBD, a-pinene, and b-pinene. With the exception of grain yield, which was previously reported, all of these traits were significantly positively correlated with days to maturity (Table 2).
Fig. 4. Trait correlation heat map. Only statistically significant correla-tions are shown, with the size and color of the circles representing the strength and direction of the correlations. Trait abbreviations: DTM, days to maturity; PLHT, plant height; Stand Est, stand establishment; d13C, carbon isotope ratio; THC, total tetrahydrocannabinol; CBD, total cannabidiol; CBC, cannabichromene.
Fig. 5. A best fit line is drawn on a scatterplot comparing maturity dates with grain yield data. The color-coded data points demonstrate that the relation-ship between phenology and yield is consistent due to maturity being relatively unaffected by environmental factors. DRY, Fort Collins, 2016, under limited irrigation; WET, Fort Collins, 2016, under full irrigation.
All cannabinoid and terpene traits were positively correlated with one another, with the exception of CBC, which appeared to be independent from relationships with any trait. Overall, increasing cannabinoid levels corresponded to increasing terpene levels and vice versa. The strongest of these observed relationships was between a-pinene and b-pinene with r = 0.91 and p value = 1.53 × 10⁻¹⁰.
DISCUSSION
Grain yield and biomass rankings were much more similar between the two treatments at Fort Collins than they were at Yellow Jacket, indicating that soil moisture alone does not account for the GEI that was observed with these cultivars. In general, increased precipitation led to higher yields, but genotypes did not respond in a uniform manner. A wider range of test locations and years of testing these same cultivars would help to elucidate the factors responsible for affecting grain yield and other important traits. These could include a number of direct environmental factors, such as latitude, temperature, elevation, humidity, and soil type, or management practices like fertilizer rates, planting dates, planting density, and so forth. Hemp cropping is amenable to a wide range of target environments, but each environment will have different management needs and will maximize productivity using locally adapted germplasm.
An optimal phenology was apparent, with moderately early cultivars maturing around 110 d after sowing yielding the most grain. This agrees with a recent study by Long et al. (2017), which determined that corn cultivars that mature between 107 and 118 d will yield the highest amount of grain at latitudes between 35 and 40°N. Developing cultivars with adapted phenology should be relatively straightforward, because this trait shows a strong genetic component and little discernable environmental effects. However, the environmental effect on phenology may become more pronounced with larger differences in latitude due to variable photoperiod sensitivity among genotypes (Amaducci et al., 2008). Grain yield was also positively correlated with biomass and, to a lesser extent, plant height. This implies that higher biomass is a stronger indicator of grain yield than height alone. In fact, the tall, late-flowering fiber cultivars fared the worst by far for grain yield and did not produce more biomass than earlier maturing cultivars. This may, at least partially, be driven by the fact that the fiber cultivars in these trials were all dioecious and only half of the plants produced grain. However, there is a distinction to be drawn between total plant biomass and stem biomass. For fiber applications, it may make sense to select a cultivar that produces less grain, flower, and leaf biomass, and select cultivars based on stem biomass. It should be noted that, for a complex trait like yield, a single season of data is not sufficient to draw generalized conclusions. More research should be performed to fully understand the relationships between grain yield, yield components, and other traits.
Stand establishment was strongly and positively correlated with biomass, which is in line with expectations and indicates that we did not surpass ideal planting density in this experiment. The lack of a direct, significant correlation with grain yield is consistent with recent results by Tang et al. (2017) that plant density, between 30 and 240 plants m-2, did not significantly affect grain yield. It is
possible that yield may have been more negatively impacted by low plant density in the absence of aggressive weed control. Keeping weed pressure artificially low allowed plots with lower emergence to fill in gaps and form consistent canopies. In an agricultural setting where mechanical control of weeds is not feasible, interspecies competition
may hinder the crop’s ability to form complete canopies. Although the composite trait of stand establishment does reflect seeds that were planted that made it to maturity and has some basis in germination rates, it does not fully explain the roles of seedling mortality or self-thinning. Despite these values all being under our target of 50%, it was noted during the season that some plots appeared to be overly dense, exhibiting interplant competition and self-thinning. Distribution of plants throughout the plots, which was not measured, may play as strong a role as stand establishment in determining yield potential. Previous studies have shown that planting density and self-thinning can significantly affect yields and that different optima may be chosen based on maximizing stem yields vs. flower or grain yields (van der Werf et al., 1995; Amaducci et al., 2002; Campiglia et al., 2017). These studies were also consistent with our results that cultivar choice interacts with these factors substantially and does not lead to a uniform seeding rate.
Water use efficiency (WUE) is another important aspect of crop performance and management. Carbon isotope ratio has shown to be a reliable proxy for WUE, where d13C and WUE are inversely correlated (Donovan and Ehleringer, 1994). The d13C measurements showed that, although a large proportion of trait variance was a product of environmental effects, there are substantial effects of genotype and GEI that show certain cultivars have a more efficient pattern of water use than others. Twenty-nine percent of trait variation for d13C was due to GEI, which shows substantially different responses to increased irrigation/precipitation. Differential access to water led to crossover GEI, with some cultivars showing a more conservative pattern of water use under full irrigation compared with drought conditions and other cultivars showing less conservative water use in the same conditions. Although our data showed that less conservative water use was correlated with increased plant height, d13C was not significantly correlated with grain yield. It is not possible to draw generalizations about d13C/WUE of hemp in general with the small data set used for this particular analysis; however, our results support the idea that yield per se is a better measurement of drought tolerance than d13C alone. Full characterization of this trait and its implications should be explored more extensively in the future to assist in the development of drought-tolerant cultivars, with an emphasis on genotype-specific responses to water limitation.
The data on THC content supported that the trait is largely controlled by genetic factors, but there was a significant effect of environment and levels were slightly higher under full irrigation on average. Due to the legal threshold of 0.3% THC content in hemp, this single trait can make or break a farmer’s season, so it is very important to understand its interaction with environmental factors. Although the small sample size does not allow for a highly precise estimation of variance components, these data support that cultivar selection is an important factor in mitigating risk for farmers. Despite the fact that many of these cultivars were grown in environments drastically different from where they were developed, the vast majority tested below the legal threshold for THC. This is a testament to the breeders who developed the seed, as well as some assurance that this trait can be relatively stable. However, environmental factors outside of soil moisture may influence the expression of this trait, which could be problematic and certainly warrants further investigation.
Interest in farming hemp for CBD is growing and there is a positive outlook for that as well. Thew CBD content showed a positive correlation with later flowering, but 83% of variance in CBD content was a result of genetic effects. Again, this makes cultivar
selection by far the most important decision when seeking a specific CBD content. Increasing irrigation did slightly increase CBD content, which seems in agreement with the positive correlation between CBD content and rainfall recently found by Calzolari et al. (2017), but it was a small enough change that flower biomass yield is likely far more important to overall yield than a slight change in CBD percentage. One caveat about CBD cropping is that none of the cultivars tested in these trials were considered “high CBD” cultivars. Much of the germplasm in Colorado that is being marketed as such has been developed by crossing drug-type cannabis with industrial hemp and is anecdotally known to be less stable for THC content. It was observed in this study that THC content was positively correlated with CBD content. This could be problematic when breeding to increase CBD content. Although the genetics of THCA vs. CBDA production have begun to be elucidated, cannabinoid content is thought to be a complex, quantitative trait (Weiblen et al., 2015). Until the genetic mechanisms controlling cannabinoid content are better characterized, it remains a risk to utilize seed developed for high cannabinoid production unless rigorous testing has proven stability of THC levels for a particular cultivar in its target environment(s).
In addition to non-psychoactive cannabinoids, terpenes are also receiving new attention as a value-added by-product of industrial hemp. These scent and flavor compounds have a wide range of uses, including natural pesticides, aromatherapy, brewing, and as therapeutic agents in medicine (Russo, 2011). An interesting result is that the strongest correlation observed among the biochemical traits was between a-pinene and b-pinene. These compounds are enzymatically converted from the same biochemical precursor, geranyl pyrophosphate (Croteau et al., 1989), but do not appear to be competitively exclusive. Despite increasing interest in hemp terpenes, breeding for specific terpene profiles will add in a distinct element of complexity with its polygenic nature and high degree of GEI (Booth et al., 2017). But breeding for certain terpenes may dovetail nicely with other goals like breeding for pest resistance. With an emerging awareness of these compounds and a financial incentive for their production, it is very likely that customizing terpene profiles will become a more common goal in hemp breeding programs.
The current study represents a first attempt at characterizing genetic, environmental, and GEI effects caused by water limitation in hemp, as well as the first GEI study to be performed on hemp in the United States. Previous hemp studies of GEI have focused largely on fiber characteristics, agronomic management, and phenology (Struik et al., 2000; Tang et al., 2016). Although we recognize that logistical restraints surrounding acquisition of germplasm and running multiple testing sites hindered our ability fully characterize GEI in complex traits, this experiment contributes information to an under-studied area to encourage academic discussion of an important topic. The potential of hemp to move beyond its historic role as a fiber crop is beginning to be realized, and information about environmental impacts on traits with legal or medical implications is essential for consistent field production of this unique crop. These data offer some insight into which types of cultivars will perform well locally and, more importantly, contribute to a broader understanding of the plasticity and stability of both physical and biochemical traits in hemp. The substantial level and different types of GEI observed in this population tells a complicated story in which certain cultivars are more plastic than others, but, also, traits themselves exhibit a wide range of plasticity. As legalization of hemp continues to expand
cultivation into new areas, more information about the impact of environmental factors on end-use traits will become available. These types of data will be germane to breeding programs and will help in developing a host of highly adapted cultivars with improved stability and uniformity.
ACKNOWLEDGMENTS
We thank the Colorado State University Agricultural Experiment Station for funding and the breeding organizations whom provided seed.
CONFLICT OF INTEREST DISCLOSURE
The authors declare that there is no conflict of interest.
SUPPLEMENTAL MATERIAL
Supplementary information contains tables including information on what cultivars were assessed, where they were developed, the breeders who developed the cultivars, methods on how flowering was scored, growing season precipitation compared with long-term averages, and trait means and standard deviations by individual cultivar and environment. A .csv file contains raw, plot-level data collected on the reported traits.
REFERENCES
Amaducci, S., M. Colauzzi, G. Bellocchi, and G. Venturi. 2008. Modelling post-emergent hemp phenology (Cannabis sativa L.): Theory and evaluation. Eur. J. Agron. 28:90–102. doi:10.1016/j.eja.2007.05.006
Amaducci, S., M. Errani, and G. Venturi. 2002. Plant population effects on fibre hemp morphology and production. J. Ind. Hemp 7:33–60. doi:10.1300/ J237v07n02_04
Amaducci, S., and H.J. Gusovious. 2010. Hemp: Cultivation, extraction and processing. In: J. Müssig, editor, Industrial applications of natural fibres: Structure, properties and technical applications. John Wiley & Sons, Chichester, UK. doi:10.1002/9780470660324.ch5
Amaducci, S., D. Scordia, F.H. Liu, Q. Zhang, H. Guo, G. Testa, and S.L. Cosentino. 2015. Key cultivation techniques for hemp in Europe and China. Ind. Crops Prod. 68:2–16. doi:10.1016/j.indcrop.2014.06.041
Booth, J.K., J.E. Page, and J. Bohlmann. 2017. Terpene synthases from Cannabis sativa. PloS ONE 12:e0173911 doi:10.1371/journal.pone.0173911 Calzolari, D., G. Magagnini, L. Lucini, G. Grassi, G. Appendino, and S. Amaducci.
2017. High added-value compounds from cannabis threshing residues. Ind. Crops Prod. 108:558–563. doi:10.1016/j.indcrop.2017.06.063
Campiglia, E., E. Radicetti, and R. Mancinelli. 2017. Plant density and nitrogen fertilization affect agronomic performance of industrial hemp (Cannabis sativa L.) in Mediterranean environment. Ind. Crops Prod. 100:246–254. doi:10.1016/j.indcrop.2017.02.022
Croteau, R., D.M. Satterwhite, C.J. Wheeler, and N.M. Felton. 1989. Biosynthesis of monoterpenes. Stereochemistry of the enzymatic cyclizations of geranyl pyrophosphate to (+)-alpha-pinene and (-)-beta-pinene. J. Biol. Chem. 264:2075–2080.
de Mendiburu, F. 2015. agricolae: Statistical procedures for agricultural research. R package version 1.2-3. R Foundation for Statistical Computing, Vienna, Austria. http://CRAN.R-project.org/package=agricolae (accessed 10 May 2018).
Donovan, L.A., and J.R. Ehleringer. 1994. Carbon isotope discrimination, water-use efficiency, growth, and mortality in a natural shrub population. Oecologia 100:347–354. doi:10.1007/BF00316964
Ehleringer, J.R., and C. Osmond. 1989. Stable isotopes. In: R.W. Pearcy, J.R. Ehleringer, H.A. Mooney, and P.W. Rundel, editors, Plant physiological ecology: Field methods and instrumentation. Kluwer Academic Publishers, Boston, MA. p. 281–300. doi:10.1007/978-94-009-2221-1_13
Gallily, R., Z. Yekhtin, and L.O. Hanuš. 2015. Overcoming the bell-shaped dose– response of cannabidiol by using cannabis extract enriched in cannabidiol. Pharmacol. Pharm. 6:75–85. doi:10.4236/pp.2015.62010
Long, N.V., Y. Assefa, R. Schwalbert, and I. Ciampitti. 2017. Maize yield and planting date relationship: A synthesis-analysis for US high-yielding contest-winner and field research data. Front. Plant Sci. 8:2106. doi:10.3389/ fpls.2017.02106
Makahiya, H.A.F., K.N.C. Perdiguerra, I.R.M. Marajas, M.L.S. Edaño, J. E. Hernandez, and P.C. Sta Cruz. 2017. Analysis of genotype by environment interaction in irrigated lowland rice (Oryza sativa L.) varieties under diverse agroclimatic environments. Philippine J. Crop Sci. 42:28–36.
Malosetti, M., J.-M. Ribaut, and F.A. van Eeuwijk. 2013. The statistical analysis of multi-environment data: Modeling genotype-by-environment interaction and its genetic basis. Front. Physiol. 4:44. doi:10.3389/fphys.2013.00044 Peterson, R.A. 2017. bestNormalize: A suite of normalizing transformations. R
package version 3.4.1. R Foundation for Statistical Computing, Vienna, Austria. https://github.com/petersonR/bestNormalize (accessed 10 May 2018).
R Core Team. 2013. R: A language and environment for statistical computing. R Foundation for Statistical Computing, Vienna, Austria. http://www.R-project.org/ (accessed 10 May 2018).
Russo, E.B. 2011. Taming THC: Potential cannabis synergy and phytocannabinoid‐ terpenoid entourage effects. Br. J. Pharmacol. 163:1344–1364. doi:10.1111/ j.1476-5381.2011.01238.x
Salentijn, E.M.J., Q. Zhang, S. Amaducci, M. Yang, and L.M. Trindade. 2015. New developments in fiber hemp (Cannabis sativa L.) breeding. Ind. Crops Prod. 68:32–41. doi:10.1016/j.indcrop.2014.08.011
Schluttenhofer, C., and L. Yuan. 2017. Challenges towards revitalizing hemp: A multifaceted crop. Trends Plant Sci. 22:917–929. doi:10.1016/j. tplants.2017.08.004
Small, E., and D. Marcus. 2003. Tetrahydrocannabinol levels in hemp (Cannabis sativa) germplasm resources. Econ. Bot. 57:545–558. doi:10.1663/0013-0001(2003)057[0545:TLIHCS]2.0.CO;2
Struik, P.C., S. Amaducci, M.J. Bullard, N.C. Stutterheim, G. Venturi, and H.T.H. Cromack. 2000. Agronomy of fibre hemp (Cannabis sativa L.) in Europe. Ind. Crops Prod. 11:107–118. doi:10.1016/S0926-6690(99)00048-5
Tang, K., P.C. Struik, X. Yin, D. Calzolari, S. Musio, C. Thouminot, M. Bjelková, V. Stramkale, and S. Amaducci. 2017. A comprehensive study of planting density and nitrogen fertilization effect on dual-purpose hemp (Cannabis sativa L.) cultivation. Ind. Crops Prod. 107:427–438. doi:10.1016/j. indcrop.2017.06.033
Tang, K., P.C. Struik, X. Yin, C. Thouminot, M. Bjelková, V. Stramkale, and S. Amaducci. 2016. Comparing hemp (Cannabis sativa L.) cultivars for dual-purpose production under contrasting environments. Ind. Crops Prod. 87:33–44. doi:10.1016/j.indcrop.2016.04.026
US Government Printing Office. 2014. Farm Bill. Legitimacy of Industrial Hemp Research. Public Law 113-79, Title VII, §7606, 7 Feb. 2014. US Gov. Printing Office, Washington, DC.
van der Werf, M.G. Hayo, M. Wijlhuizen, and J.A.A. De Schutter. 1995. Plant density and self-thinning affect yield and quality of fibre hemp (Cannabis sativa L.). Field Crops Res. 40:153–164. doi:10.1016/0378-4290(94)00103-J Wei, T. 2013. corrplot: Visualization of a correlation matrix. R package version
0.73. R Foundation for Statistical Computing, Vienna, Austria. http:// CRAN.R-project.org/package=corrplot (10 May 2018).
Weiblen, G.D., J.P. Wenger, K.J. Craft, M.A. ElSohly, Z. Mehmedic, E.L. Treiber, and M.D. Marks. 2015. Gene duplication and divergence affecting drug content in Cannabis sativa. New Phytol. 208:1241–1250. doi:10.1111/ nph.13562
Wickham, H. 2009. ggplot2: Elegant graphics for data analysis. Springer-Verlag. New York.
Wickham, H. 2017. tidyverse: Easily install and load the ‘Tidyverse’. R package version 1.2.1. R Foundation for Statistical Computing, Vienna, Austria. http://CRAN.R-project.org/package=tidyverse (10 May 2018).