Table of Contents
1. Introduction ... 3
2. PCA-Replica Benchmark ... 4
3. Geometry of the System ... 6
4. Composition of Materials... 8
5. Neutron Source ... 9
6. Experimental Results... 10
7. Calculational Methodology ... 13
8. Nuclear Data Sets ... 13
9. Comparison between Calculation and Measurement ... 14
10. Discussion ... 42
11. Conclusions ... 42
12. Acknowledgments ... 43
1. Introduction
Within the framework of nuclear engineering design and safety evaluations, an important role is performed by shielding calculations. These analyses are utilized to support both the exploitation of existing plants (in particular their lifetime extension as well as decommissioning strategies) and the design of innovative nuclear systems.
Thermal and mechanical properties of relevant structural materials are modified by irradiation conditions and fluence, mainly degrading component performances and endurance. In fact, structural materials inside a nuclear power reactor experience both radiation hardening and shift of ductile-brittle transition temperature (DBTT) which tends to increase as we move towards operating conditions. Designers consider that potential damage depends mainly on the magnitude of the neutron fluence (and especially on the portion above 100 keV) received by an exposed component.
In particular, the pressure vessel is a crucial component which must not fail. It therefore determines the nuclear plant lifespan. Moreover, internals are subjected to high irradiation doses as well, and if they are not replaceable, deserve particular analysis and controls during the operating life of the plant [1].
For these reasons, radiation-resistant materials are selected for key components. Numerical analysis is normally carried out right from the early design phase to evaluate radiation damage, from microscopic phenomena up to macroscopic analysis at the component scale [2]. Results are then compared with data from irradiation experiments and material tests.
The main input for numerical damage estimation to mechanical components is dose evaluation and the determination of the neutron and gamma irradiation field is the key part of the analysis. The preferred approach relies on transport codes and in particular Monte Carlo methods, that can treat nuclear data in a continuous fashion and accept three-dimensional complex geometries.
In order for the numerical tools to provide neutron flux and dose evaluations with a properly estimated uncertainty - mainly related to input data - benchmark calculations are usually prepared and updated for each issued nuclear data set [3]. Experiments are designed to reproduce simple and representative geometry and materials so as to be able to extrapolate the results to full-size components of the nuclear facility: nuclear power plants, research reactors, radioactive sources, waste storage repositories.
In addition to vessel degradation issues, nuclear reactors require evaluations of the radiation penetration outside the pressure vessel, to provide designers with specific information concerning doses to personnel during operation but also to electronic equipment and diagnostic and control devices. Therefore, both in-core and ex-core responses require validation benchmarks to support the calculations.
Experimental shielding mock-ups for benchmark purposes involve materials of interest (structural, coolant, moderator…) based on the technology of interest [4,5]. Thus, measurements in benchmarks have to be carried out with a high degree of accuracy in order to provide sufficiently accurate results to highlight numerical performances, through comparison between calculation and measurement [6].
The present work concerns an analysis of iron and water as structural and moderator materials in GenII and GenIII LWR’s. This shielding experimental benchmark is provided by the Nuclear Energy Agency (NEA) and assembled in the Shielding Integral Benchmark Archive and Database (SINBAD) [7]. In particular, the present study deals with the PCA-Replica experimental benchmark [8] and the simulations were carried out with the MCNP6.1 Monte Carlo transport code [9]. Variance reduction techniques were employed and variance reduction coefficients in the form of weight window parameters [10] were produced by means of the DSA method [11].
Simulation responses to be compared with experimental results are: dosimeter readings (10 positions) and neutron spectra (2 positions).
The nuclear data utilized in this calculation are subdivided into the two categories: nuclear data sets for neutron transport and dosimetry data for neutron response functions. The results presented compare the following nuclear transport libraries: ENDF/B-VI.6 [12], ENDF/B-VII.1 [13], 3.1 [14], JEFF-3.1.2 [15], JEFF-3.2 [16] and JENDL-4.0 [17]. For each of these transport libraries, dosimetry data tables for dosimeter readings – namely reaction rates – have been generated with the following files: 531DOS, 532DOS, LLLDOS [18], IRDF2002 [19] and IRDFFv1.05 [20].
2. PCA-Replica Benchmark
The PCA-Replica shielding benchmark is part of the Shielding Integral Benchmark Archive and Database (SINBAD) at the Nuclear Energy Agency (NEA-1517/93) [7]. The PCA-Replica experimental campaign has been carried out at the NESTOR research reactor at UKAEA Winfrith in the early 1980’s [8]. The experiment was prepared in the ASPIS irradiation facility – inside NESTOR – in which a movable trolley carried the experimental device (fission plate and shielding mock-up) (Fig. 1).
Figure 1. NESTOR reactor and the ASPIS shield trolley [8]
PCA-Replica is an iron/water shielding benchmark since the objective is to evaluate the uncertainty in numerical simulations of the neutron flux inside the thermal shield and pressure vessel – which are mainly composed of iron - in light water reactors. Through evaluation of the neutron flux it is possible
to determine dose, nuclear heating and atomic displacement in materials. In addition, the characterization of the neutron irradiation field in the ex-core region – namely in the void zone between pressure vessel and biological shield – is an objective of the evaluation.
The experimental geometry consists of a simple multilayer domain composed of the materials of interest: mild steel, stainless steel, light water and a void region. Materials are listed according to neutron penetration away from the source as follows:
- planar neutron source (fission plate) - water gap (12 cm)
- thermal shield sample (6 cm) - water gap (13 cm)
- pressure vessel sample (22 cm) - void box
- water pool
The experimental mock-up is immersed in water and placed on the ASPIS movable trolley (Fig. 2) [8].
Figure 2. PCA-Replica mock-up installed inside the ASPIS facility [8]
The fission plate was designed in order to employ a precise source characterization through a fission spectrum. In fact, PCA-Replica was intended to provide support and verification to the previously performed PCA experiment carried out at ORNL in 1978 [21]. This was sponsored by the US NRC within the framework of the Surveillance Dosimetry Improvement Program (SDIP). An experimental campaign was carried out to validate nuclear data and methodology for dose estimation to the reactor pressure vessel (RPV), thermal shield (TS) and ex-core neutron leakage for ex-core irradiation issues. Despite a simple experimental mock-up, a more precise source specification was preferred for benchmark requirements.
Therefore, the Winfrith research group decided to prepare a new experimental configuration, in which a fission plate situated outside the NESTOR core could be irradiated by the thermal neutron leakage flux. This provided a well-defined source with a fission spectrum.
3. Geometry of the System
The PCA-Replica geometry is basically a multi-layer installation of steel specimens representing a thermal shield and pressure vessel immersed in light water. The problem consists of a series of slabs made of steel placed parallel to the x-y plane (where y is the vertical direction), while the main direction of the problem is along the z axis (the horizontal cross section is shown in Fig. 3).
The NESTOR core is not represented but is situated above the upper part of Fig. 3. The neutron flux diffuses from the core through the shutter made of graphite (zone 1) and the aluminum window (zone 2). Zone 19, concrete, represents part of the NESTOR shield. The void region – zone 3 – indicates the space between the fixed portion (at the top of the picture) and the movable trolley (all parts below zone 20).
Figure 3. PCA-Replica geometry cross-section (horizontal cross section x-z) [22]
The x-y dimensions of the zones shown in Fig. 3 are provided in Table 1. All zones are parallelepipeds apart from zone 4 which is circular.
Zone 20 represents the trolley sides; they are made of mild steel and contain all the test facility. Neutrons from NESTOR core pass through the circular window made of aluminum, zone 4. Then, a graphite layer, zone 5, provides further moderation [23].
Zone 10 is an aluminum barrier, beyond which the water volume is contained. Zone 11 indicates the water layer, 12 cm thick, inside the structure, zone 21 (mild steel). Zone 13, 13 cm thick, is water. (The water layer thickness is a key parameter in a shielding benchmark for water reactor technology. For this reason, the PCA-Replica is referred to as a 12/13 iron/water benchmark.) The metallurgical specimen (zone 12) is made of stainless steel and represents the thermal shield. By contrast, a mild steel sample (zone 14) simulates the reactor pressure vessel [24].
Beyond the pressure vessel sample, zone 16 is void. The thin slabs (zones 15 and 17) are water-tight aluminum layers. Water is in zone 18 and surrounds the specimens. In the real experimental facility, concrete structure is present outside zone 20. Instead in this model, zero albedo is assumed outside zone 20.
Zone Material Section Dimensions [cm]
1 Carbon Square 119.0 - Side
2 Aluminum Square 119.0 – Side
3 Void Square 185.0 – Side
4 Aluminum Circular 56.06 – Radius
5 Carbon Square 180.0 – Side
6 Void Square 180.0 – Side
7 Aluminum Rectangular 68.5 x 47.5
8 Fuel Rectangular 63.5 x 40.2
9 Aluminum Rectangular 68.5 x 47.5
10 Aluminum Square 180.0 – Side
11 Water Square 180.0 – Side
12 Stainless Steel Square 68.5 – Side
13 Water Square 180.0 – Side
14 Mild Steel Square 68.5 – Side
15 Aluminum Square 60.0 – Side
16 Void Square 59.4 – Side
17 Aluminum Square 60.0 – Side
18 Water Square 180.0 – Side
Table 1. Materials and dimensions in x-y plane [8]
In order to better describe the fissile region, zone 8 is further subdivided. The fission plate is actually composed of 52 fuel strips, each 1.016 mm thick and 30.48 mm wide and with a height of 635 mm. They are grouped in clusters of 4 strips each, as shown in the sketch in Fig. 4. The clusters of strips are positioned with a pitch of 30.92 mm. The total thickness of the fission plate in zone 8, including metallic uranium strips and voids, is 6 mm. A cross-section of zones 7, 8 and 9 with a detailed view of fission plates is reproduced at the bottom of Fig. 4.
Figure 4. Fission plate geometry: detailed description [8]
4. Composition of Materials
The materials utilized in the present benchmark are mainly water and steel. Structural materials, neutron windows (i.e. aluminum) and moderator are then necessary to completely define the calculational mock-up. They are all at room temperature, thus 300 K cross-section nuclear data tables are used. The fission plate is made of 93% enriched uranium in 235U. The isotopic composition of all other elements is natural [25]. The material compositions are shown in Table 2.
Material Material Density
[g/cm3] Element Weight [%]
Atomic Density [atoms/cm3]
Graphite 1.65 C 100.0 8.276E+22
Aluminum Cladding 2.70 Al 100.0 6.029E+22
Alloy Fuel* 3.257 Al 80.0 5.818E+22
U-235 18.6 1.552E+21
U-238 1.4 1.154E+20
Water 1.0 H 11.19 6.688E+22
O 88.81 3.344E+22
Stainless Steel 7.88 C 0.017 6.721E+19
Si 0.44 7.438E+20 Mn 1.57 1.356E+21 P 0.025 3.832E+19 S 0.006 8.884E+18 Cr 18.4 1.688E+22 Ni 9.4 7.601E+21 Mo 0.37 1.831E+20 Ti 0.009 8.920E+18 Nb 0.014 7.154E+18 Cu 0.24 1.793E+20 Fe 69.509 5.909E+22
Mild Steel 7.835 C 0.22 8.646E+20
Mn 1.09 9.366E+20 P 0.01 1.524E+19 S 0.032 4.711E+19 Fe 98.648 8.338E+22 Concrete 2.3 Si 33.7 4.120E+22 Fe 1.4 8.609E+20 H 1.0 3.407E+22 O 52.9 1.135E+23 Al 3.4 4.327E+21 Ca 4.4 3.770E+21 Na 1.6 2.390E+21 K 1.6 1.405E+21
* Uranium enriched to 93 w% in U-235
Table 2. Detailed composition of materials used in the problem [8]
5. Neutron Source
The PCA-Replica experiment is driven by a fission plate coupled to the NESTOR core via a thermal column. This source is particularly interesting for the degree of accuracy since the energy distribution is exactly a fission spectrum induced by thermal neutrons.
The shape factor in the x-y plane is defined in Table 3. As we can see it is consistent with the dimensions of zone 8. The source intensity in Table 3 is given in terms of neutrons/cm3/Watt (Watt refers to the fission plate power) and the relative source intensity is obtained after multiplying the data in Table 3 by the respective volumes. The thickness of the plate is constant over the whole area.
X-axis [cm] Y-axis [cm]
-20.10 ÷ -12.10 -12.10 ÷ -4.10 -4.10 ÷ 4.10 4.10 ÷ 12.10 12.10 ÷ 20.10
-31.75 ÷ -26.32 4.424E+07 4.418E+07 4.495E+07 4.448E+07 4.560E+07
-26.32 ÷ -20.58 4.609E+07 4.518E+07 4.557E+07 4.535E+07 4.772E+07
-20.58 ÷ -15.44 4.885E+07 4.696E+07 4.744E+07 4.747E+07 5.040E+07
-15.44 ÷ -10.00 5.157E+07 4.885E+07 4.690E+07 4.989E+07 5.293E+07
-10.00 ÷ -3.33 5.393E+07 5.055E+07 5.160E+07 5.217E+07 5.505E+07
-3.33 ÷ 3.33 5.500E+07 5.135E+07 5.252E+07 5.332E+07 5.601E+07
3.33 ÷ 10.00 5.426E+07 5.078E+07 5.179E+07 5.264E+07 5.531E+07
10.00 ÷ 15.44 5.231E+07 4.927E+07 4.996E+07 5.069E+07 5.351E+07
15.44 ÷ 20.58 5.006E+07 4.764E+07 4.806E+07 4.855E+07 5.144E+07
20.58 ÷ 26.32 4.802E+07 4.642E+07 4.684E+07 4.699E+07 4.964E+07
26.32 ÷ 31.75 4.723E+07 4.670E+07 4.778E+07 4.756E+07 4.874E+07
Table 3. Neutron source shape in x-y plane for the fission plate [8]
Considering the source shape in the z direction, region 8 is divided into four parts and the dependence of the source on z is reported in Table 4 as a histogram distribution.
Step Interval z axis Value Error
Spike 1 - 1.00 – - 0.85 cm 1.109 ± 0.008
Spike 2 - 0.85 – - 0.70 cm 0.997 ± 0.027
Spike 3 - 0.70 – - 0.55 cm 0.939 ± 0.020
Spike 4 - 0.55 – - 0.40 cm 0.955 ± 0.013
Mean spike - 1.00 – - 0.40 cm 1.000 ± 0.006
Table 4. Neutron source shape in z direction for the fission plate [8]
The geometric characterization of the neutron source is then easily reproduced by implementing in MCNP the discrete shape functions in Tables 3 and 4. Concerning the energy spectrum, a standard Watt fission spectrum with recommended parameters for thermal fission in 235U [9] was employed.
The fission neutron production in the plate is considered proportional to the NESTOR core power – from 1 W to 30 kW – with a good degree of accuracy of about 0.4% over the full power range. The PCA-Replica experiment has been carried out with the NESTOR core at full power – namely 30 kW [8]. The final normalization of the fission plate neutron source is 5.1274480×10⁷ n/sec/NESTOR Watt [8] (2.104×10⁷ fissions/sec/NESTOR Watt multiplied by a mean value of 2.437 n/fission [8]). Note that a total error of 3.8% was assigned to the fission plate output [8].
6. Experimental Results
The experimental results produced during the PCA-Replica campaign consisted of the dosimeter readings and the neutron spectra. Since this benchmark is oriented to pressure vessel protection and damage evaluation, particular attention has been paid to the high-energy tail of the neutron spectrum. To this purpose inelastic scattering and proton-recoil dosimeters have been employed with different threshold energies. The response functions utilized are the following:
- 103Rh dosimeters (103Rh(n,n’)103mRh reaction) with energy threshold around 0.04 MeV; - 115In dosimeters (115In(n,n’)115mIn reaction) with energy threshold around 0.35 MeV; - 32S dosimeters (32S(n,p)32P reaction) with energy threshold around 1.00 MeV.
The dosimeters were placed at ten positions inside both the water gaps, the cavities within the pressure vessel sample at ¼ and ¾ of its thickness (referred to as T/4 and 3T/4) and the void box after the pressure vessel sample. Their positions are reported in Table 5.
Reference Location
Distance from Fission
Plate [cm]
Reaction Rate/NESTOR Watt [dps/atom]
103Rh(n,n’)103mRh 115In(n,n’)115mIn 32S(n,p)32P
Systematic ± 3% Systematic ± 2% Systematic ± 4%
1 12 cm Water Gap 1.91 1.69 E -20 ± 3% - - 2 7.41 3.78 E -21 ± 3% - - 3 12.41 1.40 E -12 ± 3% - - 4 14.01 1.27 E -21 ± 3% - - 5 13 cm Water Gap 19.91 4.23 E -22 ± 3% - - 6 25.41 1.15 E -22 ± 4% - - 7 30.41 4.73 E -23 ± 4% - - 8 T/4 39.01 2.07 E -23 ± 1% 3.93 E -24 ± 0.9% 1.08 E -24 ± 1.5% 9 3T/4 49.61 5.53 E -24 ± 1.9% 8.23 E -25 ± 1.4% 1.46 E -25 ± 1.9% 10 Void Box 58.61 1.80 E -24 ± 1.6% 2.31 E -25 ± 1.5% 3.73 E -26 ± 1.3%
Table 5. Threshold reaction rates as measured on the horizontal axis (z axis) [8]
Dosimeter readings are provided with a twofold uncertainty: both systematic and stochastic errors are indicated in Table 5 (stochastic are interpreted as 1 standard deviation of a Gaussian distribution).
As far as the neutron source is concerned, the PCA-Replica source comes mainly from the fission plate. However, some background from the NESTOR core is present, although at a low intensity. It is taken into account as follows:
- dosimeter responses in water gaps (positions 1 to 7): 2% more than fission plate alone; - dosimeter responses in vessel and void (positions 8 to 10): 4% more than fission plate alone.
The neutron spectra have been generated at two positions: inside the vessel sample and in the void box (at the same positions as dosimeters 8 and 10 in Table 5). Spectrum measurements have been made with hydrogen-filled proportional counters together with Ne213 organic liquid scintillators to extend the energy range of spectral measurements above that achievable by gas counters. The experimental results are reported in Table 6. The estimated uncertainty on the unfolded fluxes is not reported in [8]. Thus only the neutron background is considered as a source of uncertainty – as reported above about 4% of the fission plate intensity for these two positions.
Energy Group Flux per unit Lethargy/NESTOR Watt Lower limit
[MeV]
Upper limit
[MeV] T/4 position Void Box position
0.052 0.059 6.8 0.45 0.059 0.067 6.0 0.68 0.067 0.076 6.7 1.21 0.076 0.086 6.7 1.15 0.086 0.097 6.3 0.58 0.097 0.111 7.4 0.87 0.111 0.126 9.0 1.48 0.126 0.143 10.0 2.22 0.143 0.162 9.0 1.62 0.162 0.183 10.0 1.92 0.183 0.207 9.2 1.60 0.207 0.235 10.3 1.49 0.235 0.266 11.7 2.22 0.266 0.302 14.0 3.13 0.302 0.342 17.0 3.31 0.342 0.388 16.0 2.99 0.388 0.439 13.7 1.88 0.439 0.498 16.2 2.33 0.498 0.564 19.0 2.74 0.564 0.639 23.9 4.12 0.639 0.724 20.3 3.19 0.724 0.821 17.1 1.75 0.821 0.930 15.7 1.93 0.930 1.054 15.5 1.69 1.054 1.194 15.3 1.53 1.194 1.353 13.7 1.16 1.353 1.534 13.8 0.94 1.534 1.748 13.3 0.78 1.748 1.969 11.9 0.61 1.969 2.231 11.7 0.46 2.231 2.528 11.2 0.35 2.528 2.865 9.2 0.27 2.865 3.246 6.9 0.18 3.246 3.679 4.4 0.13 3.679 4.169 4.8 0.10 4.169 4.724 5.0 0.09 4.724 5.353 4.2 0.09 5.353 6.065 3.5 0.07 6.065 6.873 2.2 0.06 6.873 7.788 1.5 0.03 7.788 8.825 1.1 0.02 8.825 10.0 0.2 0.01
7. Calculational Methodology
The PCA-Replica benchmark has been simulated with the Monte Carlo code MCNP6.1 [9] which allows a reasonably faithful representation of the geometry of the facility.
A Cartesian fission source in x-y-z coordinates has been implemented and subsequent fissions in the fission plate are treated as absorptions. Neutron-only calculations have been run.
Simulations were run with 109 histories each with a computation time of about 200 min-CPU on a HPC supercomputer CRESCO4 at ENEA Portici Research Center [26].
Variance reduction techniques were implemented. Firstly, an energy cutoff was enabled with a threshold of about 50 keV which takes into account both the energy threshold of the detectors and the lowest energy group in the spectrum counters. Then the multi-response capability of the DSA (Direct Statistical Approach) [11] was employed to produce variance reduction parameters in the form of a weight window [10]. As far as the detector responses were concerned, the calculational (i.e. Monte Carlo statistical) uncertainty was then below 1% even for the 32S detector position in the void box – which is the farthest position from the fission plate and has the highest threshold energy. (We remind ourselves that the uncertainty in the source intensity (§5) is 3.8%.)
8. Nuclear Data Sets
The present benchmark has been utilized to test the following types of nuclear data: - neutron interaction tables for the particle transport;
- dosimetry interaction tables for the dosimeter readings.
All the data are at room temperature – namely 300 K. For each neutron interaction library, every dosimetry table was tested. The following neutron interaction and dosimetry libraries have been employed:
Neutron interaction tables: - ENDF/B-VI.6 [12] - ENDF/B-VII.1 [13] - JEFF-3.1 [14] - JEFF-3.1.2 [15] - JEFF-3.2 [16] - JENDL-4.0 [17]
Dosimetry interaction tables: - 531DOS [18]
- 532DOS [18] - LLLDOS [18] - IRDF2002 [19] - IRDFF-v1.05 [20]
The dosimetry tables 531DOS and 532DOS are based on ENDF/B-V. LLLDOS is based on ACTL from LLNL. 531DOS and 532DOS do not include 103Rh(n,n’)103mRh, while LLLDOS does not include
115In(n,n’)115mIn. In contrast, the 32S(n,p)32P reaction is present in all three dosimetry sets. IRDF2002
and IRDFF-v1.05 are more recent IAEA evaluations, although originally based on ENDF/B-V, which include all dosimetry cross-sections used in this benchmark.
It should be mentioned that the 115In(n,n’)115mIn cross-sections in 531DOS and 532DOS are identical, thus only one is reported in the results. Also the 32S(n,p)32P cross-sections in 532DOS and LLLDOS are identical below 14 MeV and therefore only 532DOS is reported. 103Rh(n,n’)103mRh and 115In(n,n’)115mIn differ between IRDF2002 and IRDFF-v1.05 in the value of the energy threshold.
Although for 115In(n,n’)115mIn there is only a very slight difference, they were kept separate in the comparison. Thus the following dosimetry cross-sections were tested:
32S(n,p)32P 103Rh(n,n’)103mRh 115In(n,n’)115mIn 531DOS × 532 DOS × × LLLDOS × IRDF2002 × × × IRDFF-v1.05 × × ×
9. Comparison between Calculation and Measurement
The results for the Dosimeter responses are shown in the following D series of fifteen Figures. The dosimeter reaction rates have been evaluated along the central axis, even at positions where the real dosimeters are not placed during the experiment. This illustrates the reaction rate trend through the water and the steel samples.
Figs. D.E7.1, D.E7.2, D.E7.3, D.E7.4 and D.E7.5 show the comparison between calculation and measurement with ENDF/B-VII.1 transport neutron cross-sections for the five dosimetry files: 531DOS, 532DOS, LLLDOS, IRDF2002 and IRDFF-v1.05 respectively. Figs. D.JF32.1 – D. JF32.5 show the same comparison with JEFF-3.2 transport neutron cross-sections and Figs. D.JL4.1 – D.JL4.5 with JENDL-4.0 cross-sections.
In these fifteen D series Figures, the calculational results are normalized to the NESTOR power, as are the measurements, i.e. the calculational results and measurements are completely independent of each other. Furthermore, the previously cited measurement errors and the stochastic calculational uncertainties are reported in these Figures as 1 standard deviation error bars. However, they are largely invisible. In any case it is apparent from these Figures that there is a good agreement between calculation and measurement. However, because of the scale we are not able to glean any further information.
Figure D.E7.1. Dosimeter reaction-rate ENDF/B-VII.1 with 531DOS
Figure D.E7.3. Dosimeter reaction-rate ENDF/B-VII.1 with LLLDOS
Figure D.E7.5. Dosimeter reaction-rate ENDF/B-VII.1 with IRDFFv1.05
Figure D.JF32.2. Dosimeter reaction-rate JEFF-3.2 with 532DOS
Figure D.JF32.4. Dosimeter reaction-rate JEFF-3.2 with IRDF2002
Figure D.JL4.1. Dosimeter reaction-rate JENDL-4.0 with 531DOS
Figure D.JL4.3. Dosimeter reaction-rate JENDL-4.0 with LLLDOS
Figure D.JL4.5. Dosimeter reaction-rate JENDL-4.0 with IRDFFv1.05
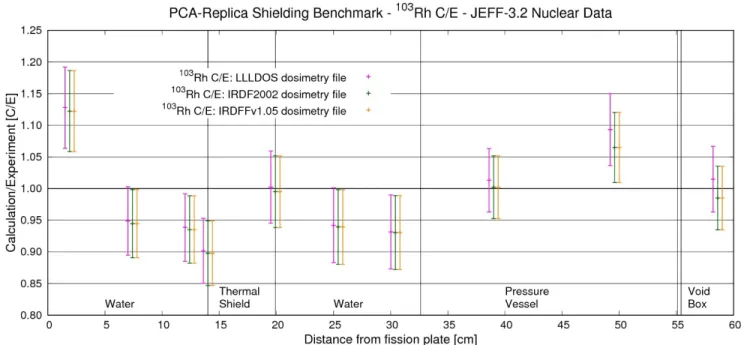
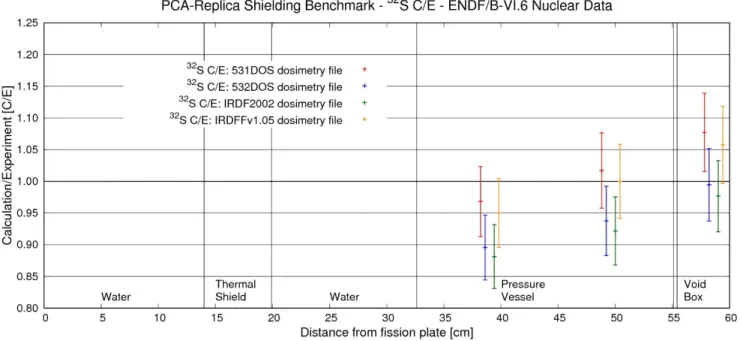
To look more closely at the comparison, in the following DR series of eighteen Figures we present the (Dosimeter) Ratio of the calculated value related to the measurements (i.e. C/E values). Error bars in these Figures are 1 standard deviation and include both calculation and measurement errors.
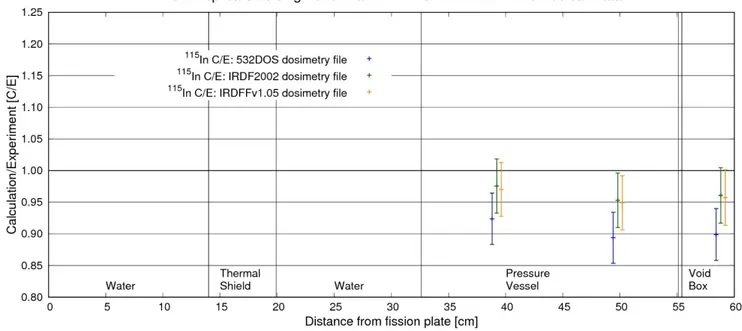
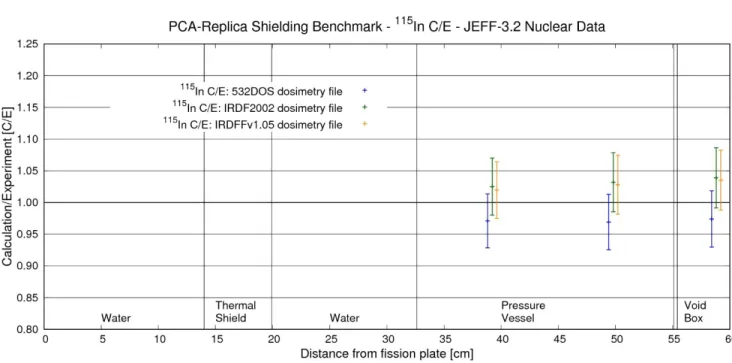
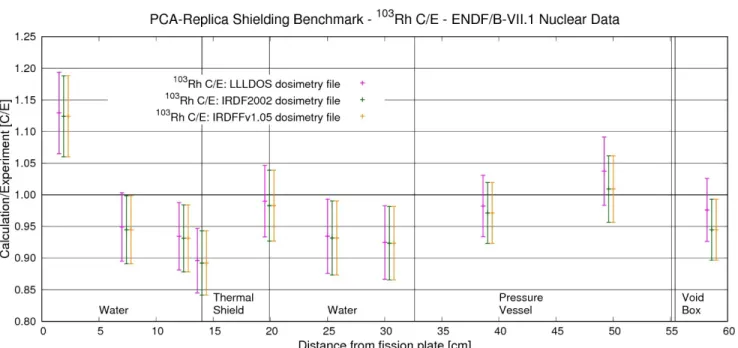
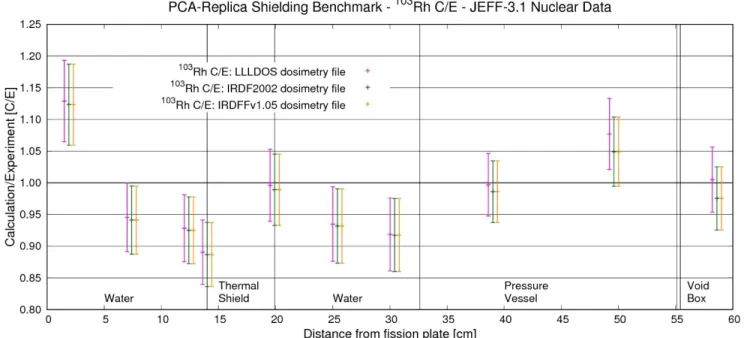
Figs. DR.In.1, DR.In.2, DR.In.3, DR.In.4, DR.In.5 and DR.In.6 show the C/E Dosimeter Ratios for all existing dosimetry files for the 115In(n,n’)115mIn dosimeters for the ENDF-B/VI.6, ENDF/B-VII.1, JEFF-3.1, JEFF-3.1.2, JEFF-3.2 and JENDL-4.0 transport libraries respectively. Similarly Figs. DR.Rh.1 – DR.Rh.6 show the C/E Dosimeter Ratios for all existing dosimetry files for the
103Rh(n,n’)103mRh dosimeters for the same transport library set and Figs. DR.S.1 – DR.S.6 show the
C/E Dosimeter Ratios for all existing dosimetry files for the 32S(n,p)32P dosimeters again for the same
Figure DR.In.1. Ratio of Calculation to Experiment for 115In and ENDF/B-VI.6
Figure DR.In.3. Ratio of Calculation to Experiment for 115In and JEFF-3.1
Figure DR.In.5. Ratio of Calculation to Experiment for 115In and JEFF-3.2
Figure DR.Rh.1. Ratio of Calculation to Experiment for 103Rh and ENDF/B-VI.6
Figure DR.Rh.3. Ratio of Calculation to Experiment for 103Rh and JEFF-3.1
Figure DR.Rh.5. Ratio of Calculation to Experiment for 103Rh and JEFF-3.2
Figure DR.S.1. Ratio of Calculation to Experiment for 32S and ENDF/B-VI.6
Figure DR.S.3. Ratio of Calculation to Experiment for 32S and JEFF-3.1
Figure DR.S.5. Ratio of Calculation to Experiment for 32S and JEFF-3.2
Figure DR.S.6. Ratio of Calculation to Experiment for 32S and JENDL-4.0
Calculated and measured (unfolded) neutron spectra were compared for the positions of dosimeters 8 and 10. The lowest of the 42 energy groups in Table 6 was excluded due to too high statistical uncertainties on the calculated flux. The uncertainties on each of the remaining 41 energy group fluxes, although as expected higher than those on the detector responses (below 1% as discussed in §7), were still in the main satisfactory, given also that the uncertainty in the source intensity (§5) is 3.8%. In particular, for position 8, the average Monte Carlo error over all 6 data libraries and all 41 energy groups was 0.6% with a maximum of 7.2% (JENDL-4.0, 67 - 76 keV). Instead for position 10, the
average error over all 6 data libraries and all 41 energy groups was 1.8% with a maximum of 23.6% (JEFF-3.1, 76 - 86 keV). Figs. S.PV.1, S.PV.2, S.PV.3, S.PV.4, S.PV.5 and S.PV.6 show the calculated and measured Spectra at dosimeter position 8 (i.e. in the PV sample) for ENDF-B/VI.6, ENDF/B-VII.1, JEFF-3.1, JEFF-3.1.2, JEFF-3.2 and JENDL-4.0 transport libraries respectively. Similarly, Figs. S.V.1 – S.V.6 show the calculated and measured Spectra at dosimeter position 10 (i.e. in the Void after the PV sample) for the same set of transport libraries. Again as for the dosimeter results the calculational results and measurements are completely independent of each other, each being normalized to the NESTOR power. Also the previously cited measurement errors and the stochastic calculational uncertainties are reported in these Figures, as 1 standard deviation error bars.
Figure S.PV.2. Calculation and Measured neutron spectra at position 8 – ENDF/B-VII.1
Figure S.PV.4. Calculation and Measured neutron spectra at position 8 – JEFF-3.1.2
Figure S.PV.6. Calculation and Measured neutron spectra at position 8 – JENDL-4.0
Figure S.V.2. Calculation and Measured neutron spectra at position 10 – ENDF/B-VII.1
Figure S.V.4. Calculation and Measured neutron spectra at position 10 – JEFF-3.1.2
Figure S.V.6. Calculation and Measured neutron spectra at position 10 – JENDL-4.0
Again calculated and experimental values were compared in the following SR series of six Figures in which we present the (Spectrum) C/E Ratio. Figs. SR.1, SR.2, SR.3, SR.4, SR.5 and SR.6 show the C/E Spectral Ratios for both positions (PV and Void) for the ENDF-B/VI.6, ENDF/B-VII.1, JEFF-3.1, JEFF-3.1.2, JEFF-3.2 and JENDL-4.0 transport libraries respectively. Error bars in these Figures are 1 standard deviation and include both calculation and measurement errors.
Figure SR.1. Ratio of Calculation to Experiment for neutron spectra – ENDF/B-VI.6
Figure SR.3. Ratio of Calculation to Experiment for neutron spectra – JEFF-3.1
Figure SR.5. Ratio of Calculation to Experiment for neutron spectra – JEFF-3.2
10. Discussion
The three dosimeters, Indium, Rhodium and Sulphur, show a good agreement between calculation and measurement for the three most recent transport libraries and all five dosimeter libraries as can be seen in the D series of figures. (Furthermore the three older transport libraries show equally good agreement.) Looking more closely at the comparison by means of the C/E values in the DR series of eighteen figures:
- As far as 115In(n,n’)115mIn is concerned, the more recent IRDF dosimetry files may be slightly better than the older 532DOS file. The qualities of the six transport cross-section files are indistinguishable.
- As far as 103Rh(n,n’)103mRh is concerned, the qualities of the IRDF and LLLDOS dosimetry files look indistinguishable as do those of the six transport cross-section files. The calculation at the first detector position at 1.91 cm from the fission plate looks a slight overestimate. This is probably due to source modelling rather than to transport or dosimetry cross-sections.
- As far as 32S(n,p)32P is concerned, there is a tendency for the C/E value to increase from just below 1 to just above 1 between detector positions 8 and 10 for all dosimetry files and for all six transport files. This looks as if it could be due to the NESTOR background estimate. It is difficult to distinguish between the dosimetry files, but with regard to the transport filesthe two ENDF/B files may be very slightly better than any of the three JEFF files or the JENDL files. Note that the above conclusions are extremely tentative given the 1 s.d. error bars.
Looking at the flux spectra in the series of six S.PV and six S.V Figures, we firstly note that the only uncertainties in the measurements are those of the NESTOR background. Neither the detector (hydrogen proportional counters or liquid scintillators) measurements nor the unfolding procedure (with the code RADAK) have been assigned uncertainties [8]. Therefore, the error bars on the experimental spectra are certainly underestimates.
Secondly we note at both measurement positions – in the PV and Void – in the energy range below around 1 MeV that the calculated and measured spectra fluctuate above and below each other. We may tentatively assign these differences to the unfolding procedure. Instead there remains a macroscopic effect, which is an underestimate of the calculated flux at position 8 in the PV sample above around 2 – 2.5 MeV (ignoring the very low flux in the highest energy bin 9 - 10 MeV). Such an underestimate is present for all transport files but is slightly less for JENDL-4.0. This underestimate is not present in the spectra at position 10 in the Void. On the contrary there is, if anything, a slight overestimate of the calculated flux in the same energy range. Such overestimate becomes macroscopic for JENDL-4.0 above around 3 MeV.
These effects are apparent in the six SR series of Figures where we see the C/E values. From these Figures, JENDL-4.0 looks somewhat better than the other five files at position8 in the PV sample and somewhat worseat position 10 in the Void. The other five files look similar to each other.
11. Conclusions
The results show in general a good agreement with the experimental data especially for the three dosimeters. The spectra instead show calculational underestimates in the MeV energy range for the
measurement within the mild steel sample and calculational overestimates in the same energy range for the measurement in the void after the mild steel sample.
12. Acknowledgments
The authors would like to acknowledge Dr Massimo Pescarini who supplied precious information in analyzing and preparing the data for the simulations and Dr Ivan Kodeli who provided useful comments on the draft text.
The computing resources and the related technical support used for the MCNP calculations have been provided by CRESCO/ENEAGRID High Performance Computing infrastructure and its staff [26]. CRESCO/ENEAGRID High Performance Computing infrastructure is funded by ENEA, the Italian National Agency for New Technologies, Energy and Sustainable Economic Development and by Italian and European research programs, see http://www.cresco.enea.it/english for further information.
13. References.
1. A. Ballesteros et al., “The Role of Pressure Vessel Embrittlement in the Long Term Operation of Nuclear Power Plants”, Nuclear Engineering and Design, 234 (2012) 63-68
2. A. Al Mazouzi et al., “PERFORM 60: Prediction of the Effects of Radiation for Reactor Pressure Vessel and In-core Materials Using Multiscale Modelling – 60 years Foreseen Plant Lifetime”, Nuclear Engineering and Design, 241 (2011) 3403-3415
3. S. Van Der Marck, “Benchmarking ENDF/B-VII.1, JENDL-4.0 and JEFF-3.1.1 with MCNP6”, Nuclear Data Sheets, 113 (2012) 2935-3005
4. Nicks et al., “Fission Neutron Penetration in Iron and Sodium – I. Activation Measurements”, Annals of Nuclear Energy, 15, 9 (1988) 457-469
5. Perlini et al., “Fission Neutron Penetration in Iron and Sodium – II. Neutron Spectrometry”, Annals of Nuclear Energy, 16, 4 (1989) 189-201
6. Žerovkin et al., “Re-evaluation of the EURACOS Integral Shielding Experiment Series”, Annals of Nuclear Energy, 77 (2015) 318-325
7. Nuclear Energy Agency (NEA), Shielding Integral Benchmark Archive and Database (SINBAD) section: https://www.oecd-nea.org/science/wprs/shielding/
8. Butler et al., “The PCA-Replica Experiment Part I, Winfrith Measurements and Calculations”, Reactor Physics Division, AEEW – R1736 (1984)
9. Goorley et al., “MCNP6 User’s Manual” Version 1.0, LA-CP-13-00634, Rev0 (2013)
10. Booth, “Genesis of the Weight Window and the Weight Window Generator in MCNP – A Personal History”, LA-UR-06-5807, (2006)
11. K.W. Burn, Nuclear Technology, 175-1 138-145 (2011)
12. Rose, Ed., “ENDF-201, ENDF/B-VI Summary Documentation”, BNL-NCS-17541, 4th Edition, Brookhaven National Laboratory (October 9119).
13. Chadwick et al., “ENDF/B-VII.1 Nuclear data for science and technology: cross sections, covariances, fission product yields and decay data”, Nuclear Data Sheets 112 (2011), 2887-2996
14. The JEFF-3.1 Nuclear Data Library, JEFF Report 21, OECD-NEA Data Bank, 2006
15. The JEFF-3.1.2 Nuclear Data Library, JEFF Report, OECD-NEA Data Bank: http://www.oecd-nea.org/dbforms/data/eva/evatapes/jeff_31/JEFF312/
16. The JEFF-3.2 Nuclear Data Library, JEFF-3.2 evaluated data library - Neutron data: http://www.oecd-nea.org/dbforms/data/eva/evatapes/jeff_32/
17. Shibata et al., “JENDL-4.0: A new library for nuclear science and engineering”, Journal of Nuclear Science and Technology, 48(1), 1-30 (2011)
18. Little et al., “Dosimetry/Activation Cross Sections for MCNP”, MS B226, (1984)
19. International Reactor Dosimetry File: IRDF-2002 – A Data Development Project of the IAEA Nuclear Data Section: https://www-nds.iaea.org/irdf2002/index.htmlx
20. International Reactor Dosimetry and Fusion File IRDFF v.1.05 – Nuclear Data Section: https://www-nds.iaea.org/IRDFF/
21. Matijević et al., “Modeling of the ORNL PCA Benchmark Using SCALE6.0 Hybrid Deterministic-Stochastic Methodology”, Science and Technology of Nuclear Installations, article ID 252140 (2013)
22. Pescarini et al., “Validation of the BUGJEFF311.BOLIB, BUGENDF70.BOLIB and BUGLE-96 Cross Section Libraries on the PCA-Replica (Water/Iron) Neutron Shielding Benchmark Experiment”, ENEA Report ADPFISS-LP1-024, (2014)
23. M. Pescarini, R. Orsi, M. Frisoni, “Three-Dimensional (X,Y,Z) Deterministic Analysis of the PCA-Replica Neutron Shielding Benchmark Experiment Using TORT-3.2 Code and Group Cross Section Libraries for LWR Shielding and Pressure Vessel Dosimetry, Proceedings of the 15th International Symposium on Reactor Dosimetry (ISRD-15), Paris, France, May 18-23, 2014. ENEA-Bologna Technical Report UTFISSM-P9H6-011, October 2, 2014
24. M. Pescarini, R. Orsi, M. Frisoni, “PCA-Replica (H2O/Fe) Neutron Shielding Benchmark
Experiment – Deterministic Analysis in Cartesian (X,Y,Z) Geometry Using BUGENDF70.BOLIB and BUGLE-96 Cross Section Libraries, ENEA-Bologna Technical Report UTFISSM-P9H6-009, November 20, 2014
25. Nuclear Data Service, Lund/LBNL. Table of Isotopes: http://nucleardata.nuclear.lu.se/toi/ 26. G. Ponti et al., "The role of medium size facilities in the HPC ecosystem: the case of the new
CRESCO4 cluster integrated in the ENEAGRID infrastructure", Proceedings of the 2014 International Conference on High Performance Computing and Simulation, HPCS 2014, art. no. 6903807, 1030-1033;
![Table 4. Neutron source shape in z direction for the fission plate [8]](https://thumb-eu.123doks.com/thumbv2/123dokorg/5608315.68044/10.918.114.799.175.435/table-neutron-source-shape-z-direction-fission-plate.webp)
![Table 6. Neutron spectra as measured at T/4 and Void Box positions [8]](https://thumb-eu.123doks.com/thumbv2/123dokorg/5608315.68044/12.918.180.737.159.974/table-neutron-spectra-measured-t-void-box-positions.webp)