Decoding Musical Training from
Dynamic Processing of Musical
Features in the Brain
Pasi Saari
1, Iballa Burunat
1, Elvira Brattico
2& Petri Toiviainen
1Pattern recognition on neural activations from naturalistic music listening has been successful at predicting neural responses of listeners from musical features, and vice versa. Inter-subject differences in the decoding accuracies have arisen partly from musical training that has widely recognized structural and functional effects on the brain. We propose and evaluate a decoding approach aimed at predicting the musicianship class of an individual listener from dynamic neural processing of musical features. Whole brain functional magnetic resonance imaging (fMRI) data was acquired from musicians and nonmusicians during listening of three musical pieces from different genres. Six musical features, representing low-level (timbre) and high-level (rhythm and tonality) aspects of music perception, were computed from the acoustic signals, and classification into musicians and nonmusicians was performed on the musical feature and parcellated fMRI time series. Cross-validated classification accuracy reached 77% with nine regions, comprising frontal and temporal cortical regions, caudate nucleus, and cingulate gyrus. The processing of high-level musical features at right superior temporal gyrus was most influenced by listeners’ musical training. The study demonstrates the feasibility to decode musicianship from how individual brains listen to music, attaining accuracy comparable to current results from automated clinical diagnosis of neurological and psychological disorders.
Neural processing of naturalistic musical signals involves dynamic integration of a variety of musical features1. Continuous listening of music is thus effective at recruiting several fronto-temporal, parietal and limbic areas across the brain, showing the involvement of both perceptual, action-simulation, emotional and attentional pro-cesses during feature integration. A large number of features describing musical audio signals, developed in the field of Music Information Retrieval (MIR)2, can be computed using many available tools, such as MIR Toolbox3. These features include low-level musical features, i.e., features associated with early stages of sound processing, such as those related to pitch, timbre, and amplitude, and high-level features, such as those related to tonality, pulse, or song structure. In MIR, pattern recognition approaches have been employed to model semantic con-cepts, such as emotion or genre using combinations of musical features as inputs4. Combining these approaches makes it possible to model time-series of neural activations with musical features, and vice-versa. These meth-ods are referred to as encoding and decoding, respectively5. Using naturalistic music as stimuli, recent studies have shown the advantages of encoding and decoding for describing the links between dynamic changes in the musical features and time courses of neural activations recorded using electroencephalography (EEG)6–8 and functional Magnetic Resonance Imaging (fMRI)1,9–11. Using fMRI, significant correlations have been discovered across the brain between musical features and the voxel-wise blood-oxygen-level dependent (BOLD) time-series1. The found correlations include those between low-level timbral features and cognitive areas of the cerebellum and sensory and default mode network cerebrocortical areas, and between high-level pulse and tonality features and cognitive, motor and emotion-related circuits. By combining multiple musical features for voxel-wise fMRI encoding by means of linear regression, significant prediction accuracy has been obtained for auditory, limbic, and motor regions, notably for medial orbitofrontal region, anterior cingulate cortex, and right superior temporal gyrus9. When it comes to the decoding of musical features from BOLD time-series, significant accuracy has been obtained for timbral and rhythmic features for the majority of participants10. However, the accuracy levels for the high-level key clarity feature varied between participants, which suggests high inter-participant variability in the neural processing.
1Department of Music, Art, and Culture Studies, University of Jyväskylä, Jyväskylä, PL 35(M), FI-40014, Finland. 2Center for Music in the Brain (MIB), Department of Clinical Medicine, Aarhus University, Aarhus, DK-8000, Denmark. Correspondence and requests for materials should be addressed to P.S. (email: [email protected])
Received: 14 September 2017 Accepted: 22 December 2017 Published: xx xx xxxx
Although participant-specific differences in the neural processing of music are a result of a multitude of demo-graphical and background variables, musical expertise resulting from music instrument training has been iden-tified as a major contributor. Only 15 months of musical training in early childhood leads to structural changes in the brain and may lead to improvements in musically relevant motor and auditory skills12. Motor demands of music instrument playing have been linked to functional symmetry in the brain regions involved in somatosen-sory and motor control in the parietal and frontal lobes13. This relates to neuroplasticity that enables the optimiza-tion of behavior to environmental demands14. Furthermore, an enhancing cross-modal transfer effect of musical training has been found on tasks requiring nonmusical auditory processing, such as speech and language learning and the evaluation of vocal expressions of emotion15.
Past studies on the effect of musical training on the brain have utilized statistical analyses of functional or structural group differences between musicians and nonmusicians16–19. However, the used approaches lack the capability of integrating dynamic relationships between multiple brain areas and musical features. Moreover, the used statistical techniques, usually yielding significance estimates as p-values, are not developed to inform about their generalizability to participant populations not involved in the study. In this study, we devised a multivariate pattern classification framework, evaluated by cross-validation with held-out participants, that overcomes these weaknesses. Instead of p-values of group differences, the performance is evaluated by means of classification accuracy, defined as the number of correctly classified participants divided by the number of evaluated partici-pants. By shifting from using p-values to using classification accuracy, we change the question “how significant are the differences between musicians and nonmusicians” to the question “how likely would a person not used in the model training be identified correctly as a musician or nonmusician”. In general, it is more challenging to show a significant effect by means of classification accuracy than by statistical analysis of group differences20. Outside the musical domain, single subject prediction has received considerable attention in the automated clini-cal diagnosis of neurologiclini-cal and psychiatric disorders20. The approaches, mainly based on whole brain structural MRI or fMRI in the resting state or task dependent conditions, have reached high correct classification rates in separating patients from healthy controls21–24. According to a survey based on 200 studies focused on MRI-based single subject prediction, median classification accuracies obtained for different brain disorders have ranged from 75% (attention-deficit hyperactivity disorder, stable versus progressive mild cognitive impairment) to over 85% (Altzheimer’s disease, autism spectrum disease)20.
The present study is the first study to propose and evaluate an approach for decoding musical training in music neuroscience. The main novelty of the proposed decoding approach lies in combining computational acous-tic feature extraction with neuroimaging data and using the temporal evolution of brain responses to music obtained during a real-life listening condition. FMRI data was re-analyzed from a previously published dataset of 18 musicians and 18 nonmusicians11,13,25,26 who were scanned during continuous listening to pieces of real music related to three distinct musical genres. Musical features were extracted computationally from the music pieces and used to encode regional neural activations in each participant. Log-likelihood ratios between musician and nonmusician models describing neural activation patterns arising from musical feature processing were used as input to a classifier that was trained to infer the musicianship of the participants. Model training and testing was done using cross-validation to avoid overfitting and to obtain a realistic estimate of the model performance on novel participants. Utilizing temporal information in classification rather than directly using correlations between stimulus features and neuroimaging data enables one to dynamically take into account the temporally changing statistical uncertainty. This has been found effective in past approaches on fMRI decoding27,28. However, these past approaches were designed for classification of data into experimental conditions rather than classifying par-ticipants in terms of demographic attributes.
The hypotheses of the present study are as follows: First, based on past findings of significant differences between musicians and nonmusicians, we expected to obtain higher-than-chance classification accuracies. However, since we were conducting the analysis on healthy participants, we did not expect to reach as high accuracy levels than those obtained for neurological disorders having severe structural or functional effects on the brain, such as autism spectrum disease or Altzheimer’s disease. Second, the brain regions expected to yield the highest discriminative power for the binary classification as a musician or nonmusician were areas related to the motor and auditory sensory systems11,29–33. Third, hemispheric asymmetries were expected to be observed on the basis of specialization in music processing for specific musical attributes evidenced in previous work13,34–36. Fourth, the decoding accuracy was expected to be driven mainly by high-level musical features, as neural pro-cessing of these features has been suggested to have high inter-participant variability10 and are dependent upon rules learned in exposure to music11.
Results
Classification Accuracy.
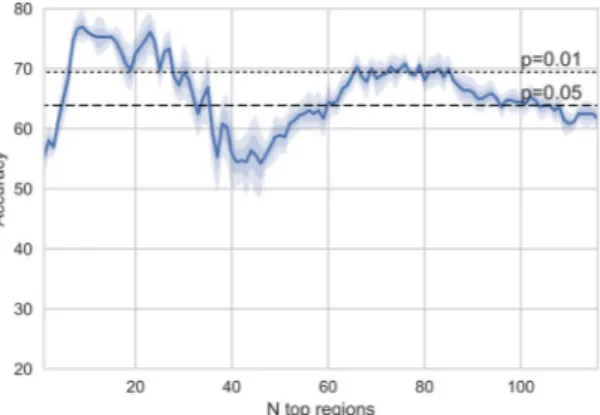
First the decoding accuracy was examined as a function of the number of included regions in the model. The decoder was cross-validated using the concatenated stimulus for training and testing.As can be seen in Fig. 1, a rather low number of top regions yields the optimal performance for the musi-cal stimulus. The highest mean accuracy of 76.94% is achieved using nine regions (Sensitivity = 73.33%, Specificity = 80.56%, AUC = 0.8059). The statistical significance of the accuracies was examined by comparing the accuracies obtained from each cross-validation run to a binomial distribution (n = 36; p = 0.5) and taking the median of the p-values. Based on this, the obtained accuracy with nine regions is significantly (p < 0.0001) above the chance rate of 0.5 for this binary classification with equal number of participants in both classes. The
R2 measures between predicted and actual BOLD time series for the linear regression models of each participant
corresponded to correlations of 0.1 to 0.3.
As participants’ familiarity with the musical pieces differed between musicians and nonmusicians, additional analysis was done to rule out the effect of familiarity from the decoder model performance. To this aim, partial correlations were computed between the probabilities for the musicianship class obtained from the decoder and
each participant’s actual class, removing the effect of each participant’s mean familiarity across the three musical stimuli. The mean correlation across the cross validation runs (r = 0.44) was significant at p < 0.01, and thus we conclude that the classification results do not reflect the participants’ familiarity with the musical pieces used in the experiment.
Selected Regions and their Discriminative Power.
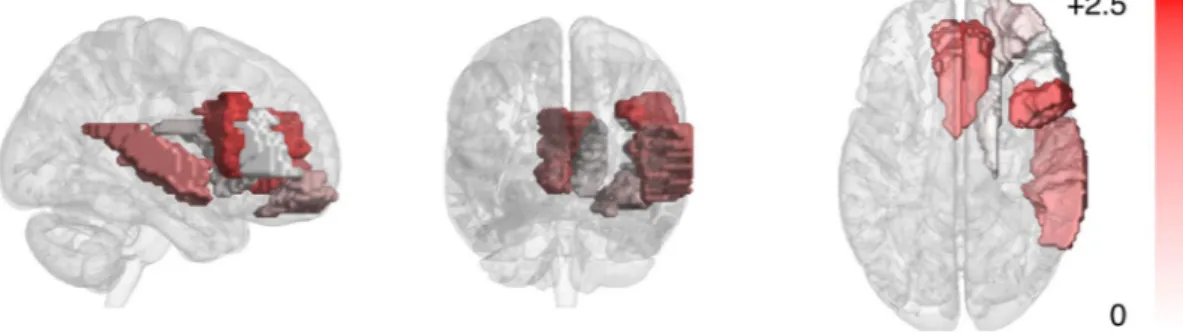
The regions selected by the decoder models operat-ing on nine regions, givoperat-ing the optimal classification accuracy, were inspected. Since at each fold the selected nine regions are potentially different due to the use of different training data, the selected regions for the models from all of the 180 cross-validation folds were inspected. Nine regions were consistently selected: the right Superior temporal gyrus (STG); bilateral Caudate nucleus (CAU), the right Middle frontal gyrus (MFG), the orbital part of the right MFG, bilateral Anterior cingulate and paracingulate gyrus (ACG), and the triangular and opercular part of the right Inferior frontal gyrus (IFG). Right lateralization was observed in the selected regions–seven out of the nine regions were located at the right hemisphere.To estimate how well the nine selected regions individually discriminate musicians and nonmusicians, the log-likelihood ratios were computed for all participants using the cross-validation procedure. This is equiva-lent to computing the input features for the classification stage of the decoder. For each cross-validation run, the obtained values were compared between musicians and nonmusicians using the one-tailed Student’s T-test (df = 35; one-tailed test was used since log-likelihood ratios between musicians and nonmusicians can be assumed to be higher values for musicians than nonmusicians). The Z-values thus computed were averaged across the cross-validation runs, and the p-value was computed from the average Z-value. The statistics are shown in Table 1, and the Z-values are visualized in Fig. 2. Regions yielding statistical significant differences at p < 0.05 for the discrimination were the bilateral ACG, the opercular part of the right inferior frontal gyrus (IFG), and the right superior temporal gyrus (STG).
Although the selected regions were right-lateralized, the ranking-based region selection could have discarded the homologous regions in the left hemisphere by only slight margins. Therefore, the lateralization of the discrim-inative power of the significant regions was tested by means of comparison of the decoding accuracies obtained with the regions at the right and left hemispheres. To this aim, the decoding accuracy was computed by training the decoder model separately using homologous regions of ACG, opercular part of the IFG (IFGoper), and STG from the left and right hemisphere as well as bilaterally. Again, the cross-validation was run ten times, and the obtained accuracies were averaged across the runs. The results are displayed in Table 2. For both the ACG and IFGoper, the right hemispheric regions yielded the highest accuracy 66.94% and 64.17%, respectively. These
Figure 1. Accuracy (%; mean and 68% (dark color), 95% (light color) confidence intervals across the
cross-validation runs) with different number of regions.
Region Z-value p-value
Caudate nucleus L −0.122 0.549
Caudate nucleus R 0.428 0.334
Middle frontal gyrus R 0.008 0.497 Middle frontal gyrus, orbital part R 1.000 0.159 Anterior cingulate and paracingul. gyrus L 1.901 0.029 Anterior cingulate and paracingul. gyrus R 2.229 0.013 Inferior frontal gyrus, opercular part R 2.225 0.013 Inferior frontal gyrus, triangular part R 0.299 0.382 Superior temporal gyrus R 1.654 0.049
Table 1. Z-values and p-values for the log-likelihood ratios averaged across the cross-validation runs (p < 0.05
accuracies were significantly higher than the chance rate at p < 0.05. The STG did not yield accuracy higher than the chance rate with any of the region configurations.
Musical Feature Contributions.
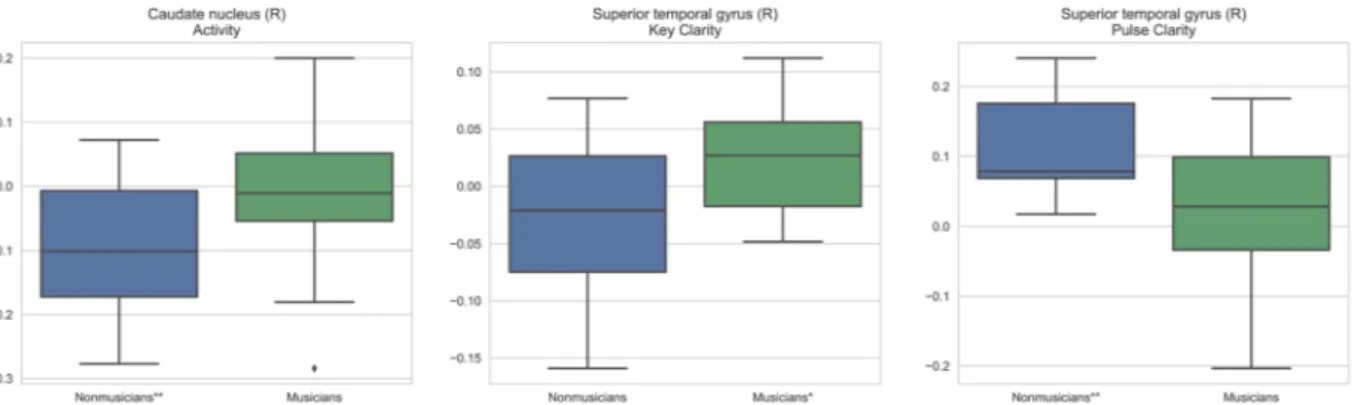
The standardized musical feature beta coefficients from the participant- specific linear regression stage of the modeling were inspected to see whether the musical features activate the nine discriminative regions differently for musicians than nonmusicians. Two sample t-test statistics, assuming independent samples, were computed for the differences of the mean coefficient values between musicians and nonmusicians. Figure 3 shows the group distributions of the coefficients for the most significant region/feature combinations based on these tests. It is notable that all of the obtained regions are located at the right hemisphere. For the right STG, Key Clarity coefficient values were higher for musicians (t = 2.49, p < 0.05), whereas Pulse Clarity values were higher for nonmusicians (t = −2.83, p < 0.01). For the right CAU, Activity values were higher for musicians (t = 2.35, p < 0.05). In order to back the claim for the group-specific effect of features on the region activations, one-sample t-tests were conducted for musicians and nonmusicians separately to see if the group means differ significantly from zero. The significance levels from these tests are shown in Fig. 3. The right CAU correlates negatively with Activity in nonmusicians, the right STG correlates positively with key clarity in musi-cians, and the right STG correlates positively with Pulse Clarity in nonmusicians.Discussion
The brain regions selected by the decoder which individually best discriminated between musicians and non-musicians were the bilateral anterior cingulate and paracingulate gyrus (ACG), the opercular part of the right inferior frontal gyrus (rIFGoper, corresponding to the right homologue of the Broca’s area), and the right superior temporal gyrus (rSTG). Thus, these set of areas can be regarded as core areas in the processing of musical features which are most affected by musical training and consequently exhibit highest discriminative power amongst all brain areas.
The ACG is located in the medial surface of the frontal gyrus and constitutes a prominent node within the salience network, an intrinsically connected large-scale network which is implicated in a variety of complex brain functions by means of integrating sensory, emotional, and cognitive information37,38. The ACG is amongst the most frequently activated regions in all of functional neuroimaging research39, which is indicative of its central engagement in an array of different cognitive functions. It plays a crucial role in attentional control40, which is consistent with the observation of ACG’s increased activation when participants selectively attend or orient atten-tion to an unexpected stimulus41.
In the context of music, the ACG seems to exhibit larger BOLD responses bilaterally in musicians compared to controls as reflective of enhanced music-related working memory capacity, suggesting musicians’ ability to main-tain focus on task-relevant stimuli, likely as a result of their training as music experts42. The ACG has also been found to covary positively with the degree of prediction during sensorimotor synchronization in musicians43. The present music-listening paradigm involves a sustained attention task, in which musicians, by virtue of their exper-tise, may have been more engaged than nonmusicians as a result of their increased sensitivity to the musical mate-rial. This could explain the recruitment of this region as one of the discriminative regions selected by the decoder. The opercular part of the IFG (BA44) as a central structure in music processing is well-supported by the converging evidence from the literature dealing with musical discrimination, harmony, timbre, tonality, rhythm, intensity, and error detection for melody and harmony during score reading44. Specifically, the rIFGoper is the right hemispheric homologue of Broca’s area, a well-recognized neural substrate for speech production and gram-mar acquisition45.
Figure 2. Musicianship discrimination in the nine discriminative regions–Z-values for the group differences of
log-likelihood ratios averaged across cross-validation runs.
Region LH LH + RH RH
ACG 57.78 61.39 66.94 IFGoper 48.06 56.67 64.17 STG 50.83 57.78 56.94
Table 2. The average decoding accuracy (%) using the regions from the left (LH), right (RH), and both
Previous work has revealed that the frontal operculum, with a right hemisphere asymmetry, constitutes a sensitive area involved at least partly in the processing of musical syntax using chord sequence and melody para-digms46,47. Similarly, activation of the rIFGoper has been observed during music listening by an increasing degree of auditory working memory operations48,49. Moreover, differential activity in the rIFGoper region was elicited when participants were asked to spontaneously generate melodic phrases vs linguistic sentences50. In general, activations within the rIFGoper seem to underpin processes of music–syntactic analysis and detection of viola-tions in the harmonic rules of music, which in turn requires working memory resources51, suggesting that musical syntax may be processed in a homologous manner to language syntax.
In terms of effects of musical training, group comparisons have determined that bilateral IFGoper together with the anterior rSTG become more strongly activated in musically trained than untrained individuals in response to music-syntactically irregular chords46. This has been taken to imply a more prominent involve-ment of neural resources engaged in music-syntactic processing in musicians, as a consequence of the enhanced representations of musical regularities bolstered by years of experience in both music practice and theory. This acquired musical fitness would purportedly render them more sensitive to react to the violations of these regu-larities46. Moreover, correlation analysis has revealed that the earlier the onset of musical training, the higher the node degrees (higher connectivity with other areas) in the right Broca’s homologue26. This suggests that plasticity in this area is associated to intense musical training, particularly at an early onset age. On the basis of the literature cited above, the ability of the decoder to extract this particular syntax-processing core region in search for the optimal classification accuracy may support right Broca’s homologue’s sensitivity to the impact of musical training on the processing and detection of regularities in music.
The bilateral STG is the site of the primary and association auditory cortex, responsible for sound perception. Its right hemispheric homologue (rSTG) exhibits an improved ability to resolve spectral information compared to its left hemisphere counterpart52,53. Thus, it is considered to be dominant for representing melody, pitch, harmony, and timbre54. Robust supporting evidence on how the two hemispheres integrate distinct aspects of auditory information to make sense of the auditory input derives from both lesion studies with unilaterally brain-damaged patients55,56, reporting that right temporal lesions cause amusia or deficits in the discrimination of melodies), and neuroimaging studies53. Moreover, rSTG has been implicated as a core region for processing musical features from naturalistic music stimuli, with activation patterns that generalize across musical pieces9.
Formal musical training endows musicians with explicit and implicit knowledge about musical categories. This impacts the musician’s discrimination abilities compared to the untrained listener in terms of the detection and analysis of acoustic events, such as intervals, harmonic types and chord progressions57. As a result, the rSTG would manifest a high discriminative accuracy with the present decoding approach to separate musicians’ brain responses from those of nonmusicians in continuous music listening, drawing from long-term experience-driven plasticity in the musical domain.
The direction of the lateralization observed in the present decoding approach involving right fronto-temporal areas is consistent with the right hemispheric dominance of frontal and temporal regions for the processing of specific acoustic characteristics of music (and also certain pragmatic aspects of language, i.e., prosodic or intona-tional information expressed by accentuation and boundary markings through pitch variation58). In music, the right-left dissociation responds to different attributes of acoustic information. For example, temporal modula-tions increase activation in the auditory cortical region in the left hemisphere, whereas spectral modulamodula-tions do so in the homologous right auditory cortical region53,59. Similarly, the decoder’s selection of the right-hemispheric frontal operculum for accurate decoding of musicianship conforms with its central role in the syntactic pro-cessing of music and thus sensitive to training-driven plasticity. Consistent with this, right-lateralized responses to music have been observed in previous findings on musical processing in musicians during listening1,9,10,47. Similarly, the decoder’s selection of the right-hemispheric frontal operculum for accurate decoding of musician-ship conforms with its central role in the syntactic processing of music, thus sensitive to training-driven plasticity. So far we have discussed the contribution of all musical features taken together. To better describe the infor-mation that is used by the classifier to separate musicians and nonmusicians, we investigated the contributions of each of the six individual musical features for the selected regions. The three musical dimensions and regions that
Figure 3. Distributions of feature beta coefficients for region/feature combinations yielding the most significant
differences between the group means as shown by the two sample t-tests. Significance from one sample t-tests for the groups are marked with *(p < 0.05) and **(p < 0.01) after the group labels.
showed the most significant differences in their beta coefficients in the encoding stage of the present approach were Pulse Clarity (rSTG), Key Clarity (rSTG), and Activity (right caudate nucleus [rCAU]). We discuss these features in the following.
Pulse Clarity yielded a significant discriminative power and had significantly higher than zero beta coefficients for nonmusicians for the rSTG. The STG has been established in the literature as a neural substrate for rhythm in controlled experimental setting60, but also under naturalistic stimulation, where the activation exhibited a right-ward bias1,9. Results are in line with past findings with the same fMRI and musical feature data as used here, where the rSTG was observed as part of a functional network subserving pulse clarity in nonmusicians to a greater degree than in musicians11. They hypothesized that models of pulse clarity based on the acoustic properties of the stimulus may predict better nonmusicians’ brain responses to the musical pulse than those of musicians. A rea-son for this may be that musicians’ models of pulse clarity depend less on acoustic features and more on rules of metricality, learned through musical training, than those of nonmusicians11. Thus, this could explain the efficient discrimination of musicianship class by this musical feature.
Similar to Pulse Clarity, Key Clarity is a complex percept dependent on top-down, cognitive control processes and is therefore expected to be more individualized and thus display higher inter-subject variance compared to low-level acoustic features61. This has also been suggested by high inter-subject variance in the decoding accu-racy10. Key Clarity yielded a significant discriminative power in the rSTG and higher than zero beta coefficients for the rSTG region for the musically trained listeners. This indicates that brain responses related to the percept of tonality may be either more homogeneous or alternatively stronger across musicians than nonmusicians. In addition, the fact that Key Clarity shows significant differences in rSTG is in line with previous findings relating Key Clarity with the primary right auditory cortex as the specialized brain substrate in processing tonality, in particular consonant chords62.
Activity, as a low-level percept, may be more stable and less individualized across participants compared to Pulse and Key Clarity. Perceptually, music high in Activity is characterized by high degree of dissonance and rapid high frequency changes (e.g., quick passages in the music featuring multiple instruments playing different pitches simultaneously). Brain responses in the rCAU, part of the dorsal striatum within the basal ganglia structures, had significantly positive coefficients related to Activity in musicians. The CAU is involved in a wide range of functions related to motor control, cognition (memory, learning) and emotion. With reference to music, previous work suggests that distinct parts of the basal ganglia may touch upon specific aspects of music processing, where the dorsal region has a role in rhythm60,63,64. Other work relates the rCAU with working memory functions for music49 or with processing of sad and implicit musical emotions65. The rCAU has been found to be modulated by the emotional content of music, in particular, by high arousal emotions irrespectively of their valence (tension, joy and power)66. Closely related to these findings are results showing that the activation in the rCAU in anticipation to peak emotional responses to music correlated with dopamine release within the rCAU67. In view of the many functions of the CAU, it is difficult to assess the significance of this result. However, in the light of the above cited literature suggesting a role of the rCAU in arousal and strong emotional responses in music, we hypothesize that Activity may represent aspects of the arousal dimension used in emotion research thus providing an explanatory context for this finding. According to this, musical training would seem to play a role in enhancing affective responsiveness to Activity.
We note that while the inferences made a posteriori based on the recruited regions found in this observa-tional decoding study are speculative (being drawn from findings derived from previous literature), they serve to stimulate future ad-hoc hypothesis-driven studies. The musical features at temporal resolution of one second, as used here, have been found to be related to the BOLD response in past studies1,9–11. For allowing to study the correlation between features and BOLD signal, the low-level features were down-sampled to one second, but the typical frame for calculating them is around 30 msec. While we are aware that the temporal dynamics of acoustic features, especially the low-level timbral ones, is much faster than the BOLD signal, our previous findings demon-strate that the hemodynamic response can track the temporal course of the features at 1-sec scale.
In sum, despite the existence of inter-subject variability independent from musical training itself (e.g., per-sonal preference or musical background), it was possible to find the universal within-group representation of music processing with enough accuracy for a successful classification. Furthermore, it could be assumed that bottom-up mechanisms (low-level acoustic features) would be mainly driving within-group representations of music. Conversely to this, we observed that two top-down features, namely Key Clarity and Pulse Clarity, were driving within-group representations in musicians and nonmusicians, respectively.
Conclusions
We demonstrated the feasibility to decode musicianship class from how individual brains listen to real music, attaining a classification performance comparable to current state-of-the-art results in other classification tasks, including patients’ classifications. Additionally, we found that, amongst all musical dimensions used, high-level (tonal and rhythmical) features (i.e., Key and Pulse Clarity) yielded the highest discriminative power followed by low-level (timbral) features. The processing of these high-level percepts would seem to be most influenced by lis-teners’ previous musical exposure and experience. Furthermore, the discriminative brain substrate in relation to tonality and rhythm was the rSTG, consistent with the auditory right-hemispheric asymmetry underlying music processing found in previous work.
The present work provides a framework for identifying core regions in music processing affected by musical training. It reveals the existence of musicianship-specific representations of music processing during realistic lis-tening, demonstrating the potential of naturalistic settings in combination with fMRI measures for brain-reading paradigms. At the same time, this approach advances the study of demographic decoding in the field of brain imaging in general. Future directions will benefit from the inclusion of additional musical stimuli and a larger
participant pool, which can include different types of musicians. This could potentially reveal aspects of the spec-ificity of instrument-driven plasticity.
In this approach, it was possible for the decoder to categorize participants into classes by efficiently extracting the information present in coarse activation patterns, averaged over large anatomical areas, that do not necessary reflect functional demarcations. Such coarse parcellation of the brain represents one limitation of the present approach, whereby voxel activity was averaged across 116 anatomical regions (according to the AAL atlas68). This was required in initial stages of the approach to reduce the dimensionality of the fMRI data beneficial to trading off between overfitting and generalization, while at the same time reducing the computational load. In the future, more subtle distinctions between classes could be inferred by using a more refined parcellation of the anatomi-cal brain volume. Such a finer-grained approach could potentially reveal subtle functional differences observed within the regions herein investigated. Another possibility could be to use group-wise parcellations derived in a data-driven manner by means of e.g., Independent Component Analysis (ICA)69. According to this, different par-cels could be obtained that delineate clear changes in the functional connectivity profile. This has the additional advantage of providing rich information regarding the hierarchical structure of the functional organization of the brain, which may lead to an increased decoding accuracy. One option would also be to focus on particular areas of the brain such as frontal and temporal lobes and select regions from those areas prior to the modeling process. The novelty of this decoding approach is the integration of MIR, namely computational acoustic feature extraction, with functional neuroimaging measures obtained in a realistic music-listening environment. Thus, it represents a significant contribution that complements recent brain-reading methods to decode stimulus infor-mation from brain activity in realistic conditions in the auditory and visual domains70,71. Based on their weight distributions, the most critical brain regions for discriminating between musicianship class were the rSTG (locus of the auditory cortex), rIFCoper (locus of the right Broca’s area), and bilateral ACG (a key node in the sali-ence network). Because these areas were crucial in decoding class-specific hemodynamic responses, they can be regarded as core structures in music processing which are most affected by intensive, lifelong musical training.
Methods
Participants.
The participant pool consisted of 18 musicians and 18 nonmusicians, comprising groups com-parable with respect to gender, age distribution, cognitive measures (Processing Speed and Working Memory Index Scores from the WAIS-WMS III72), and socioeconomic status (Hollingshead’s Four-Factor Index73). The pool is the same as in several previous studies11,13,25,26. The participants were labeled as musicians or nonmusicians based on self-reports and information obtained with questionnaires, included in Helsinki Inventory of Music and Affective Behaviors (HIMAB)74. Those labeled as nonmusicians were required to have less than 5 years of music training, hold no official music degree, to not identify themselves as musicians, and to not have earned money for playing. The musician group was homogeneous in terms of the duration of their musical training, onset age of instrument practice, and amount of years of active instrument playing. Musicians’ main instruments were strings (n = 7), piano (n = 8), wind (n = 2), and mixed (n = 1). For details, see Table 3).Musical Stimuli.
Three non-vocal musical pieces were used as stimuli in the experiment:DreamTheater Petrucci, J., Myung, J., Rudess, J. & Portnoy, M. (2003). Stream of Consciousness (instrumen-tal). [Recorded by Dream Theater]. On Train of Thought [CD]. Elektra Records. (2003); Spotify link: http://open. spotify.com/track/3TG1GHK82boR3aUDEpZA5f; Excerpt: 0–07:50.979.
Piazzolla Piazzolla, A. (1959). AdiÓs Nonino. [Recorded by Astor Piazzolla y su Sexteto]. On The Lausanne
Concert [CD]. BMG Music. (1993); Spotify link: http://open.spotify.com/track/6x5SzbloyesrQQb3Ht4Ojx; Excerpt: 0–08:07.968.
Stravinsky Stravinsky, I. (1947). The Rite of Spring (revised version for Orchestra) Part I: The Adoration of The Earth (Introduction, The Augurs of Spring: Dances of the Young Girls, Ritual of Abduction). [Recorded by Orchestra of the Kirov Opera, St. Petersburg - Valery Gergiev]. On Stravinsky: The Rite of Spring/Scriabin: The
Poem of Ecstasy [CD]. Philips. (2001); Spotify link: http://open.spotify.com/album/22LYJ9orjaJOPi8xl4ZQSq
(first three tracks); Excerpts: 00:05–03:23, 0–03:12, 0–01:16 - total duration: 07:47.243.
These stimuli, each about 8 min in duration, cover three distinct genres of progressive rock, Argentinian tango, and 20th century classical music, respectively.
Experimental Procedure.
Participants’ brain responses were acquired using fMRI while they listened to three musical stimuli in a counterbalanced order. For each participant, the stimuli loudness was adjusted to a comfortable but audible level inside the scanner room (around 75 dB). In the scanner, participants’ task was to attentively listen to the music delivered via high-quality MR-compatible insert earphones while keeping their eyes open. Moreover, participants were instructed that after listening they would be asked some questions about the musical pieces heard. This task was aimed at obtaining affective ratings on the music and keeping the atten-tion focused on listening (for an analysis of fMRI data combined with affective ratings, see Alluri et al.25). Thegroup N age gender hand soc-eco status WAIS-III PSI music listening (h/week) musical training (years) instrument playing (years)
Mus 18 28.2±7.8 9F 18R 43.6 116.3 18.2±11.2 15±4.7 21.2±6.2
NMus 18 29.2±10.7 10F 17R 35.4 115.7 12.4±6.7 1.6±2.2 (n = 8) 2.1±3.0 (n = 9)
participants also reported their familiarity with the musical stimuli used in the experiment on a scale from one (not familiar) to five (very familiar). After averaging each participant’s familiarity rating across the stimuli, musi-cians showed higher familiarity with the stimuli (Mean = 2.96, STD = 1.21) than nonmusimusi-cians (Mean = 2.07, STD = 1.03). We took this factor into account in the decoder evaluation. The fMRI data employed in the current study has been used previously11,13,25,26.
All experimental procedures, part of a broader project called “Tunteet” initiated and coordinated by E.B., were approved by the Coordinating Ethics Committee of the Hospital District of Helsinki and Uusimaa. All procedures were conducted in agreement with the ethical principles of the Declaration of Helsinki. All participants signed an informed consent on arrival to the laboratory and received compensation for their time.
fMRI Scanning and Preprocessing.
A 3T MAGNETOM Skyra whole-body scanner (Siemens Healthcare, Erlangen, Germany) and a standard 20-channel head-neck coil was used to acquire single-shot gradient echo planar images (EPI) every two seconds (33 oblique slices, field of view = 192 × 192 mm; 64 × 64 matrix; slice thickness = 4 mm, interslice skip = 0 mm; echo time = 32 ms; flip angle = 75°), providing a whole-brain cover-age. T1-weighted structural images (176 slices; field of view = 256 × 256 mm; matrix = 256 × 256; slice thick-ness = 1 mm; interslice skip = 0 mm; pulse sequence = MPRAGE) were collected for individual coregistration.Functional MRI scans were preprocessed using SPM8 (Statistical Parametric Mapping) and VBM5 for SPM. For each participant, the images were realigned, spatially normalized into the Montreal Neurological Institute template (12 parameter affine model, segmentation: gray matter, white matter, and cerebrospinal fluid; realign-ment: translation components <2 mm, rotation components <2°), and spatially smoothed (Gaussian filter with FWHM of 8 mm). Movement-related variance (based on three translation and three rotation components) in the fMRI time series were regressed out from each voxel time series to minimize motion artefacts. Following this, the data was detrended using spline interpolation and temporally smoothed using a Gaussian kernel with a width of 4 s.
In the present study, in order to reduce the computational load, decoding model complexity, and overfitting issues in decoding model training, dimensionality of the fMRI data was reduced. The data was parcellated into 116 whole brain anatomical regions based on the Automated Anatomical Labeling (AAL) atlas68 by averaging the time-series over all voxels within each region.
Musical Feature Extraction.
We used the approach implemented by Alluri et al. for musical feature extraction1. Frame-based features related to timbre (20 features; frame length = 25 ms; overlap = 50%), rhythm (3 features; frame length = 3 s; overlap = 67%), and tonality (2 features; frame length = 3 s; overlap = 67%) were extracted from the stimuli using the MIR Toolbox3. The resulting feature time-series were made compatible with the fMRI data by a series of processing stages. The features were convolved with a double-gamma hemodynamic response function (peak = 5 s; undershoot = 15 s) and detrended similarly to the fMRI data. The obtained features were then downsampled to match the sampling rate of the fMRI scans. Finally, the features were mapped to six varimax-rotated principal components that were defined and perceptually validated by Alluri et al.1.The following lists the musical features and the respective maximum feature loadings. Fullness: spectral fluc-tuations at low frequencies (50–200 Hz); Brightness: spectral rolloff (right-skewedness of the power spectrum) and spectral centroid; Activity: the degree of roughness (i.e., sensory dissonance) and spectral fluctuations at the high frequencies (above 1600 Hz); Timbral Complexity: flattness of the sound spectrum; Pulse Clarity: the strength of rhythmic periodicities sound, representing how easily the underlying pulsation in music can be per-ceived. Key Clarity: the strength of the estimated key, computed as the maximum of cross-correlations between the chromagram extracted from the music and tonality profiles representing all the possible key candidates.
The timbral features (Fullness, Brightness, Activity, and Timbral Complexity) represent low-level percepts as they depend on early perceptual processing mechanisms, whereas Pulse and Key Clarity represent high-level percepts, requiring knowledge based on our previous exposure to music.
Decoding Approach.
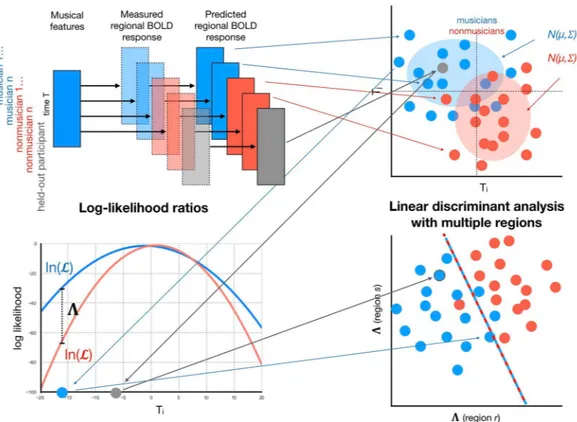
The purpose of the decoding approach is to automatically detect discriminative neural processing patterns of musical features between musician and nonmusician classes, enabling one to use those patterns to classify a participant not used in the model training into either class with a specific statistical certainty. The decoder training involves multiple stages, outlined in Fig. 4: participant-specific region time series encoding with linear regression, statistical musicianship group modeling with multivariate normal distributions, feature extraction with log-likelihood ratios between groups, and final classification. Moreover, region selection was employed to reduce the dimensionality of the data while retaining those regions most effective for discrimination. In the following, we formally describe the stages of the automated decoding process.Separately for each region, we consider two hypotheses HM: a participant belongs to the musician group M;
and HN: participant belongs to the nonmusician group N. The contributions of the musical features to each
par-ticipant’s region activations are estimated by linear regression
β
≈
y X , (1)
where X is a matrix composed of z-score transformed length k musical feature time series, y is a z-score trans-formed BOLD time series of a region, and β is the matrix of the standardized coefficients, estimated for each par-ticipant separately. The resulting approximation of y can then be represented in a k-dimensional vector space as
= ... ∈
ˆ yˆ yˆ
y ( , k) k, (2)
where k denotes the number of time points. These signals are then treated as joint Gaussian random vectors in that space. In the following, G ∈ {M, N} denotes either the musician or the nonmusician group, and the modeling stages are employed similarly for both groups. To test the hypotheses HG, the distributions of the vectors for the
musician and nonmusician groups are modeled as multivariate normal distributions by including the participants in the respective groups:
µ
∼ Σ
ˆyG ( ,G G), (3)
where µG=(µG, ,... µ )
kG
1 is a vector consisting of the mean for each time point, and Σ =G σij2 is the covariance
matrix between time points i and j (i, j ∈ [1, …, k])). We assume that ΣG is a diagonal matrix so that the compo-nents of the random vector are independent. This is potentially a simplistic assumption since serial correlation in the means and variances might be present. However, using a full covariance matrix, although it might improve the results, would require fitting too many model parameters compared to the size of the data.
Given a group model, the log-likelihood for each participant’s predicted region time series is obtained by
= − |Σ | + yˆ−µ Σ − yˆ −µ +k π
ln( ) 1
2(ln( ) ( ) ( ) ( ) ln(2 )), (4)
G G G T G 1 G
where T indicates the matrix transpose. To estimate how likely a participant’s data fits the musician group com-pared to nonmusician group, the log-likelihood ratio is computed:
Λ = ln( M)− ln( )N . (5)
The process is repeated for each region and the log-likelihood ratios are used as features for multivariate clas-sification to jointly predict a participant as a musician or a nonmusician.
In general, a high ratio between the number of predictors (regions) and the number of samples (participants) tends to decrease the generalization of a classifier due to overfitting. In the present study, the number of avail-able regions exceeds the number of participants, which is why region selection was employed prior to classifi-cation. Ranking-based subset selection was employed, wherein the regions were ranked according to how well
Figure 4. Different stages of the decoder training: participant-specific region time series encoding with linear
regression, statistical musicianship group modeling with multivariate normal distributions, feature extraction with log-likelihood ratios between groups; and classification. The first three stages are employed for multiple regions, and classicifation is done based on the obtained features related to these regions. The region selection stage is excluded in the visualization. An example participant held out from the decoder training, shown in grey, is classified as a musician.
the participants’ data fit the correct groups. This is estimated by taking the sum of log likelihoods for the correct groups across the participants:
∑
+∑
∈ ln( )
∈ ln( )
, (6) p M p M p N p N where ln (M) and ln ( )N are the log-likelihoods for the musician and nonmusician groups, respectively. A
spec-ified number of top ranked regions was included from the ranked list of regions. The number of top ranked regions is considered here as a hyperparameter and its effect on classification performance is investigated.
Linear Discriminant Analysis (LDA) with singular value decomposition as solver (threshold 1.0e-4 use for for rank estimation) was used for the final classification. LDA was chosen as the classifier due to its simplicity and efficiency at handling linearly separable data. Moreover, in initial tests, nonlinear and linear Support Vector Machine models gave worse classification performance.
Linear Discriminant Analysis (LDA) was used to classify the data. LDA was chosen due to its efficiency at handling linearly separable data, and since the LDA model is effectively a simple matrix operation that allows straightforward interpretation.
LDA gives the estimated class for each sample (participant), but the probability that a sample belongs to a particular class can also be computed using the sigmoid function. In binary classification, the probability for the positive class, corresponding to the musician group in the present paper, can be computed by
= + − P e 1 1 d, (7)
where d is the signed distance of a sample to the discriminant hyperplane, i.e., the distance is positive, negative, or zero if the sample is on the side of the positive or the negative class, or on the hyperplane, respectively.
To estimate the decoder performance on participants not used in decoder training, Eqs 1, 4, and 5 were applied on the participants’ data and the trained classifier was employed on the obtained likelihood ratios.
Decoding Experiment.
For the decoding experiment, the six musical features and each participant’s brain responses for the three musical stimuli were concatenated to obtain a general non-genre-specific stimulus with a total of ~24 minutes of data.To estimate the accuracy of the decoder model, performance evaluation was conducted using 18-fold stratified cross-validation, where at each fold, one musician and one nonmusician were held out from the decoder training stages. The cross-validation was run ten times, each time on a different random split of the participants’ data. The decoder was trained and tested with different numbers of top regions, ranging from one to 116 (the number of regions in the AAL atlas).
Data availability.
The preprocessed, region-averaged BOLD data, preprocessed musical feature data, and participant musicianship and familiary information analyzed during the current study are available as supple-mentary material.References
1. Alluri, V. et al. Large-scale brain networks emerge from dynamic processing of musical timbre key and rhythm. NeuroImage 59, 3677–3689 (2012).
2. Muller, M., Ellis, D. P. W., Klapuri, A. & Richard, G. Signal Processing for Music Analysis. IEEE Journal of Selected Topics in Signal
Processing 5, 1088–1110 (2011).
3. Lartillot, O. & Toiviainen, P. A matlab toolbox for musical feature extraction from audio. In International Conference on Digital
Audio Effects, 237–244 (2007).
4. Saari, P. et al. Genre-adaptive semantic computing and audio-based modelling for music mood annotation. IEEE Transactions on
Affective Computing 7, 122–135 (2016).
5. Naselaris, T., Kay, K. N., Nishimoto, S. & Gallant, J. L. Encoding and decoding in fMRI. NeuroImage 56, 400–410 (2011). 6. Sturm, I., Dähne, S., Blankertz, B. & Curio, G. Multi-variate eeg analysis as a novel tool to examine brain responses to naturalistic
music stimuli. PloS one 10, e0141281 (2015).
7. Cong, F. et al. Linking brain responses to naturalistic music through analysis of ongoing eeg and stimulus features. IEEE Transactions
on Multimedia 15, 1060–1069 (2013).
8. Jäncke, L., Kühnis, J., Rogenmoser, L. & Elmer, S. Time course of eeg oscillations during repeated listening of a well-known aria.
Frontiers in human neuroscience 9, 401 (2015).
9. Alluri, V. et al. From Vivaldi to Beatles and back: Predicting lateralized brain responses to music. NeuroImage 83, 627–636 (2013). 10. Toiviainen, P., Alluri, V., Brattico, E., Wallentin, M. & Vuust, P. Capturing the musical brain with Lasso: Dynamic decoding of
musical features from fMRI data. NeuroImage 88, 170–180 (2014).
11. Burunat, I., Tsatsishvili, V., Toiviainen, P. & Brattico, E. Coupling of action-perception brain networks during musical pulse processing: Evidence from region-of-interest-based independent component analysis. Frontiers in Human Neuroscience 11, 230 (2017).
12. Hyde, K. L. et al. Musical Training Shapes Structural Brain Development. Journal of Neuroscience 29, 3019–3025 (2009).
13. Burunat, I. et al. Action in Perception: Prominent Visuo-Motor Functional Symmetry in Musicians during Music Listening. PLOS
ONE 10, e0138238 (2015).
14. Lourenco, F. & Casey, B. Adjusting behavior to changing environmental demands with development. Neuroscience & Biobehavioral
Reviews 37, 2233–2242 (2013).
15. Kraus, N. & Chandrasekaran, B. Music training for the development of auditory skills. Nature Reviews Neuroscience 11, 599–605 (2010).
16. Schlaug, G., Jäncke, L., Huang, Y., Staiger, J. F. & Steinmetz, H. Increased corpus callosum size in musicians. Neuropsychologia 33, 1047–1055 (1995).
17. Chen, J. L., Penhune, V. B. & Zatorre, R. J. Moving on time: brain network for auditory-motor synchronization is modulated by rhythm complexity and musical training. Journal of cognitive neuroscience 20, 226–239 (2008).
18. Grahn, J. A. & Rowe, J. B. Feeling the beat: premotor and striatal interactions in musicians and nonmusicians during beat perception.
Journal of Neuroscience 29, 7540–7548 (2009).
19. Herholz, S. C., Boh, B. & Pantev, C. Musical training modulates encoding of higher-order regularities in the auditory cortex.
European Journal of Neuroscience 34, 524–529 (2011).
20. Arbabshirani, M. R., Plis, S., Sui, J. & Calhoun, V. D. Single subject prediction of brain disorders in neuroimaging: Promises and pitfalls. NeuroImage 145(Part B), 137–165 (2017).
21. Orrú, G., Pettersson-Yeo, W., Marquand, A., Sartori, G. & Mechelli, A. Using support vector machine to identify imaging biomarkers of neurological and psychiatric disease: a critical review. Neuroscience & Biobehavioral Reviews 36, 1140–1152 (2012).
22. Klöppel, S. et al. Diagnostic neuroimaging across diseases. NeuroImage 61, 457–463 (2012).
23. Rosa, M. J. et al. Sparse network-based models for patient classification using fMRI. NeuroImage 105, 493–506 (2015).
24. Abi-Dargham, A. & Horga, G. The search for imaging biomarkers in psychiatric disorders. Nature Medicine 22, 1248–1255 (2016). 25. Alluri, V. et al. Musical expertise modulates functional connectivity of limbic regions during continuous music listening.
Psychomusicology: Music, Mind, and Brain 25, 443 (2015).
26. Alluri, V. et al. Connectivity patterns during music listening: Evidence for action-based processing in musicians. Human Brain
Mapping 38, 2955–2970 (2017).
27. Chu, C. et al. Utilizing temporal information in fmri decoding: Classifier using kernel regression methods. NeuroImage 58, 560–571 (2011).
28. Mourao-Miranda, J., Ecker, C., Sato, J. R. & Brammer, M. Dynamic changes in the mental rotation network revealed by pattern recognition analysis of fmri data. Journal of Cognitive Neuroscience 21, 890–904 (2009).
29. Luo, C. et al. Musical training induces functional plasticity in perceptual and motor networks: insights from resting-state fmri. PLoS
one 7, e36568 (2012).
30. Klein, C., Liem, F., Hänggi, J., Elmer, S. & Jäncke, L. The “silent” imprint of musical training. Human brain mapping 37, 536–546 (2016).
31. Gebel, B., Braun, C., Kaza, E., Altenmüller, E. & Lotze, M. Instrument specific brain activation in sensorimotor and auditory representation in musicians. Neuroimage 74, 37–44 (2013).
32. Schlaug, G. Musicians and music making as a model for the study of brain plasticity. Progress in brain research 217, 37–55 (2015). 33. Palomar-Garca, M.-Á., Zatorre, R. J., Ventura-Campos, N., Bueichekú, E. & Ávila, C. Modulation of functional connectivity in
auditory–motor networks in musicians compared with nonmusicians. Cerebral Cortex 27, 2768–2778 (2016).
34. Chieffo, R. et al. Motor cortical plasticity to training started in childhood: The example of piano players. PloS one 11, e0157952 (2016).
35. Bailey, J. A., Zatorre, R. J. & Penhune, V. B. Early musical training is linked to gray matter structure in the ventral premotor cortex and auditory–motor rhythm synchronization performance. Journal of cognitive neuroscience 26, 755–767 (2014).
36. Vollmann, H. et al. Instrument specific use-dependent plasticity shapes the anatomical properties of the corpus callosum: a comparison between musicians and non-musicians. Frontiers in behavioral neuroscience 8 (2014).
37. Menon, V. & Uddin, L. Q. Saliency, switching, attention and control: a network model of insula function. Brain Structure and
Function 214, 655–667 (2010).
38. Seeley, W. W. et al. Dissociable intrinsic connectivity networks for salience processing and executive control. Journal of Neuroscience
27, 2349–2356 (2007).
39. Yarkoni, T., Poldrack, R. A., Nichols, T. E., Van Essen, D. C. & Wager, T. D. Large-scale automated synthesis of human functional neuroimaging data. Nat Meth 8, 665–670 (2011).
40. Crottaz-Herbette, S. & Menon, V. Where and when the anterior cingulate cortex modulates attentional response: combined fMRI and ERP evidence. Journal of cognitive neuroscience 18, 766–80 (2006).
41. Bush, G., Luu, P. & Posner, M. I. Cognitive and emotional influences in anterior cingulate cortex. Trends in cognitive sciences 4, 215–222 (2000).
42. Pallesen, K. J. et al. Cognitive control in auditory working memory is enhanced in musicians. PloS one 5, e11120 (2010).
43. Pecenka, N., Engel, A. & Keller, P. E. Neural correlates of auditory temporal predictions during sensorimotor synchronization.
Frontiers in human neuroscience 7, 380 (2013).
44. Brown, S. & Martinez, M. J. Activation of premotor vocal areas during musical discrimination. Brain and Cognition 63, 59–69 (2007).
45. Ardila, A., Bernal, B. & Rosselli, M. How Localized are Language Brain Areas? A Review of Brodmann Areas Involvement in Oral Language. Archives of Clinical Neuropsychology 31, 112–122 (2016).
46. Koelsch, S., Fritz, T., Schulze, K., Alsop, D. & Schlaug, G. Adults and children processing music: an fMRI study. NeuroImage 25, 1068–76 (2005).
47. Tillmann, B. et al. Cognitive priming in sung and instrumental music: Activation of inferior frontal cortex. NeuroImage 31, 1771–1782 (2006).
48. Janata, P., Tillmann, B. & Bharucha, J. J. Listening to polyphonic music recruits domain-general attention and working memory circuits. Cognitive, affective & behavioral neuroscience 2, 121–140 (2002).
49. Burunat, I., Alluri, V., Toiviainen, P., Numminen, J. & Brattico, E. Dynamics of brain activity underlying working memory for music in a naturalistic condition. Cortex 57, 254–269 (2014).
50. Brown, S., Martinez, M. J. & Parsons, L. M. Music and language side by side in the brain: A PET study of the generation of melodies and sentences. European Journal of Neuroscience 23, 2791–2803 (2006).
51. Koelsch, S., Fritz, T., V Cramon, D. Y., Müller, K. & Friederici, A. D. Investigating emotion with music: an fMRI study. Human brain
mapping 27, 239–50 (2006).
52. Tervaniemi, M. & Hugdahl, K. Lateralization of auditory-cortex functions. Brain Research Reviews 43, 231–246 (2003).
53. Zatorre, R. J., Belin, P. & Penhune, V. B. Structure and function of auditory cortex: Music and speech. Trends in Cognitive Sciences 6, 37–46 (2002).
54. Watson, A. H. D. What can studying musicians tell us about motor control of the hand? Journal of Anatomy 208, 527–542 (2006). 55. Cutica, I., Bucciarelli, M. & Bara, B. G. Neuropragmatics: Extralinguistic pragmatic ability is better preserved in
left-hemisphere-damaged patients than in right-hemisphere-left-hemisphere-damaged patients. Brain and language 98, 12–25 (2006).
56. Murayama, J., Kashiwagi, T., Kashiwagi, A. & Mimura, M. Impaired pitch production and preserved rhythm production in a right brain-damaged patient with amusia. Brain and Cognition 56, 36–42 (2004).
57. Schmithorst, V. J. & Holland, S. K. The effect of musical training on music processing: A functional magnetic resonance imaging study in humans. Neuroscience Letters 348, 65–68 (2003).
58. Meyer, M., Alter, K., Friederici, A. D., Lohmann, G. & von Cramon, D. Y. FMRI reveals brain regions mediating slow prosodic modulations in spoken sentences. Human Brain Mapping 17, 73–88 (2002).
59. Angulo-Perkins, A. & Concha, L. Music perception: information flow within the human auditory cortices. In Neurobiology of
Interval Timing, 293–303 (Springer, 2014).
60. Grahn, J. A. & Brett, M. Rhythm and beat perception in motor areas of the brain. Journal of cognitive neuroscience 19, 893–906 (2007).
61. Burunat, I. et al. The reliability of continuous brain responses during naturalistic listening to music. NeuroImage 124, 224–231 (2016).
62. Proverbio, A. M., Orlandi, A. & Pisanu, F. Brain processing of consonance/dissonance in musicians and controls: a hemispheric asymmetry revisited. European Journal of Neuroscience 44, 2340–2356 (2016).
63. Thaut, M. H., Demartin, M. & Sanes, J. N. Brain networks for integrative rhythm formation. PloS one 3, e2312 (2008).
64. Vuilleumier, P. & Trost, W. Music and emotions: from enchantment to entrainment. Annals of the New York Academy of Sciences
1337, 212–222 (2015).
65. Bogert, B. et al. Hidden sources of joy, fear, and sadness: Explicit versus implicit neural processing of musical emotions.
Neuropsychologia 89, 393–402 (2016).
66. Trost, W., Ethofer, T., Zentner, M. & Vuilleumier, P. Mapping Aesthetic Musical Emotions in the Brain. Cerebral Cortex 22, 2769 (2012).
67. Salimpoor, V. N., Benovoy, M., Larcher, K., Dagher, A. & Zatorre, R. J. Anatomically distinct dopamine release during anticipation and experience of peak emotion to music. Nature neuroscience 14, 257–262 (2011).
68. Tzourio-Mazoyer, N. et al. Automated Anatomical Labeling of Activations in SPM Using a Macroscopic Anatomical Parcellation of the MNI MRI Single-Subject Brain. NeuroImage 15, 273–289 (2002).
69. McKeown, M. J. & Sejnowski, T. J. Independent component analysis of fMRI data: Examining the assumptions. Human Brain
Mapping 6, 368–372 (1998).
70. Haynes, J.-D. Decoding visual consciousness from human brain signals. Trends in cognitive sciences 13, 194–202 (2009).
71. Schaefer, R. S., Farquhar, J., Blokland, Y., Sadakata, M. & Desain, P. Name that tune: Decoding music from the listening brain.
NeuroImage 56, 843–849 (2011).
72. Wechsler, D. Wechsler adult intelligence scale–fourth edition (wais–iv). San Antonio, TX: NCS Pearson 22, 498 (2008). 73. Hollingshead, A. B. et al. Four factor index of social status. Unpublished manuscript (1975).
74. Gold, B. P., Frank, M. J., Bogert, B. & Brattico, E. Pleasurable music affects reinforcement learning according to the listener. Frontiers
in psychology 4, 541 (2013).
Acknowledgements
This work was supported by the Academy of Finland (project numbers 272250 and 274037) and the Danish National Research Foundation (project DNRF117). We would like to thank Hella Kastbjerg for proofreading the manuscript.
Author Contributions
P.S. and P.T. conceived the decoding approach. E.B. coordinated the data collection, ethics aspects and experimental protocol, in collaboration with P.T. I.B. preprocessed the fMRI data and the musical features. P.S. analyzed the results and prepared all figures and tables. P.S. and I.B. wrote the main manuscript text. All authors edited and approved the manuscript.
Additional Information
Supplementary information accompanies this paper at https://doi.org/10.1038/s41598-018-19177-5.
Competing Interests: The authors declare that they have no competing interests.
Publisher's note: Springer Nature remains neutral with regard to jurisdictional claims in published maps and
institutional affiliations.
Open Access This article is licensed under a Creative Commons Attribution 4.0 International
License, which permits use, sharing, adaptation, distribution and reproduction in any medium or format, as long as you give appropriate credit to the original author(s) and the source, provide a link to the Cre-ative Commons license, and indicate if changes were made. The images or other third party material in this article are included in the article’s Creative Commons license, unless indicated otherwise in a credit line to the material. If material is not included in the article’s Creative Commons license and your intended use is not per-mitted by statutory regulation or exceeds the perper-mitted use, you will need to obtain permission directly from the copyright holder. To view a copy of this license, visit http://creativecommons.org/licenses/by/4.0/.