DSC and DVS Investigation of Water Mobility in Na
fion/Zeolite
Composite Membranes for Fuel Cell Applications
B. Mecheri,*
,†V. Felice,
‡Z. Zhang,
‡A. D’Epifanio,
†S. Licoccia,*
,†and A. C. Tavares
‡†Department of Chemical Science and Technology & NAST Centre, University of Rome“Tor Vergata”, Via della Ricerca Scientifica,
00133 Rome, Italy
‡Institut National de la Recherche Scientifique - Énergie Matériaux Télécommunications (INRS-EMT), 1650 Boulevard Lionel
Boulet, Varennes, QC, J3× 1S2, Canada
ABSTRACT: Nafion/Faujasite zeolite composite membranes have been prepared by solution casting at a zeolite content ranging from 0.98 to 21.4 wt %. The effect of the zeolite loading on the mobility of both liquid and vapor water through the Nafion membrane has been investigated by using two complementary techniques, that is, differential scanning calorimetry and dynamic vapor sorption. The relationship between water mobility, proton conductivity, and direct methanol fuel cell (DMFC) performance of composites is also discussed. The addition of zeolite contributes to the enhancement of the water mobility degree in the composite membrane due to both the
surface composition of the additive and the introduction of porosity at the polymer/filler interface. Nafion/zeolite composites having higher proton conductivity and DMFC performance than bare Nafion can thus be fabricated by fine-tuning of the additive content and the membrane morphology.
1. INTRODUCTION
Over the past decade, proton exchange membrane fuel cell (PEMFC) and direct methanol fuel cell (DMFC) technologies have experienced important advances due to the extensive research in thefields of materials chemistry and engineering.1−3 Nafion is still the most widely used electrolyte for commercial applications despite major limits such as low proton conductivity above 90 °C or low relative humidity4 and methanol crossover from the anode to the cathode due to the high diffusivity of methanol through Nafion membranes.5,6 Several approaches have been followed to overcome these limitations and thus to improve the performance of PEMFCs and DMFCs, including the preparation of composites based on Nafion and inorganic solids. The composite strategy has been demonstrated to be effective in improving the dimensional stability of the Nafion membrane, thus stabilizing its conductivity at T > 90 °C and decreasing methanol crossover.7,8Zeolites, with their unique chemical and structural properties, have been recognized to be suitable for many applications in different areas, from catalysis, to gas sensing, to water purification and separation.9−11The chemical composi-tion of a zeolite is expressed as the Si/Al ratio, the presence of aluminum being responsible for its surface acidity and hydrophilicity. Owing to the presence of mobile cations relatively free to move along the cavities of the framework, zeolites are also characterized by ion conductivity. The high porosity of zeolites also results in a high water sorption capacity, further facilitating ion transport.12,13
Different types of zeolites, such as Mordenite,14,15Chabazite, Clinoptilolite,16,17 Faujasite,18,19 or H-ZSM-520,21 have been
used as additives to Nafion. The resulting composite membranes have been found to reduce methanol crossover, but this effect has not always led to the desired improvement in the PEMFC and DMFC performance because the proton conductivity of the composite membranes was often lower than that of the unfilled Nafion membrane. Although some studies have been reported on the effect of zeolite particle size in the proton transport process in Nafion/zeolite composites,22−24 little is known about the effect of zeolites on the nature of water at the Nafion/zeolite interface region, which is also expected to be strongly involved in water mobility, diffusion, permeation, as well as proton conductivity. Hence, new insight into water states and water mobility in Nafion/zeolite composites appears to be of great importance.
We have previously reported on the preparation and characterization of Nafion/Faujasite zeolite composite mem-branes in terms of structure, ion exchange capacity, and proton conductivity.19 We have now extended our investigations, studying in detail the effect of the zeolite loading in terms of mobility of both liquid and vapor water through the Nafion membrane. This study was carried out through the inves-tigation of the states of water in the composite membranes by combining two independent and complementary techniques, that is, differential scanning calorimetry (DSC) and dynamic vapor sorption (DVS). The discrimination between the different states of water has been traditionally performed by
Received: February 22, 2012
Revised: July 26, 2012
Published: September 6, 2012
DSC25,26 and to a lesser extent by FTIR,27,28 NMR,29,30 and dielectric relaxation spectroscopy.31 To the best of our knowledge, this article represents the first combined use of DSC and DVS to examine the water mobility degree in Na fion-based composite membranes. The presence of differently mobile types of water (freezable, specifically or nonspecifically absorbed, and clustered) was analyzed in terms of θ, a parameter describing the fraction of a specific type of water with respect to the total WU of a membrane.
Analysis of theθ parameters as a function of zeolite content in the membrane allowed the selection of the optimal composites. Their DMFC performance was tested and compared with that of reference unfilled Nafion.
2. EXPERIMENTAL SECTION
2.1. Materials. CBV780 Faujasite zeolite powder was purchased by Zeolyst International and previously character-ized19in terms of Si/Al molar ratio (48.7), particle size (0.5 to 1 μm), specific surface area (823 m2 g−1), and pore volume (0.539 ccg−1). DE2021 Nafion polymer dispersions (20 wt %) were obtained by Ion Power.
Composite membranes were prepared according to our published procedure.19 In brief, the proper amount of zeolite was added to the Nafion dispersion together with 25 wt % of isopropanol (Sigma-Aldrich). The suspension was stirred for 30 min and placed in an ultrasonic bath for 30 min. After casting the mixture in a Petri dish and allowing the solvent to evaporate at 50°C for 5 to 6 h, thermal treatments at 100 °C overnight and at 140°C for 1 day were carried out. The membranes were then peeled off from the glass plate. A second series of composite membranes was obtained by additionally hot pressing them the membranes at 140°C under a pressure of 227 kg cm−2 for 40 s. Unfilled Nafion membranes were also prepared and used as reference. The thickness of the membranes ranged between 145 and 165μm.
Before characterization, Nafion membranes were activated by boiling them for 1 h in 3 vol % H2O2solution, 1 h in deionized water, and 1 h in 1.2 M H2SO4, after which they were carefully washed and stored in deionized water.
Table 1 reports the list of membrane samples together with their labeling and zeolite content.
2.2. Methods. Water uptake measurements from liquid phase were carried out on membrane discs that were dried at 80 °C for 2 h in a vacuum oven and weighed (md). They were immersed in distilled water at room temperature for 24 h, then
dried with adsorbent paper and weighted (mw). Weight percentage WU values were calculated using eq 119
= m −m ×
m
WU (wt %) w d 100
d (1)
The ratio between the volume occupied by water and total volume of the swollen membrane, defined as water porosity (ε), was calculated by weight measurements using eq 2
ε δ = − · · × m m S d (%) w d 100 H O2 (2)
where mw and md are weights of the membrane at the equilibrium, wet, and dry state, respectively; S and δ are area and thickness of the membrane in the wet state; and dH2Ois density of water.32The uncertainty ofε values is ±2%.
Cross-section micrographs of the membranes were obtained using a JEOL JSM-6300F scanning electron microscope (SEM). A carbonfilm was sputtered on the membranes using a carbon IFfilament unit prior to SEM observations. The cross sections were obtained by fracturing the membranes in liquid nitrogen.
Differential scanning calorimetry (DSC) measurements were carried out using a DSC 7 Perkin-Elmer instrument. After being equilibrated in liquid water at 25 °C for at least 24 h, the samples were blotted with adsorbent paper and quickly sealed in aluminum DSC pans. In a typical run, 20 mg of sample (2 membrane disks of 6 mm in diameter) was cooled from 25 to −50 °C, then heated from −50 to 10 °C at 10 °C min−1, under N2 flow (20 mL min−1). The presented DSC data are the average values of quadruplicate analyses on different disks of the same sample. The percentage amounts of WF in the membranes were determined by direct integration and normalization of the DSC endothermic ice-melting profile of the membrane sample.19The percentage amount of freezable water (WF) was calculated, according to the eq 319,33,34
= Δ Δ × × W H H m 1 100 F m ice d (3)
where ΔHm was obtained by the integration of DSC melting peak and mdis the mass of dry membrane.ΔHiceis the entalphy of water melting, corrected for the subzero melting point according to the following equation
ΔHice= ΔHice0 − ΔCpΔT (4)
whereΔHice0 is entalphy of water melting at 0°C (333 J g−1), ΔCpis the specific heat capacity difference between liquid water and ice, and ΔT is the melting point depression. The uncertainty of WFdata is±3%.
DVS experiments were performed using a DVS high-throughput apparatus (Surface Measurement Systems, London, U.K.) equipped with a Cahn ultra microbalance with a mass resolution of 10μg. Typically, 10 mg of sample was placed into the DVS-HT pans and dried under a stream of dry N2at 25°C for 6 h. After that, the temperature was maintained at 25°C, and the sample was exposed to the following water activity (aw) profile: 0 to 0.1 aw(step size: 0.02, step time 3 h), 0.1 to 0.3 aw (step size 0.05, step time 3 h), 0.3 to 0.8 aw(step size 0.1, step time 3 h), and 0.9 to 0.97 (step time 6 h). The water amount per mass unit of dry membrane at each aw stage was obtained by measuring the change in mass with respect to the dry mass. Direct methanol fuel cell (DMFC) tests were performed using commercial Electrochem electrodes. The anode catalyst Table 1. List of Membrane Samples Together with Their
Labeling, Zeolite Content, Post-Treatment,andε Parameter
membrane zeolite content/wt % post-treatment ε/% N_0 0 as prepared (AP) 41 N_0_HP 0 hot pressing (HP) 39 NZ_1 0.98 AP 52 NZ_1_HP 0.98 HP 40 NZ_2 1.40 AP 53 NZ_2_HP 1.40 HP 43 NZ_3 4.42 AP 54 NZ_3_HP 4.42 HP 44 NZ_4 10.1 AP 57 NZ_4_HP 10.1 HP 50 NZ_5 21.4 AP 58 NZ_6_HP 21.4 HP 51
layer contained 3 mg cm−2PtRu (from a 60 wt % PtRu/Vulcan XC-72 catalyst) with 1 mg cm−2 Nafion, and the cathode catalyst layer contained 3 mg cm−2 Pt (from a 60 wt % Pt/ Vulcan XC-72 catalyst) with 1 mg cm−2Nafion. The membrane electrode assembly (MEA) was prepared by sandwiching the membrane samples between anode and cathode under hot pressing at 140°C. The single cells were installed in a fuel cell fixture of 5 cm2 active area and connected to a fuel cell test station (model 850c from Scribner Associates). DMFC tests were carried out at 40°C, with 1 M methanol solution (2.5 mL min−1) fed to the anode chamber and humidified air (220 mL min−1) fed to the cathode. Atmospheric pressure in the anode and cathode compartments was used for all experiments. Electrochemical impedance spectroscopy (EIS) measurements were carried out by galvanostatic impedance technique during cell functioning. The EIS parameters are set up as follows: applied direct current (DC): 0.05 A; amplitude: 5% of DC current; frequency range: 100 kHz to 0.01 Hz.
3. RESULTS AND DISCUSSION
3.1. Differential Scanning Calorimetry: Investigation of Water States and Water Mobility. Figure 1 shows the
water uptake (WU) values from the liquid phase of both as-prepared (AP) and hot-pressed (HP) series of Nafion/zeolite composite membranes as a function of filler content. After a sharp increase in low zeolite content, WU of all samples tends to level off at high filler loading. This behavior is due to the two-fold effect of zeolite. On the one hand, the zeolite ionic character and high water sorption capacity contribute to the increase in WU. On the other hand, the content of sulfonic acid groups of Nafion (which promote water coordination) decreases as thefiller content increases. Overall, this two-fold effect contributes to the leveling off of WU with increasing zeolite content.19
Nevertheless, the morphological changes of the Nafion membrane induced by thefiller presence also have to be taken into account, as demonstrated by the lower WU of the HP with respect to AP samples. Figure 2 shows the SEM micrographs of reference Nafion and composite membrane at highest zeolite content (NZ_5). A porous morphology is observed for the composite membrane, with pores up to the micrometer range at the highest zeolite content. To estimate the contribution of
pores, defects, and voids to WU, the membranes porosity was estimated by weight measurements throughε parameter (Table 1). Water porosity values of bare Nafion membranes are in good agreement with previous literature reports.35 Water porosity values of composite membranes increase with increasing zeolite loading within the two series of samples (AP and HP). The hot pressing treatment reduces the membranes porosity, explaining the lower WU of HP samples compared with that of AP membranes. In fact, the WU process reaches equilibrium when internal osmotic pressure is balanced by the counter-elastic force of the ionomer, larger pore volume providing larger space to keep more water.36
To gain deeper insights into the effect of zeolite on the water transport and mobility through the Nafion membrane, the states of water were investigated by DSC. This technique allows discriminating between freezable and nonfreezable water, the latter being strongly bound to the polymer matrix and yielding no characteristic thermal transition in DSC thermograms. Freezable water (WF) is more mobile and exhibits thermal transitions similar to bulk water.37,38The DSC thermograms of the unfilled Nafion and a typical composite are shown in Figure 3. The samples display a broad endothermic peak
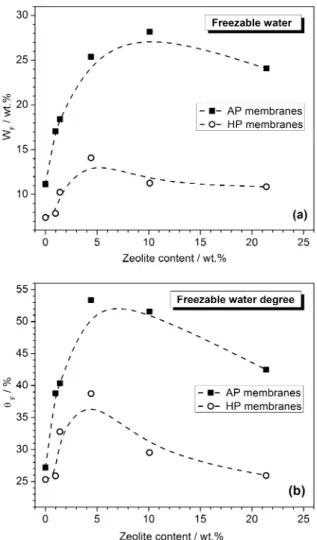
correspond-ing to the meltcorrespond-ing of freezable water in the −30 to 0 °C temperature range. The percentage amounts of WF in the membranes were determined as described in the Experimental Section, and the corresponding values are shown in Figure 4a as a function of zeolite content in the Nafion membrane. For both series (AP and HP), the WFvalues increase withfiller loading up to 4.42 wt % zeolite content. At higher zeolite content, WF reaches a saturation threshold. In the whole range of zeolite
Figure 1. Water uptake values from liquid phase as a function of zeolite content for as-prepared (AP) and hot-pressed (HP) membranes.
Figure 2.Cross-section SEM images of (a) reference Nafion (N_0) and (b) composite membrane at highest zeolite content (NZ_5).
Figure 3.Heating run of typical DSC thermograms of (a) reference Nafion (N_0) and (b) NZ_3 composite membrane.
concentration investigated, the WF values of the HP membranes are always lower than those of the AP membranes due to the reduction of porosity of the membrane, as previously observed in the case of WU.
WU and WFvalues indicate that the zeolite presence leads to an increase not only in the total water content in the Nafion membrane but also in the freezable mobile water. However, the trend of WF against the zeolite content is similar but not identical to that of WU, suggesting that WF and WU do not increase proportionally with zeolite content. To highlight how the zeolites affect the content of freezable water in the Nafion membrane, we defined the degree of freezable water, θF, normalizing the freezable water content to the total WU as follows
θ = W ×
WU
(%) 100
F F (5)
The variation of θF with the membranes composition is reported in Figure 4b. As expected, the hot pressing procedure did not affect θFof the unfilled Nafion membrane because the difference in porosity after hot pressing is negligible. The θF values of AP membranes are always higher than those of HP membranes, as a clear indication of the presence of nonbound water included in the voids of AP composites. After the hot pressing treatment, the presence of this type of water is reduced as a consequence of the reduction of the porosity of the membrane. Finally, for both series, as zeolite content increases,
θF values increase to a maximum value then decrease at the highest zeolite content.
These findings indicate that zeolite contributes to the enhancement of the water mobility degree in the composite membrane due to both its high water sorption capacity and the introduction of porosity at the polymer/filler interface. The reduction of this effect over 4.42 wt % zeolite content, more evident in the case of HP composites, suggests that not all water pores contribute in an efficient way to the water-phase interconnectivity and, therefore, to water mobility. This may be due to the formation of dead-end porosities that contribute to the enhancement of tortuosity of the water paths for composite membranes at high zeolite loading.
3.2. Dynamic Vapor Sorption Investigation of Water States and Water Mobility. Figure 5 shows the water vapor
adsorption isotherm of the Faujasite powder at 25 °C. Water vapor uptake increases with water activity. The high surface area and pore volume of the material explain the high WU at high aw, whereas the surface hydrophylicity of the zeolite particles is responsible of WU at low aw.19
Figure 6 shows the water vapor adsorption isotherms of both series (AP and HP) of Nafion/zeolite composites at 25 °C. All samples display sigmoidal isotherms that can be classified as type II, according to IUPAC classification.39As far as the effect of the zeolite on water adsorption properties of AP composites is concerned, the amount of water in the membrane increases with the additive content in the whole range of awinvestigated. In the case of HP composites, the additive seems to have a negligible effect on water adsorption, all isotherms being superimposed with that of unfilled HP Nafion with the exception of the HP composite at highest zeolite content that displays, at aw> 0.6, higher WU values than those of reference HP Nafion and all other HP composites.
Moreover, the comparison between the adsorption isotherms of AP and HP composites shows that HP composites have lower WU values than those of AP composites in the whole range of aw investigated. Such modifications of the adsorption properties of Nafion membranes due to the faujasite zeolite and hot-pressing treatment indicate that porosity occurring at the polymer/filler interface plays a role in the enhancement of WU from vapor phase.
To examine the role of the zeolite on water vapor transport and mobility through the Nafion membrane, we investigated
Figure 4.WF(a) andθF(b) values as a function of zeolite content for
both as-prepared (AP) and hot-pressed (HP) membranes.
the states of water in vapor phase by DVS. This investigation is based onfitting the water vapor adsorption isotherms with the multimode adsorption model proposed by Park.40According to the model, three different mechanisms can occur in the adsorption process: (i) specific adsorption (described by the Langmuir model) at low water activity, (ii) nonspecific adsorption (described by Henry’s law), and (iii) clustering at high water activity. The three contributions can be formulated as in eq 6 = + + + a K a K a K a nK a WU 1 n L L W L W H w A W (6)
where aLis the specific site capacity, KLis an affinity constant, KH is the Henry’s law coefficient, KA is the aggregation equilibrium constant, and n is the aggregate size.
Park model has been successfully used to describe and interpret water sorption isotherms of different polymer ionomers including Nafion.41−43 A distinct population of water adsorbed in the membrane can be associated to each adsorption mechanism: specific adsorbed water (WSA), non-specific adsorbed water (WNSA), and clustered water (WC). Each water population is described by the terms constituting eq 6, as follows = + W a K a K a 1 SA L L W L W (7) = WNSA K aH w (8) = WC nK aA Wn (9)
The result of a typical curvefitting is displayed in Figure 7 for sample N_0_HP, showing the good match between thefit and
the experimental adsorption data. The adsorbed water was successfully separated into the three contributions, so that the sum of WSA, WNSA, and WCmatched the experimental isotherm data.
Taking into account the fact that each type of adsorbed water is characterized by different mobility, we correlated the different water population to the water mobility degree in the membrane. Being strongly bound to specific sites, the specific adsorbed water is characterized by low mobility, whereas the dissolved water molecules (Henry population) have higher mobility. Then, the growth of water clusters reduces the mobility of the water aggregates. As a consequence, among the three types of water population, the nonspecific adsorbed water is characterized by the highest mobility. The amount of each type of adsorbed water was normalized to the total water content in the membranes, as follows
θ = W × W 100 SA SA TOT (10) θ = W × W 100 NSA NSA TOT (11) θ = W × W 100 C C TOT (12)
Asθ parameters were defined, θSA,θNSA, andθCrepresent the “specific adsorbed water degree”, “nonspecific adsorbed water degree”, and “clustered water degree”, respectively.
The trend of eachθ parameter as a function of water activity is shown in Figure 8 for N_0_HP sample. As expected, θSA decreases as the water activity increases andθNSAincreases as a function of water activity up to aw= 0.6 reaching a maximum, then decreases at higher aw.θCis almost negligible up to aw = 0.6, then suddenly increases, becoming predominant with respect to the other two water populations. In fact, the higher θNSAand the lowerθSAandθC, the greater the water mobility in the membrane is expected to be. Similarly, with the θF
Figure 6. Water vapor adsorption isotherms of Nafion/zeolite composites at 25°C: (a) as-prepared membranes and (b) hot-pressed membranes.
Figure 7.Typical curvefitting (Park’s model) of experimental sorption isotherm data (N_0_HP sample, T = 25°C) and the corresponding fitting parameters. WSA, WNSA, and WCrefer to specific adsorbed water,
parameter extracted from DSC investigations and defined by eq 5,θ parameters allow us to evaluate the water mobility degree in the Nafion/zeolite composite membranes.
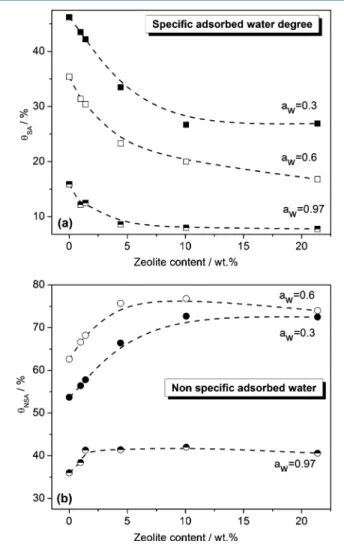
As far as the effect of zeolite on the water mobility through the Nafion membrane is concerned, Figure 9 shows θSA(a) and θNSA (b) as a function of zeolite content in the AP series of
Nafion membranes at three different water activities, that is, aw = 0.3, 0.6, and 0.97. At all aw values, θSA decreases with increasing zeolite content in the membrane almost linearly up to 4.42 wt % zeolite content and levels off beyond this concentration. HighθSAvalues indicate a high concentration of specific sites for water adsorption, that is, sulfonic acid groups of Nafion and hydroxyl groups of zeolite. The decrease in θSA with increasing zeolite content indicates that such specific sites decrease with increasing filler content. As a consequence, it appears evident that the sulfonic acid groups of Nafion are predominant with respect to the hydroxyl groups of the zeolite in the specific adsorption process of water at least up to 4.42 wt % of zeolite content.
At all awvalues,θNSAincreases with zeolite up to 4.42 wt % zeolite content and, at higher zeolite loadings,θNSAreaches a saturation threshold. The opposite trend shown byθNSA and θSA can be attributed to the decrease in the specific sites for specific adsorption of water caused by the zeolite presence resulting in favoring the nonspecific adsorption process. As expected, both θSA and θNSA values for the HP series of composites (data not shown) did not change with respect to those of AP composites, indicating that the hot-pressing procedure did not affect the specific and nonspecific adsorbed water degree.
Figure 10 shows θC as a function of zeolite content in the membranes at aw = 0.6 and 0.97 for both AP and HP
membranes. In the case of AP membranes, the zeolite content does not affect θCat aw= 0.97, which is almost constant around 50%. It is noteworthy that at aw = 0.6 (i.e., the aw values at which the clustering process starts to occur),θCvalues increase with zeolite content, the sample at highest zeolite content (NZ_5 sample) displayingθC= 10%. At higher aw,θCvalues of HP composites are lower than those of AP composites up to 10.1 wt % zeolite content. On the contrary, the sample at highest zeolite content (NZ_5_HP sample) displaysθCvalues higher than the corresponding ones of AP NZ_5 sample.
Such a noteworthy difference between θCvalues of AP and HP composites demonstrates the involvement of the interfacial porosity of the membrane in the clustering process. In fact, the θCbehavior suggests that a highfiller-content-promoted cluster aggregation is due to the introduction of a highly porous material and to the occurrence of interfacial porosity, both favoring the condensation of water. The higher θC value of
Figure 8.Specific adsorbed water degree (θSA), nonspecific adsorbed
water degree (θNSA), and clustered water degree (θC) as a function of
water activity for N_HP sample membrane.
Figure 9.θSA(a) andθNSA(b) as a function of zeolite content in the
membrane (as prepared series) at aw= 0.3, 0.6, and 0.97.
Figure 10.θCas a function of zeolite content at and aw= 0.97 for AP
NZ_5_HP sample with respect to NZ_5 sample suggests the occurrence of residual dead-end porosity after the hot-pressing treatment, whose effect becomes important at high water activity and high zeolite content.
Hence, the behavior of allθ parameters with zeolite content and hot-pressing treatment indicate that, with increasing zeolite content, the equilibrium between the different populations of adsorbed water within the membrane is shifted so that the more mobile water population was predominant due the decreasing of specific sites for water adsorption. At the highest filler concentration, the clustering process is promoted and is dependent on the membrane interfacial porosity, which acts as a water reservoir.
To obtain an exhaustive appreciation of the water vapor mobility through the Nafion membrane, water diffusion coefficients (D) were estimated assuming Fickian diffusion with constant diffusivity. D values in the membranes were estimated from the variation of WU over time at constant aw and byfitting the data to eq 1344,45
π = ∞ ⎛ ⎝ ⎜ ⎞ ⎠ ⎟ D M t M d t ( ) ( ) 16 2 2 (13)
where M(t)/M(∞) is the water mass uptake at time t with respect to the mass uptake at the equilibrium and d is the initial membrane thickness. This equation was applied for values of M(t)/M(∞) < 0.4, where the plot of M(t)/M(∞) against t1/2 was linear.
Figure 11 shows D values of Nafion/zeolite composites as a function of water activity at 25°C for AP membranes. For all
samples, D increases with water content in the membrane at low awand reaches a maximum in the 0.3 to 0.4 awrange. The increase in D in this awrange is due to the fact that water is less tightly associated with the sulfonic acid sites of Nafion as water content increases. At higher water activities, D decreases with increasing aw due to the occurring of a water aggregation process that provides kinetic limitations of the adsorption of water on the polymer matrix. This trend is in good agreement with previous literature dealing with water diffusion through Nafion membranes.41,45−48
Figure 12 shows the diffusion coefficient values of Nafion/ zeolite composites as a function of zeolite content at water
activity 0.3, 0.6, and 0.97 for AP and HP membranes. At aw = 0.3, D values increase almost linearly with increasing zeolite content for both series of membranes. The increased water diffusivity is in good agreement with the concomitant decrease in specific water (θSA) and increase in nonspecific water degree (θNSA) as the filler content increases. At aw = 0.6, D values considerably increase as zeolite content increases up to 4.42 wt %, then level off, and, at aw= 0.97, the D values trend is similar even though the extent of the increase is lower than that in the case of aw= 0.6. This behavior is due to the occurrence of the water clustering process, which starts to become predominant at aw ≥ 0.6 and hinders water mobility at highest zeolite content.
No significant differences emerged between AP and HP composites in terms of D values and trends with zeolite content. The hot-pressing treatment did not affect water diffusivity to a considerable extent with exception of the sample at highest zeolite content (NZ_5_HP), whose D values were lower than those of the AP sample (NZ_5). This exception matches the higherθCvalue of NZ_5_HP sample with respect to NZ_5 sample (Figure 10), which was ascribed to the occurrence of residual dead-end porosities caused by the hot-pressing treatment of the membrane at highest zeolite content. Both θ and D results indicate that the intrinsic porosity of zeolite and the water porosity occurring at the polymer/filler interface has a cardinal role on the water diffusivity through the composites, whereas the surface chemistry of zeolite has an indirect influence resulting in a dilution effect of sulfonic acid groups of Nafion.
3.3. Proton Conductivity and Fuel Cell Performance. Analysis of combined DSC and DVS results are particularly interesting for the application of Nafion/zeolite composites as proton conductor electrolytes in PEMFCs and DMFCs because the presence of water with high mobility increases the mobility of protons. Previous authors have illustrated that proton conductivity is higher for membranes with larger freezable mobile water content (WF).37In terms of water mobility and diffusivity, we noticed a more marked effect of the zeolite content on θF than on WF; therefore, θ might be a more effective parameter for the proper selection of electrolytes for fuel-cell applications. HigherθF values are expected to lead to higher proton conductivity values when samples are in
Figure 11. Diffusion coefficient (D) values of Nafion/zeolite composites as a function of water activity at 25 °C for as prepared membranes.
Figure 12. Diffusion coefficient (D) values of Nafion/zeolite composites as a function of zeolite content at water activity 0.3, 0.6, and 0.97. Filled symbols: AP membranes; empty symbols: HP membranes.
equilibrium with liquid water. Therefore, electrolytes having high θF values are promising candidates for DMFCs. By analogy, higher θNSA values are expected to lead to higher proton conductivity values when samples are in equilibrium with vapor water, nonspecifically adsorbed water being the most mobile population among those existing in vapor phase. Therefore, electrolytes having high θNSA values are promising candidates for fuel cells equipped with gaseous hydrogen and air at low relative humidity (H2−PEMFC).
Proton conductivity (σ) of Nafion/zeolite composites were measured at 25°C equilibrating the sample with liquid water. For both AP and HP series, σ (data shown elsewhere19) increases with increasing zeolite content, the highest values measured for samples containing zeolite in the 0.98−4.42 wt % range. Moreover, σ values of HP membranes are lower than those reported for AP membranes. The trend with zeolite content and the difference between σ values of AP and HP membranes are in good agreement with the membranes’ WU and water mobility (θF), confirming the suitability of θF as electrolyte screening parameter.
The electrochemical performance of DMFC devices equipped with the composite membranes (HP series) characterized by the highest θF values (NZ_1_HP, NZ_2_HP, and NZ_3_HP) was tested, acquiring polarization and power density (PD) curves and the results are shown in Table 2 and Figure 13. Polarization and PD curves of the
unfilled Nafion membrane were also recorded as reference. All composites showed higher open circuit voltage (OCV) values with respect to reference Nafion (Table 2). OCV values are related to methanol crossover through the electrolyte49so that the presence of zeolite particles reduces methanol crossover through the Nafion membrane. Whereas the addition of zeolite at 0.98 and 1.40 wt % reduces the electrolyte permeability (12% increase in OCV value), the improvement is almost insignificant (<2%) for the sample containing the filler at 4.42 wt % due to the occurrence of porosity at polymer/zeolite interface.
The current and PD values (Figure 13) of cells equipped with NZ_1_HP and NZ_2_HP composite membranes were higher than the values obtained with the Nafion membrane, whereas the reference membrane outperformed NZ_3_HP. In particular, the cell equipped with sample NZ_1_HP reached a current density value of 62 mAcm−2 (with respect to 44 mAcm−2for unfilled Nafion) at 0.3 V. The maximum PD value reached with NZ_1 HP membrane was 19 mW cm−2 at a current density of ∼79 mAcm−2, whereas the maximum PD value of the reference unfilled Nafion membrane was 14 mW cm−2at a current density of 62 mAcm−2.
The comparison between performance of cells equipped with NZ_1_HP and NZ_2_HP indicates that polarization and PD
curves overlap in the activation (low overpotentials) and ohmic polarization (intermediate overpotentials) regions, whereas they differ in the concentration polarization region (high current density).
To understand such behavior, we acquired EIS spectra (Figure 13b) that allow measuring the serial resistance (Rserial) of the cells. Rserialvalues are obtained from the high-frequency intersection point of the impedance semicircle with the real impedance axis, and results are shown in Table 2. Rserialvalues are found to increase in the order N_0_HP < NZ_1_HP < NZ_2_HP <NZ_3_HP, that is, with increasing zeolite content in the membrane. Because Rserial accounts for both membrane and membrane/electrode interface resistances, the increase in Rserial can be associated with the increased resistance at membrane/electrode interface with increasing zeolite loading. This is clearly related to the heterogeneity of the membranes surface induced by the zeolite, which affects membrane− electrode interfacial properties and might be responsible for a larger drop in the cell potential at high current density.
All properties of the MEA are thus essential in evaluating FC performance but, although not the unique unambiguous parameter to be taken into account, θ represent one of the key parameters for the proper selection of a promising electrolyte for DMFC or H2−PEMFC applications.
Table 2. Open Circuit Voltage (OCV) and Serial Resistance (Rserial) Values Recorded with DMFCs Equipped with N_0_HP, NZ_1_HP, NZ_2_HP, and NZ_3_HP As Electrolytes atT = 40°Ca
sample membrane OCV/mV Rserial/mΩ
N_0_HP 520 37
NZ_1_HP 582 40
NZ_2_HP 582 44
NZ_3_HP 529 53
aAnode feed 1 M methanol.
Figure 13.(a) Polarization (left Y axis) and power density (PD; right Y axis) curves and (b) typical high-frequency complex impedance plane plot of DMFCs equipped with NZ_1_HP, NZ_2_HP, NZ_3_HP, and N_0_HP as electrolytes with 1 M methanol concentration as anode feed and air at the cathode. T = 40°C.
4. CONCLUSIONS
By using two independent and complementary methods such as DSC and DVS, we investigated the WU, water states, and water mobility, from both liquid and vapor phase, in Nafion/Faujasite composite membranes.
Analysis of the data allowed the quantification of the degree of mobile water absorbed by the membranes as θF and θNSA parameters,θFbeing related to the relative amount of freezable water adsorbed from the liquid phase andθNSAto the relative amount of nonspecific adsorbed water from the vapor phase. Both θF and θNSA reach a maximum at 4.42 wt % zeolite content, thus identifying a concentration threshold above which the beneficial effect of the zeolite toward the enhancement of water mobility is lost. The highest proton conductivity is also measured for samples containing zeolite in the 0.98−4.42 wt % range. Improved DMFC performance with respect to bare Nafion was recorded by using Nafion/zeolite composite membranes at 0.98 and 1.40 wt % obtaining a 12% increase in OCV, 36% increase in PD, and 40% increase in current density for the cell equipped with NZ_1 HP at 40°C. Tests in DMFC also demonstrated that increasing the zeolite loading causes an increase in the resistance at the electrode/electrolyte interface as a consequence of heterogeneity of the membranes surface induced by the zeolite.θFandθNSAcan thus be used to operate a preliminary quantitative screening for the selection of electrolytes for application in methanol- or hydrogen-fueled polymer electrolyte membrane fuel cells.
■
AUTHOR INFORMATIONCorresponding Author
*Tel: +39-(0)6-7259-4488; Fax: +39-(0)6-7259-4328; E-mail: [email protected] (B.M.). Tel: +39-(0)6-7259-4386; Fax: +39-(0)6-7259-4328; E-mail: [email protected] (S.L.).
Notes
The authors declare no competingfinancial interest.
■
ACKNOWLEDGMENTSThis work was realized with thefinancial support of the Italian Ministry for Foreign Affairs and the Ministère du Développe-ment Economique, l’Innovation et l’Exportation du Québec (Italy-Québec Joint Lab for Advanced Nanostructured Materials for Energy, Catalysis and Biomedical Applications), the Natural Sciences and Engineering Research Council of Canada, and the Canadian Foundation for Innovation of Canada.
■
REFERENCES(1) Steele, B. C.H.; Heinzel, A. Nature 2001, 414, 345−352. (2) Li, Q.; He, R.; Jensen, J. O.; Bjerrum, N. J. Chem. Mater. 2003, 15, 4896−4915.
(3) Wen, Z.; Liu, J.; Li, J. Adv. Mater. 2008, 20, 743−747. (4) Casciola, M.; Alberti, G.; Sganappa, M.; Narducci, R. J. Power Sources 2006, 162, 141−145.
(5) Heinzel, A.; Barragán, V. M. J. Power Sources 1999, 84, 70−74. (6) Ramya, K.; Dhathathreyan, K. S. J. Membr. Sci. 2008, 311, 121− 127.
(7) D’Epifanio, A.; Navarra, M. A.; Weise, F. C.; Mecheri, B.; Farrington, J.; Licoccia, S.; Greenbaum, S. Chem. Mater. 2010, 22, 813−821.
(8) Chen, F.; Mecheri, B.; D’Epifanio, A.; Traversa, E.; Licoccia, S. Fuel Cells 2010, 5, 790−797.
(9) Zarrin, H.; Higgins, D.; Jun, Y.; Chen, Z.; Fowler, M. J. Phys. Chem. C 2011, 115, 20774−20781.
(10) Smit, B.; Maesen, T. L. M. Nature 2008, 451, 671−678. (11) Sahner, K.; Hagen, G.; Schönauer, D.; Reiß, S.; Moos, R. Solid State Ionics 2008, 179, 2416−2423.
(12) Felice, V.; Tavares, A. C. Solid State Ionics 2011, 194, 53−61. (13) van Bekkum, H., Flanigen, E. M., Jansen, J. C. Introduction to Zeolite Science and Practice; Elsevier: Amsterdam, The Netherlands, 1991.
(14) Yoonoo, C.; Dawson, C.; Roberts, E. P. L.; Holmes, S. M. J. Membr. Sci. 2011, 369, 367−374.
(15) Kwak, S.-H.; Yang, T.-H.; Kim, C.-S.; Yoon, K. Y. Solid State Ionics 2003, 160, 309−315.
(16) Tricoli, V.; Nannetti, F. Electrochim. Acta 2003, 48, 2625−2633. (17) Baglio, V.; Aricò, A. S.; Di Blasi, A.; Antonucci, P. L.; Nannetti, F.; Tricoli, V.; Antonucci, V. J. Appl. Electrochem. 2005, 35, 207−212. (18) Kongkachuichay, P.; Pimprom, S. Chem. Eng. Res. Des. 2010, 88, 496−500.
(19) Zhang, Z.; Désilets, F.; Felice, V.; Mecheri, B.; Licoccia, S.; Tavares, A. C. J. Power Sources 2011, 196, 9176−9187.
(20) Yildirim, M. H.; Roca Curos, A.; Motuzas, J.; Julbe, A.; Stamatialis, D. F.; Wessling, M. J. Membr. Sci. 2009, 338, 75−83.
(21) Byun, S. C.; Jeong, Y. J.; Park, J. W.; Kim, S. D.; Ha, H. Y.; Kim, W. J. Solid State Ionics 2006, 177, 3233−3243.
(22) Chen, Z.; Holmberg, B.; Li, W.; Wang, X.; Deng, W.; Munoz, R.; Yan, Y. Chem. Mater. 2006, 18, 5669−5675.
(23) Lavorgna, M.; Sansone, L.; Scherillo, G.; Gu, R.; Baker, A. P. Fuel Cells 2011, 11, 801−813.
(24) Reinholdt, M. X.; Kaliaguine, S.; Che, R. New J. Chem. 2011, 35, 2573−2583.
(25) Higuchi, A.; Iijima, T. Polymer 1985, 26, 1207−1211. (26) Saito, M.; Hayamizu, K.; Okada, T. J. Phys. Chem. B 2005, 109, 3112−3119.
(27) Ping, Z. H.; Nguyen, Q. T.; Chen, S. M.; Zhou, J. Q.; Ding, Y. D. Polymer 2001, 42, 8461−8467.
(28) Kunimatsu, K.; Bae, B.; Miyatake, K.; Uchida, H.; Watanabe, M. J. Phys. Chem. B 2011, 115, 4315−4321.
(29) Hirata, Y.; Miura, Y.; Nakagawa, T. J. Membr. Sci. 1999, 163, 357−366.
(30) Nicotera, I.; Coppola, L.; Rossi, C. O.; Youssry, M.; Ranieri, G. A. J. Phys. Chem. B 2009, 113, 13935−13941.
(31) Lu, Z.; Polizos, G.; Macdonald, D. D.; Manias, E. J. Electrochem. Soc. 2008, 155, B163−B171.
(32) Yang, Y.; Zhang, H.; Wang, P.; Zheng, Q.; Li, J. J. Membr. Sci. 2007, 288, 231−238.
(33) Moster, A. L.; Mitchell, B. S. J. Appl. Polym. Sci. 2009, 113, 243− 250.
(34) Lue, S. J.; Shieh, S.-J. J. Macromol. Sci., Part B 2009, 48, 114− 127.
(35) Divisek, J.; Eikerling, M.; Mazin, V.; Schmitz, H.; Stimming, U.; Volfkovich, Y. M. J. Electrochem. Soc. 1998, 145, 2677−2683.
(36) Alberti, G.; Narducci, R.; Sganappa, M. J. Power Sources 2008, 178, 575−583.
(37) Siu, A.; Schmeisser, J; Holdcroft, S. J. Phys. Chem. B 2006, 110, 6072−6080.
(38) Kalapos, T. L.; Decker, B.; Every, H. A.; Ghassemi, H.; Zawodzinski, T. A., Jr. J. Power Sources 2007, 172, 14−19.
(39) Sing, K. S. W.; Everett, D. H.; Haul, R. A. W.; Moscou, L.; Pierotti, R. A.; Rouquerol, J.; Siemieniewska, T. Pure Appl. Chem. 1985, 57, 603−619.
(40) Park, G. S. In Synthetic Membranes: Science, Engineering and Applications; Bungay, P.M., Lonsdale, H.K., de Pinho, M. N., Eds.; Reidel Publishing Company: Dordrecht, The Netherlands, 1986.
(41) Detallante, V.; Langevin, D.; Chappey, C.; Métayer, M.; Mercier, R.; Pinéri, M. J. Membr. Sci. 2001, 190, 227−241.
(42) Stoica, D.; Alloin, F.; Marais, S.; Langevin, D.; Chappey, C.; Judeinstein, P. J. Phys. Chem. B 2008, 112, 12338−12346.
(43) Fatyeyeva, K.; Chappey, C.; Poncin-Epaillard, F.; Langevin, D.; Valleton, J.-M.; Marais, S. J. Membr. Sci. 2011, 369, 155−166.
(44) Takamatsu, T.; Hashiyama, M.; Eisenberg, A. J. Appl. Polym. Sci. 1979, 24, 2199−2220.
(45) Morris, D. R.; Sun, X. D. J. Appl. Polym. Sci. 1993, 50, 1445− 1452.
(46) Legras, M.; Hirata, Y.; Nguyen, Q. T.; Langevin, D.; Métayer, M. Desalination 2002, 147, 351−357.
(47) Ge, S.; Li, X.; Yi, B.; Hsing, I.-M. J. Electrochem. Soc. 2005, 152, A1149−1157.
(48) Majsztrik, P. W.; Barclay Satterfield, M.; Bocarsly, A. B.; Benziger, J. B. J. Membr. Sci. 2007, 301, 93−106.
(49) Mecheri, B; D’Epifanio, A.; Traversa, E.; Licoccia, S. J. Power Sources 2008, 178, 554−560.