A
LMA
M
ATER
S
TUDIORUM
· U
NIVERSIT
A DI
`
B
OLOGNA
SCUOLA DI SCIENZE
Corso di Laurea Magistrale in Informatica
A Collaborative Mobile Crowdsensing system
for Smart Cities
Relatore:
Chiar.mo Prof.
Luciano Bononi
Presentato da:
Alain Di Chiappari
Co-relatori:
Dott. Luca Bedogni
Dott. Federico Montori
Sessione II
My crime is that of curiosity. My crime is that of judging people by what
they say and think, not what they look like.
Contents
1 Introduction 7 2 Background 11 2.1 Environmental monitoring . . . 11 2.2 CoAP . . . 11 2.3 Geofencing . . . 152.4 Military Grid Reference System . . . 17
3 Related Works 21 3.1 Mobile Crowdsensing . . . 21
3.2 Applications . . . 29
4 System Architecture 33 4.1 Central Coordination Unit . . . 36
4.2 Mobile Application . . . 38
5 Implementation 43 5.1 Central Coordination Unit . . . 43
5.1.1 Database . . . 43
5.1.2 Server . . . 45
5.2 Sensing Client Android . . . 49
5.2.1 The View . . . 50
5.2.2 Sensors Measurements . . . 52
5.2.3 CoAP and Communication . . . 54
5.2.4 Timer and Geofencing . . . 54
CONTENTS CONTENTS
6 Test and evaluation 57
7 Future developments 61
7.1 More and different devices . . . 61
7.2 Performances and consumption . . . 61
7.3 Scalability . . . 62
7.4 Privacy, security, and reliability . . . 62
7.5 Stakeholders and Marketing . . . 63
List of Figures
1.1 Smart city . . . 8
2.1 CoAP packet . . . 12
2.2 Typical CoAP architecture . . . 14
2.3 Geofencing modalities . . . 15
2.4 UTM grid . . . 17
2.5 UTM grid examples . . . 19
3.1 MCSC taxonomy . . . 22
3.2 MCS Categorization . . . 24
4.1 SenSquare architecture . . . 36
4.2 Android App architecture . . . 39
5.1 Android View Main . . . 51
5.2 Android View Settings . . . 51
5.3 Android View geofences(1) . . . 55
5.4 Android View geofences(2) . . . 55
6.1 Test update time . . . 58
6.2 Test update amount . . . 59
Chapter 1
Introduction
Nowadays words like Smart City, Internet of Things, Environmental Awareness sur-round us with the growing interest of Computer Science and Engineering communities. Services supporting these paradigms are definitely based on large amounts of sensed data, which, once obtained and gathered, need to be analyzed in order to build maps, infer patterns, extract useful information. Everything is done in order to achieve a better quality of life.
Just to illustrate the problem, a large number of people around the world are exposed to high levels of noise pollution, causing serious physical illnesses and influencing neg-atively productivity and social behavior. Countries, such as the United Kingdom and Germany, have started monitoring noise pollution [1] to face the problem starting from data.
The advantages that could come from an intelligent approach to sensing, gathering and analyzing environmental or social data are numerous and heterogeneous. They ranging from intelligent transportation system, using traffic congestion monitoring and real-time parking maps; environmental monitoring, with air and noise pollution level sensing; tar-geted and location-based advertising, using GPS or other location systems; furthermore, other interesting solutions are becoming possible, such as the construction of detailed and real-time maps upon WiFi and telephone cell coverage.
A successful society and city management relies also on efficient monitoring of urban and community dynamics for decision and policy making [2]. In order to achieve this,
8 1. Introduction
traditional sensing techniques like Wired or Wireless Sensor Network (WSN), need an intensive usage of distributed sensors to acquire real-world conditions. Despite various and growing research, the high installation and maintenance cost, the low spatial cov-erage, as well as hard algorithmic issues [3], these techniques have never been largely deployed in urban contexts.
An enormous help predictably comes from mobile devices like smartphones, tablets and other more recent technological gadgets such as smartwatches and fitness bands. In fact, over the past ten years the evolution of mobile phones (mainly), have originated new solutions and services [4]. These devices are equipped with several sensors such as (two or more) camera, microphone, GPS, accelerometer, digital compass, light sensor, proximity sensor, temperature, barometer, humidity and it will be early the normality to have health-monitoring sensors as well [5].
Crowdsensing is a paradigm aiming to gather sensing measurements directly from people’s
Figure 1.1: A Smart City portrayal [6]
mobile devices in order to provide clients (people themselves, institutions, governments, companies and so on) with advanced services. Mainly these data will be used for ana-lysis and information extraction [4]. The looser energy constraints, the greater memory and storage and the extremely higher computational and network communication power of mobile devices compared to the standard little WSNs sensors, are remarkable
fea-9
tures, leading crowdsensing along the way of success. Furthermore, geofencing and activity recognition often represent, among the others, essential technologies support-ing this emergent paradigm.
Toward meeting these challenges, in this document, I propose SenSquare, a Crowdsens-ing approach based on smartphone and a central coordination server for time-and-space homogeneous data collecting.
The rest of the document is organized as follows. In Chapter 2 the whole set of main technologies and the paradigms that leverage this project will be briefly described. Chapter 3 introduces many related MCS works both on classification (and taxonomy) and applications in different scenarios. In Chapter 4 we will see the system architecture, especially how it have been envisaged and the main concepts on which, SenSquare re-lies on. After that, in Chapter 5, the implementation has been described more in detail, with related examples for each part of the system. In Chapter 6, it is briefly illustrated a simple test physically carried on, to evaluate the performances comparing SenSquare with an ideal non-smart approach. Finally, Chapter 7 introduces many future improve-ments and Chapter 8 makes a brief overview conclusion on the whole work.
Chapter 2
Background
2.1
Environmental monitoring
Sensing and environmental monitoring were born with the necessity to collect data to observe and control environmental, productivity, technical and social parameters, mainly for military and ecosystem monitoring purposes.
As mentioned earlier, a common solution adopted so far is the deployment of a sensor network, especially in the recent form of Wireless Sensor Networks, also thanks to pro-tocols and technologies such as 6LoWPAN, ZigBee, Ultra Wide Band and so on. WSN, for his conception, has the need to link tens to thousands of radio transmitting sensors and cover areas that are difficult to wire for charging and interconnecting. The challenges in designing this kind of network involve the management of resources. One of the main areas of application unquestionably is the environmental monitoring for personal, institutional and scientific purposes. Crowdsensing comes in handy to extend and improve different kind of sensing applications and services where an infrastructure support is difficult or expensive to maintain.
2.2
CoAP
The Constrained Application Protocol (CoAP) is a transfer protocol for constrained nodes and networks, such as those that will form the Internet of Things. Similarly to its older and heavier cousin HTTP, CoAP uses the REST architectural style. Based
12 2. Background
on UDP and unencumbered by historical baggage, however, CoAP aims to achieve its modest goals with considerably less complexity[7].
CoAP provides a request/response interaction model between application endpoints, supports the built-in discovery of services and resources, and includes key concepts of the Web such as URIs and Internet media types. CoAP is designed to easily interface with HTTP for integration with the Web while meeting specialized requirements such as multicast support, strongly low overhead, and simplicity for constrained environ-ments[8].
In these two statements, we can find all the main CoAP core’s characteristics. Let us see more about this protocol and why a section of this document is dedicated to it.
CoAP was conceived mainly for IoT devices, that are battery-operated, constrained in computational power, RAM and storage capacity. Often protocols and applications are not designed to be optimized for running under these requirements, hence there are many performance issues.
Especially in wireless environments, many packet losses will occur, getting worse the
Figure 2.1: CoAP packet [9]
already critical power consumption of mobile devices. Furthermore, wireless standards need fragmentation, aggravating packet loss and adding other weight for headers. Wireless devices and applications need power-efficient protocols, but existing protocols have typically been designed without power-efficiency criteria. In low-power wireless systems, the radio transceiver is typically the most power-consuming component [10]. Usually, in WSNs, a first and common approach is the tuning of the radio duty cycle,
2.2 CoAP 13
sometimes with the protocols support. These methods allow to maintain a low power consumption, organizing the send/receive tasks all in the on-period, and in the idle time turning off (or decreasing power of) the radio transceivers.
Several devices are becoming connected, in order to build automation systems, mobile personal gadgets, cellular terminals and smart grids, considering that under the push of IoT, it is expected over the next decade, a growing to trillions of embedded devices [7]. Under this consideration, it has to be said that 6LoWPAN and ZigBee are a remarkable breakthrough on the network side.
Unfortunately, networking alone is not enough to support the modern approach based on the Web Architecture with REST paradigm, especially in the form of HTTP protocol, which provides through simple URIs, both information and services.
CoRE WG1, an IETF Working Group, has been working in these years with the pur-pose of making possible REST architecture for devices and networks with constrained requirements. Their main result is the Constrained Application Protocol, CoAP [7, 8]. REST architecture is so crucial that represent the Web as we know it today. Key fea-tures of REST are the following. First of all, beside the central client-server model, is the resources concept, everything is accessible through a URI. Synchronous request/re-sponseand stateless approach. Layered system and possibilities for deploying of cach-ing, proxying and redirectcach-ing, seamlessly for clients. HTTP implements this concept through synchronous request/response methods such as GET, PUT, POST and DELETE to access on-server resources.
CoAP is conceived to keep all the handy REST features in HTTP, decreasing the cost for network and memory usage. In order to save batteries and to be lightweight CoAP has a fresh approach to the REST paradigm with a limited amount of requested resources. To do that, CoRE WG has built the protocol on the following bases.
Primarily, CoAP uses UDP with a simple message layer for lost packets retransmission and a little four bytes (binary) header within it. A common request employs from ten to twenty bytes for the header [7].
Clearly, all the main request methods of HTTP are kept (GET, POST, PUT, DELETE) and the response codes as well, but encoded in one byte only. CoAP uses URIs to identify resources, with the schema coap[s]://{scheme-specific-part} as HTTP does.
14 2. Background
Figure 2.2: A typical architecture using CoAP [9]
Basic CoAP messages work better for small payloads, for instance for sensing data and similar [7]. Anyway, if the application requests larger payloads, UDP supports it through IP fragmentation, but CoAP prefers to exploit “Block” options dividing the data into multiple packets and keeping the server stateless.
An immediate advantage of this HTTP-like approach is the possibility to develop a CoAP IoT, or similar, architecture, connected with an existing HTTP service, through a simple proxy as a translate-middleware, “speaking” CoAP on the client side, and HTTP on the server side.
Further CoAP characteristics are, first, the Observer pattern, where the client can specify an interest in a GET request, afterward, the server will push information requested asyn-chronously without establish a whole publish and subscribe mechanism. Second, CoAP supports Machine to Machine communication, through resource discovery following a new IETF approach with the well-known resource path /.well-known/core (RFC5785). Today, security on CoAP is demanded to the use of the protocol on the top of DTLS, similarly to SSL/TLS for HTTP.
In SenSquare I used CoAP mainly to address the problem of high power consump-tion, due to the huge amount of requests for each sensing data. The kinds of requests used in this project perfectly fit with the CoAP purposes. In fact, as we can see in a
2.3 Geofencing 15
moment, there are only little fragments of json both for data sending and little more features. Furthermore, in future developments, it is expected to use homogeneously the same approach for development on Arduino and other embedded platforms, keeping the examined advantages.
2.3
Geofencing
Figure 2.3: Geofencing modalities [11]
The core of SenSquare is conceived using CoAP for communication purposes and, among the others, geofencing technology to support sensing spatial homogeneity on the client, as described in the next chapters. This section wants to introduce and describe this location-based technology and the offered possibilities. In this document I am go-ing to refer with geofencgo-ing accordgo-ing to the Android implementation [12], given that it has been used in SenSquare development.
16 2. Background
which users employ many different mobile, stationary and embedded computers over the course of the day. In this model computation does not occur at a single location in a single context, as in desktop computing, but rather spans a multitude of situations and locations covering the office, meeting room, home, airport, hotel, classroom, market, bus, etc.
The challenge is to exploit the user life’s dynamic to devise a new class of application, in which the core is based on the users’ current context. These new systems have to recognize the correct context in which they are, triggering the right behavior based on space, time, relationships, device and so on.
Context-aware applications, mainly, have to react to the environment answering the questions: Where you are. Who you are with. What resources are nearby. [13]. With geofencing we can answer the first question, moving forward to a new kind of location-based, context-aware applications.
A geo-fence is a virtual delimited area, in two-dimensional space, generally shaped as a circle identified by a central position (latitude/longitude located) and a radius. The ma-jor utility, using this technology, is the possibility to set user/developer-defined actions to trigger in one or more of the following situations:
• ENTER. When the user enters a geofence.
• EXIT. When the user gets out of a geofence.
• DWELLING. When the user is moving inside a geofence for a defined continu-ous amount of time.
Thanks to these features location-based services become proactive supporting smart no-tifications, action triggering and so on. Mobile devices, in this way, are able to act within an intelligent environment supporting the user by adapting its capabilities to-wards the situational needs [14], or in our case, creating an automatic system for trigger transmission of sensing data based on the user geographic position.
2.4 Military Grid Reference System 17
2.4
Military Grid Reference System
SenSquare space homogeneous sensing system relies on MGRS (UTM) coordinates. Let us see, in this paragraph, what is this reference system and why it has been chosen for SenSquare, instead of using the common geographic coordinate system.
For our purposes, independently from the granularity level and the size of the area, we do not need, primarily, the exact (centimeter-accuracy) position whence the data come from. It is crucial, instead, the possibility to associate a sensing data to this area, according to the kind of sensor we are monitoring and the granularity is requested from stakeholders. In other words, for instance, if we are monitoring the pressure level in hPa, we are not looking for the exact latitude-longitude identified position, we are, rather, aiming to estimate the pressure level in a kilometer-sized region.
GPS or other position provider services (WiFi fingerprinting, Telephony Cells
estim-Figure 2.4: UTM grid example with zone 19 [15].
18 2. Background
well). For most purposes, this kind of system is quite enough, however, when we need to plot position information on maps or we have to make further calculations using them, it is definitely useful to work with the corresponding grid on a map projection [15]. In our case, it has been chosen the Universal Transverse Mercator (UTM), one of the most widely used map projection and grid system. According to the U.S. Department of Defense decision, I used the Military Grid Reference System (MGRS) applied on the UTM grid.
UTM exists since 1947 when the United States Army adopted the ellipsoidal transverse Mercator projection and the associated grid UTM system in order to get rectangular coordinates on large-scale military maps covering almost the whole world [15]. UTM became a widely and popularly system used not only for military purposes but for civil uses as well, such as general surveying and mapping and navigation.
UTM divides the Earth into 60 zones, each generally 6 degrees wide in longitude. Omitted minor exceptions, the zones are numbered from 1 to 60 starting at 180 degrees longitude and proceeding east. The effort in creating the grid was in keeping zones narrow enough to lower distortion and scale variation within an acceptable level. MGRS comes from UTM grid system (and UPS, Universal Polar Stereographic grid system for polar regions). MGRS is used to map the entire planet and uses a different labeling system from the UTM one.
To better explain MGRS, let us start with an example.
We can take the valid MGRS address 33TUF 81384 62754, which identifies a position in the ancient Medieval Caste of Gaeta, in Italy, as we can see in Figure 2.5. It is composed as follows:
33T Grid Zone Designator. UF 100km square identifier.
2.4 Military Grid Reference System 19
Figure 2.5: In left-right and top-bottom order. MGRS grid with 10m, 100m, 1km, 10km, 100km and GDZ grid on the same location.
20 2. Background
33TUF GZD and 100km precision grid square ID. 33TUF 8 6 10km precision.
33TUF 81 62 1km precision. 33TUF 813 627 100m precision. 33TUF 8138 6275 10m precision. 33TUF 81384 62754 1m precision.
The main advantage coming from MGRS is due to the infinite possible GPS coordin-ates, especially when calculus or manipulation is involved on position values. UTM divides the Earth into squares, and MGRS approximates each position identifying it according to different levels of accuracy. This is quite useful for sensing task, as we mentioned earlier.
MGRS, hence, divides the earth surface into 10km, 1km, 100m, 10m and 1m side length square, conforming to the specified precision, therefore the digits of the last part of the address could be 0, 2, 4, 6, 8, 10.
Due to the application of 2-dimensional geometry on 3-dimensional space itself, some adjacent square to a grid junction is clipped, in these cases area are better described by a polygon.
Finally, it is needed to know that when it is lowering on precision scale, MGRS needs truncation (on both easting and northing) rather than rounding, and that the southwest corner of the square, or polygon in general, is the identifying point for the whole area, even when the polygon is clipped [15].
Chapter 3
Related Works
3.1
Mobile Crowdsensing
To enter the world of Crowdsensing, it could start summarizing the more general concept of crowdsourcing, a paradigm impelling people to collaborate for a common project, with or without a monetary profit and without the necessary legal belonging to a com-pany or association. Classic examples of crowdsourcing are open-source programming projects, the famous Wikipedia platform, the growing universe of crowdfunding for fin-ance independent (and not) projects and so on.
Mobile Crowdsensing (MCS) is a paradigm extending the vision of participatory sens-ing in a crowdsourcsens-ing vision by leveragsens-ing both participatory sensory data from mobile devices and user-contributed data from mobile social networking services [2], fusing machine and human intelligence in this collaborative process. It allows the increasing number of mobile device users to get and share local knowledge information to collect for real-time or future analysis.
From a pragmatic perspective, in [16] we can find that MCS is the ability to acquire local knowledge through sensor-enhanced mobile devices - e.g., location, personal and surrounding context, noise level, traffic conditions, and in the future more specialized information such as pollution - and the possibility to share this knowledge with the so-cial sphere, healthcare providers, and utility providers.
According to a formal definition in [2], MCSC (Mobile Crowd Sensing and Computing)
22 3. Related Works
3.1 Mobile Crowdsensing 23
is a new sensing paradigm that empowers ordinary citizens to contribute data sensed or generated from their mobile devices and aggregates and fuses the data in the cloud for crowd intelligence extraction and human-centric service delivery.
Concluding this review around the possible definitions, in [17] we have a human-centric perspective of MCS, which is Mobile crowd sensing is a new paradigm that takes ad-vantage of pervasive mobile devices to efficiently collect data, enabling numerous large-scale applications. Human involvement is one of the most important features, and hu-man mobility offers unprecedented opportunities for both sensing coverage and data transmission. [...] Compared to traditional sensor networks, human mobility offers unprecedented opportunities for both sensing coverage and data transmission. Simil-arly in [4] Mobile crowdsensing refers to a broad range of social and community-based sensing paradigms employing mobile devices and wireless networks. Different from conventional sensing solutions using specialized networks of sensors, mobile crowd-sensing aims to leverage human intelligence to collect, process, and aggregate crowd-sensing data using individuals’ mobile devices, so as to realize a higher quality and more effi-cient sensing solution.
It is possible to discern different types of MCS according to different points of view. A first kind of classification is done upon the user consciousness in collecting data [18]:
• Participatory sensing is referred to an MCS paradigm in which users are com-pletely involved in the application running lifetime, deciding how, where, when and what to sense or get data for the system.
• Opportunistic sensing require, instead, an unconscious usage of the application, which always runs in the background, opportunistically getting data without user involvement.
Looking at the kind of transmission support, we can find another classification [17, 18]: • Infrastructure-based transmission uses infrastructure support for Internet con-nection like cellular networks (3G/4G). In this MCS paradigm, there are the clas-sic problems related to the constraining economic cost and bandwidth usage. • Opportunistic transmission enables, instead, transmission of data through
Opportun-24 3. Related Works
istic transmission avoids the costs related to telephony company subscription but suffers intermittent connection like any other best-effort service.
In [19] we can find a categorization related to analysis time:
• Offline analysis, the most common and older solution provide for the input ana-lysis process in deferred time. Classic examples are transportation activities in urban space, health, and physical assessment, environmental parameters monitor-ing.
• Online analysis, on the other hand, provide a real-time analysis, this is pretty use-ful in scenarios like traffic monitoring, public safety, and collaborative searching.
Figure 3.2: MCS Categorization [2]
In [2] other classification are identified according to:
• Data generation mode:
– Mobile Sensing exploits the sensing functionalities (included antennas, mi-crophones etc.) of the device, providing a data completeness related to its technological level.
– Mobile Social Networking approaches leverage on user spontaneous contri-bution, through direct intervention or through other platforms such as social networks.
3.1 Mobile Crowdsensing 25
• Sensing style:
– Explicit Sensing is the sensing style in opportunistic/participatory modalit-ies, where the user is aware to sensing task and data collection is the main goal of the service. In this case, the sensing task is explicit to the user. – Implicit Sensing performs a kind of hidden data collection, the user is
fo-cused on the usage of the platform for social interaction. In this case, the data generation is a secondary task and so it is implicit for the user.
• Volunteer organization:
– Group sensing is referred to a modality in which user are loosely or op-portunistically organized (for instance for space or time criteria) in order to address a data collection for a shared problem. An example for this could be a group of random people passing, over the time, in a precise zone of the city which needs a sensing task for a set of environmental parameters. – Community sensing is based on the “community” concept, according to the
Cambridge Advanced Learner’s Dictionary community is the people living in one particular area or people who are considered as a unit because of their common interests, social group or nationality. It expected from this modality a high-quality of data, for the nature of community itself, who perform tasks in a higher interactive and spontaneous way. For example, a college community can be treated as a unity in the task of monitoring their school quality, supposing the existence of a common goal, the better life in their structure.
– Urban sensing has often a lower quality level of data compared to the previ-ous models, despite the broad spread. This is due to a low fostering in using the service and to a scarce sense of belonging to community.
SenSquare is designed as a mixed form of participatory and opportunistic sensing; users can, independently, take decisions about which sensor data they want to share and which stakeholder can benefit of. Regarding transmission type both the modalities described are used, in order to achieve a better coverage sensing map, anyway, on cutting-edge
26 3. Related Works
devices is possible to autonomously choose which kind of connection technology al-lows for each single application. The project is also designed to support both offline and online analysis, considering that all the data are immediately sent to the server and directly accessible through specific API or REST calls. The data generation belongs to the first class, exploiting all the available sensors. The sensing style is explicit and the system is designed for an urban audience, because of the Smart Cities nature itself.
In [20] the mobile cyber-physical systems (CPS) are discussed as integrated comput-ing and communication systems that process and react to senscomput-ing data from the external physical environment and transform the way humans interact with the physical world, enhanced with mobile features and exploiting strongly the Crowdsensing paradigm. They also identify a classification upon the kind of MCS application:
• Vehicular Social Networking which uses the regular and predictable drivers’ routes to collect data in order to measure traffic congestion, identify the real-time best route and detect accidents supporting a quicker medical intervention.
• Environmental Monitoring, not only in an implicit way but also exploiting the awareness, leveraging on the user’s cooperativeness, especially when the system is deployed for communities.
• Disease Report and Crisis Management is one of the most interesting and ap-propriate field for MCS spreading, considering the richness of sensors on mo-bile devices, for instance, the Ministry of Health in Cambodia uses GeoChat, a crowdsourced sensing interactive mapping application, for disease reporting and staff alerts which enable rapidly escalated responses to potential outbreaks. Also, Ushahidi has been used to crowdsource and map crisis information from multiple sensing data streams in real-time through mobile devices, so as to coordinate field teams’ activities and provide remote support from outside an earthquake zone[20–22].
We can also find a further classification, as described in [5]:
• Smart Cities exploit the high density and heterogeneous population to improve city efficiency by deploying smarter grids, water management systems and
ulti-3.1 Mobile Crowdsensing 27
mately the social progress. [...] People can actively participate in sensing cam-paigns to make their cities safer and cleaner.
• Road Transportation, beyond the real-time traffic information, uses MCS, in particular through GPS, accelerometer, and gyroscope in order to quickly identify and repair uneven roads.
• Healthcare & Wellbeing can help both for real-time first aid and long-term epi-demiological or medical research thanks to collecting a big amount of data, also linked to activity recognition systems as well. Besides this, data collection and analysis has interesting applications for fitness and wellbeing in general [23, 24]. • Marketing/Advertising is a cutting-edge field of study for the impressive
eco-nomic returns. MCS fused with activity recognition and location management (context-aware solutions) generate mobility routes and patterns incredibly use-ful for companies and vendors in order to adapt commercial strategies to social behaviors.
Let us move on which are the key features, and related issues, affecting MCS design and development. Outstanding obstacles in the growing MCS expansion, are identified for instance in [16] and [19]. Let us proceed in a short review about them.
First of all, the heterogeneous mobile devices and sensing hardware population leads to enormous difficulties from designing to deployment. Just the different operating sys-tems installed on the devices, both for the brand and version itself, make up a hindrance for a larger spread of applications, dealing with incompatibility and portability prob-lems. An application lifecycle is already a hard task in itself, support and maintenance for so different platforms is onerous in time and, often, in money as well.
Later, another issue regards the burden of an MCS installed app for the users. Without considering that for each MCS system, today, a user has to install a separate and specific application, it is clear that battery lifetime is a well-known open problem for smartphone and similar devices. Users are also conscious that each application steals processing and memory capacity to other apps; modern operating systems, on the other hand, are designed for self-contained products, making inter-application data sharing difficult be-cause of justifiable security reasons.
28 3. Related Works
MCS. Emerging applications, not only for sensing, require more and more data to send and receive; this is primarily due to the nature of the data, often multimedia streaming such as video and music, and later for the intensive network usage requested for better accuracy, performance and so on.
In [19] the proposed solution relies upon three principles: separation of data collection and sharing from application logic, removal of application installation from the deploy-ment and decentralization of processing and data aggregation.
My solution through SenSquare adopts this last principle, combined with a lightweight communication protocol and an intelligent server logic.
I decided to briefly debate the crucial issue of User Motivation individually. This problem is faced in many works such as [16], [17], and deeply in [25], which treats the economic incentive for the MCS user (as data provider) and in [26], in which the authors build up a detailed dissertation upon the fostering problem.
Mainly when users’ devices have a limited amount of resources (battery, memory, com-putation), or the information requested are particularly sensible (position, photos, med-ical parameters), users properly demand a kind of remuneration, incentive or benefit to installing and use the MCS application. For these reasons construct a fostering system or an economic model is crucial for the system success, mainly because, for definition, Crowdsensing request a large number of “volunteers”.
Often an economic incentive is a right way, especially when the volunteer organization model is the Urban one. The incentive could be directly monetary, sale-based, company fidelity-based (in SenSquare this is the designed way) and so on. Marketing in this field has no limits.
Another fostering model is related to Gamification1. The user application, in this
case, could be developed using the main Gamification principles, for instance provid-ing badges, levels, goals, rankprovid-ing. This fosterprovid-ing modality mainly attracts the youngest segment of population, and has a great success on workplaces although is, currently, a recent research field yet [27–29].
1Gamification is the application of game-design elements and game principles in non-game contexts.
Gamification commonly employs game design elements which are used in so-called non-game contexts in attempts to improve user engagement, organizational productivity, flow, learning, employee recruitment and evaluation, ease of use and usefulness of systems, physical exercise, traffic violations, and voter apathy, among others. [from Wikipedia, https://en.wikipedia.org/wiki/Gamification]
3.2 Applications 29
User participation represents one of the most important elements in MCS. Considering the consumption of resources, the personal data transfer and the exposing to potential threats, the fostering modality and the decision of the called minimum price is a well-known problem to address properly.
As we saw so far, WSN or other sensor networks require specific hardware, protocols, and applications to cover a large area for monitoring of the environment, roads, social behaviors and so on. Performances are heavily dependent on the number of sensors and a scarce coverage leads to a low quality of the sensing task results [25]. Smartphones and mobile devices in general are born with embedded sensors, growing in number and quality as time passes. Wireless and 3G/4G connectivity, GPS, activity recognition, provide with sensors a perfect mixture for an MCS exponential growing. Crowdsensing is the perfect tool for address sensing task in an urban environment to support a more general Smart City environment, considering problems and characteristics that make it unique.
3.2
Applications
Collaborative Internet of Things is, always more, a growing field of study, gaining in-terest as solution breaking down the barriers of isolated IoT ecosystems.
As I mentioned before, like it happens for MCS, also, in general, IoT-based architec-tures suffer a low inter-architecture interoperability. In [30] a general comprehensive paradigm is proposed. MCS is a perfect candidate to become part of this revolution, thanks to a little amount of requested resources, an easier deployment and a large pop-ulation, which under the correct stimulus, can collaborate with restrained costs.
We saw that MCS is a recent concept that exploits the sensing (and not only) capacity of personal mobile devices, such as smartphones, in-vehicles facilities, and wearables, giving us a potentially huge amount of device (or manually) produced data. When this data, after the appropriate gathering and analysis, become information, the common in-terests on it are definitely remarkable.
Although the above considerations upon the theory of MCS, the term is common re-ferred, in literature, on the two paradigms described earlier: participatory sensing (crowdsourcing in an user-awareness way) and opportunistic sensing (not involving
30 3. Related Works
the user in the sensing tasks). MCS approach is conceived and implemented to map phenomena of common interest, which need a significant amount of data, in a hetero-geneous way regarding the different points of view to describe events/situations, and in a homogeneous way regarding the as larger as possible sensing sampling. This has been demonstrated to be efficient in several fields of application where the IoT is already the key technology set that tackles the most challenging tasks [31].
Most of the remarkable applications of MCS are designed to support Smart Cities concept. By now it has become straightforward that the increasing density of popu-lation with related problems make big cities management a strenuous assignment for institutions. Solutions for Smart Cities are heterogeneous and range on the entire spec-trum of city and personal life.
Environmental monitoring is the natural application of MCS paradigm applied to Smart Cities, considering that most devices natively support environmental sensors. Several applications, such as SecondNose [32] and studies like [33] and [34], have been pro-posed in order to improve the environment conditions, starting from data sensing col-lecting, sometimes trying to sensitize directly the interested population. In Park Here! an example of advanced smart parking systems is provided, through which users can be informed in real-time about the presence of vacant parking spots close to their destin-ations, in order to reduce the high level of stress and decreasing air pollution. Often, activity detection is used for this purpose as well, based on gyroscopes, acceleromet-ers [35], sonars [36], magnetometacceleromet-ers [37] and on-board cameras. Other crowdsensed user’s transportation mode detection in smart cities is also interestingly addressed in [38, 39] regarding activity-recognition system itself and in [40] implementing a location and activity-based mobile advertisement service.
Especially in Smart Cities, MCS can reduce the costs associated with large-scale sens-ing, providing at the same time additional human-related data [5].
As just mentioned with Park Here! Road Transportation is an highly potential field of application for many MCS applications [41]. Institutions and transport authorities can strongly benefit of real-time traffic information [42], constructing fine and large grain maps in order to support traffic engineering, roads and cycle lanes construction and so on.
3.2 Applications 31
Healtcare has even found advantages in MCS, such as in [43], in which patients are collecting measurements about their daily activities in order to provide a significant dataset to be analyzed by doctors. This study, in particular, is focused on a specific annoying disorder called tinnitus.
Finally, Marketing & Advertising is relying on MCS for new and effective kinds of strategy. As mentioned above, Geospot [40] is a perfect example of mobile advertising system which uses sensing for activity recognition and geofencing. Stakeholders as vendors and companies, in general, are definitely interested in human traces and pat-terns to implement context-aware solutions.
The common approach in designing an MCS architecture is to divide the system into two interdependent pieces according to a client-server paradigm. A cloud backend nor-mally expects data in a particular format from its respective sensing client, which, this last, can only talk with its respective server. In this way, there is any kind of vertical interoperability among different application, neither a common protocol is established in order to achieve a similar result.
Is straightforward what kind of waste this approach causes. Some architectural attempts have been proposed, for instance, McSense [26], a centralized MCS system that exploits monetary rewards to make the backend entity assign sensing tasks to the users. In this document, through SenSquare, we are going to address these issue as well, in order to give a better solution for this interoperability purposes.
As addressed in the previous section, we know that social and monetary incentive is essential to push the user toward a better collaboration [26, 44]. It is clear, indeed, that MCS is effective and efficient if and only if the penetration of the application is as wide and permeating as possible.
Exploiting monetary rewards (refunds and actual payments) is an immediate way to foster a massive collaboration, in [45] it is described an approach based on micro-payments, whereas in [25] is based on reverse auction dynamic price with virtual participation credit and recruitment algorithm. In this reverse auction, participants want to sell their sensed data to an auctioneer, which, wants to buy the least expensive
meas-32 3. Related Works
urements. To make this process equal, after such cycle winners raise their prices and losers lower theirs.
Like gamification does, other approaches address the fostering issue relies on the per-sonal interest of users, or anyway, on their entertainment using the application.
Chapter 4
System Architecture
This chapter illustrates the SenSquare architecture, describing how it has been conceived and outlining the modules which compose the whole system.
SenSquare is designed to be a star topology system, in which sensing clients can only communicate with a central server, hence there is no link of any kind among them. The central server is called Central Coordination Unit (CCU). CCU is the only element in the system designated to have reasoning capabilities or any kind of intelligent beha-viour.
As just mentioned, client device entities are the sensing elements of SenSquare. They rely on a minimum set of sensing hardware, one or more current location retrieval (and geofencing) mechanisms and network connection to communicate with CCU. Such devices can be smartphones, tablet, wearable and in the near future, embedded devices. This is the basic components of MCS SenSquare system.
Take part in this scenario also the stakeholders, a different type of client in SenSquare, we can call them interested clients. Stakeholders orchestrate the meaning of the sensing data, in order to achieve their singular and specific purposes. To do that, they can push rules to the CCU, specifying sensor, time and space related parameters as described in detail, shortly. Users, equipped with their personal sensing client devices, can subscribe to one or more stakeholders offering data in exchange for some kind of revenue, previ-ously set among the parts and depending on the respective needs.
CCU main task consists in gather and store, in a database, sensing measurements
34 4. System Architecture
ing from sensing clients. Crucial, right after this incoming direction part, is the process to determine the correct answer for the client. What sensing clients expect from the server, after a measuring sending, are the time and space update criteria, related to that sensor.
More in detail, a sensing client continuously gets measurement updates from its sensors. Whenever it sends this values (one communication for each sensor update), CCU replies to them with a time interval update condition (time after the new measurement for that sensor has to be re-sent) and a space update condition (a zone, in which the client cur-rently is, outside which the new measurement for that sensor has to be re-sent). It is clear that the space condition is worthless for non-mobile devices.
It is needed to better specify the time and space conditions mentioned above, consisting in the core aspect of MCS SenSquare intelligence. These conditions are based on the set of stakeholders (or system default) inserted rules. How the set is composed, that is, which of all rules stored in the CCU’s database, belong to a set, depends on kind of sensor, user’s position, current time, user’s subscription. Let us see why.
First of all, a rule is defined by a tuple, defined as follows:
< stakeholderID, sensorT ype, addrM GRS, areaM GRSGran spaceSampleGran, timeSampleGran, timeExpire, countExpire >
• stakeholderID is the identifier of the stakeholder who inserted the rule and that owns it.
• sensorType is type of sensor, requested to monitor.
• addrMGRS is a valid MGRS address, it has no meanings without the next field.
• areaMGRSGran gives a semantic to the previous field. If addrMGRS identifies a specific 1m precision location, this field is the mask to apply on it, giving so the zone which is requested to monitor. Making an example, if the address is 33TUF 81384 62754and the mask is 2, the MGRS area within the rule is valid is 33TUF 81 62.
• spaceSampleGran defines the size of the area within a single measurement for a rule is valid. The sensing client will receive a zone for geofencing exit trigger
35
related to this value, hence, it will have to send the new measurement for the given sensor, once exited the zone it currently is in. If spaceSampleGran is 4, sampling within this area has to be 10m sized. Obviously, this field can not contain a value lesser than areaMGRSGran, because the sampling would concern a bigger square than the monitored area itself.
• timeSampleGran, similar to the previous field, defines a time period in seconds, after which the sensing client has to send the new measurement for the given sensor.
• timeExpire defines until when, as timestamp, the rule have validity.
• countExpire defines up to how many measurements, the rule have validity.
The Sensing Infrastructure is defined as the set of all mobile and static devices par-ticipating actively in this scenario. Being crowdsensing, part of the general crowd-sourcing concept, it can be assumed that sensing clients are mostly private users, shar-ing data and consequently battery, computation, memory, and storage for our purposes. Users, in this architecture, can submit voluntarily their data, choosing also the stake-holders that can take benefit from them. As mentioned at the beginning of this chapter, the voluntaries expect a reward from this exchange, on the other hand, stakeholder cli-ents request a minimum of reliability from the data that users provide. As described in the related works chapter of this document, there are many strategies to face these problems and we leave them as future enhancements, complementaries to this project although as interesting as it.
Depending on what and how many stakeholders the users subscribe (instead of just keeping the default ones), device resource consumption could be onerous. Thereby, it is needed, some mechanism to avoid this problem, especially with numerous subscriptions and stakeholders’ rules in the database. CCU is delegated to handle this task.
Before explaining how this problem is addressed, let us consider an example.
An internet service provider decides to develop a crowdsourcing city WiFi for the sub-scriber clients. Each customer, accepting the terms and conditions, will share a part of its home connectivity with other customers of the same provider. On the other side, these customers can take benefit of this sharing when they are not at home, using the
36 4. System Architecture
other customers’ connectivity. To deploy this system in the first city, the provider com-pany, first want to map all the territory in terms of WiFi coverage. They, hence, need the average wireless throughput with a precision of 10 meters and a rate of few hours in all the zones they want to map. They also want the BSSID and the RSSI of the sensed access points, to evaluate the signal strength in as many points as possible. After in-serting the rule on the CCU’s database and created an effective fostering plan to get subscriptions, they have to wait for the proper amount of data to take strategy decisions.
Figure 4.1: System architecture. The red arrow represent the redundancy avoidance through the rules in the same area.
4.1
Central Coordination Unit
One of the core goals of SenSquare, as seen so far, is to reduce as much as possible the energy consumption of the sensing clients. On the computational side, it has acted concentrating most of the burden generated by the ecosystem on the CCU, giving thus, the complete control of the scenario to it. I developed the python CoAP/REST server together with a MySQL database, for rules and sensing data, as the CCU.
4.1 Central Coordination Unit 37
Most of the computational cost is due to responses that clients expect to receive after a measurement sending. This response includes a timer and an area, that, as we stated before, characterize when and where the next update for the given sensor is required.
Timer Different sensor measurements need to be updated according to different timers. It is clear that the ambient temperature or pressure value, do not require frequent up-dates, being a slow changing number. Instead, for noise level, it is needed to have always fresh data in order to monitor, conveniently, frequently changing noisy locations.
Zone Assuming mobility on sensing clients, and the MGRS zone labeling introduced above, SenSquare uses zone constraint to achieving a homogeneous sampling of the ter-ritory. We know the MGRS hierarchically divides the word into squares (or polygons) uniquely identified with the encoding seen earlier. A great advantage of MGRS comes from exploit this encoding applying a mask to scale or descend in the space hierarchy. Considering an amount of digits (on both easting/northing last parts), according to the mask, identifies different sized square in the hierarchy, always containing the full en-coded location (1m square zone).
For instance, Bologna belongs to the part of Italy having Grid Zone Identifier 32T, and the city itself is assigned the 100km sided square 32T PQ. A device sends to CCU a latitude/longitude position that server translates into the MGRS identifier 32TPQ 57314 29575(always the maximum precision after translation). We can infer that the device is in Bologna, and that it belongs, among the other, to the 10km sided square 32TPQ 57 29( mask = 2 => 1km ).
When the CCU calculates which zone has to be sent to the client in response, acts as follows. First, it takes all the rules related to the right sensor, both default ones and stakeholders subscribed too. Among them are taken only those contain the client posi-tion. Finally, considering that there still could be multiple rules satisfying these criteria and that we want to avoid useless energy consumption on the client side, is reckoned just one zone. The zone chosen is always the smallest sticking out from the rules, that is the one which satisfies, with the finest grain, all the other rules requesting that sensor measurement.
38 4. System Architecture
Similarly, the shortest timeout (finest grain in time) is chosen to fit all the others. Let us define more formally the tricky task of zone calculus. CCU apply for each rule the operation addrM GRS||areaM GRSGran (where || is the mask operation), to ob-tain the validity area in these rules. Then, it identifies if the client position belongs to them and searches for the littlest granularity requested in these rules, identifying so, the square in the hierarchy satisfying all the rules, consequently. Granularity goes from 0 to 5, where 0 means “remove all the digits east/north” and keep a 100km sided square, and 6 means “keep all the digits east/north” and keep a 1m sided square.
Summarizing, two rules R1 and R2 are both applicable to the same measurement if:
{R1, R2}.timeExpire ≥ currentTime R1.sensorType= R2.sensorType R1.validityArea⊆ R2.validityArea ,
where validityArea is the result of mask operation and ⊆ the geographical inclusion between square areas.
If a set R1, . . . , Rn of rules are all applicable in this way, server can answer the client
with the area defined by max{R1.spaceSampleGran, . . . , Rn.spaceSampleGran} and
timer
min{R1.timeSampleGran, . . . , Rn.timeSampleGran}.
Once obtained the minimum square, as described, is calculated a circular area, that is the circumscribed circle for this square, using the half of the diagonal as the circle’s radius. The center (in latitude and longitude coordinates) and the radius (in meter, of this circle) is finally sent to the client.
4.2
Mobile Application
Smartphones, body gadgets, but also car and other IoT devices, are increasingly a powerful set of environmental sensors too. They compose a perfect scenario for an MCS scenario. Here, I am going to present my deployment for a demonstrative mobile application sensing client, developed in Android environment.
Once started, the application checks the availability of the sensors we want to use for our crowdsensing purposes. Then, it starts all the routines to obtain constantly the necessary
4.2 Mobile Application 39
40 4. System Architecture
measurements of these sensors, most of which, are approachable only through asyn-chronous requests. For debugging purposes (nowadays temperature/humidity sensors are seldom included) I also developed a stub to provide mock measurements for un-available sensors in order to fully test the system. When a measurement is un-available, it is sent to the CCU through a lightweight CoAP request encapsulate in a JSON format, including other information, as we are going to see in the Implementation chapter. When the application performs the first start, all the data are sent almost simultaneously. When the CCU receives a request containing the JSON encoded data, as we saw in the previous section, it calculates a timer and a circle sized area identified through a center and a radius. Another JSON with these data is sent, as CoAP response, to the client. The client now can decode the JSON extracting timer to set the re-sending of the sensor measurement, and similarly, the geofencing area outside the which the re-sending will be triggered as well. We know that this circle area is calculated taking the finest grain rule matching the conditions as seen. Once taken the designed MGRS square delimiting the validity of the measurement, the center will be the MGRS 1 meter precision address (translated into latitude/longitude coordinates) and the radius will be the half of the di-agonal. Specifying, geofencing uses circle areas, hence CCU gets the circumscribed circle for each of the MGRS square areas, taking their half diagonals as radius for the client.
The sensors we consider in SenSquare are relative humidity, temperature (both hard to find on existing devices), barometer, light. Other measurements are ambient noise (through microphone), RSSI/BSSID/SSID of personal and public WiFi infrastructural networks the user is connected to, operator/RSSI/throughput of the cellular network the user is connected to. The latter is a kind of OpenSignal1 crowdsource stations
monit-oring. Throughput measuring, differently from the most of other measurements which happen constantly or asynchronously by the operating system, is done only when re-quested, reducing the power consumption and network utilization, that can, also, be monetarily expensive.
Each user can also subscribe one or more stakeholders. If the user does not choose to do that, CCU will answer to its requests only using the default rules (for example
4.2 Mobile Application 41
those inserted by the institution owning the system). Currently, each user can only choose to concede its sensing data in full to stakeholders subscribed. One of the fu-ture enhancement will be the possibility to choose each single sensor measurement for each stakeholder, giving to the user a finer grain permission setting. For instance, a user is willing to concede WiFi and cellular network data to its telephone company in exchange for some benefits, but he will not provide other kinds of measurements for the least privilege principle.
Chapter 5
Implementation
As we have seen in this document, SenSquare is composed of two main parts, a Central Coordination Unit (a MySQL database and a running Python server) and, currently, an Android sensing client. First of all, it has been designed and developed a basic Android application able to get all the requested measurements in different ways. Once this “draft” application was ready to run, the focus has been moved to the database implementation, with tables for rules, stakeholders, measurements and so on. The next step it has been the Python server, core of the system. It links the client measurements to the semantic logic and the database storing and retrieving. Finally, it has been developed the communication modules for both client and server in CoAP as debated along this document.
5.1
Central Coordination Unit
5.1.1
Database
The database, initially based on a simple SQLite to start the first test, it has been finally developed in MySQL and is, currently, composed of the following seven tables.
• sensors contains all the sensors we are interested in, comprehending their related information, such as a numeric identifier (mostly corresponding to the android sensor ID), name, unit of measure.
44 5. Implementation Sensor ID Unit Light 5 lux Pressure 6 hPa Humidity 12 % Temperature 13 ◦C Ambient Noise 100 ND WiFi 101 dB Telephone 102 dB
• all sensor data contains all the client sensing data coming from real environ-mental sensors (light, temperature, relative humidity, pressure) and microphones. This data are all homogeneous in terms of fields, they have a unique identifier, a user and sensor type identifier, a location (both in latitude/longitude and in MGRS), a timestamp and obviously, a value.
• all tel data contains all the data relative to telephony cells sensed by clients. They have the same field of the previous table, besides specific value like op-erator name, the strength of the signal, the technology used (2G, 3G, 4G) and throughput.
• all wifi data have the same characteristic of all tel data. but the values are the SSID, BSSID, the signal strength relative to the user current connection (if con-nected to a WiFi network).
• stakeholders contains all the information about entities, authorities, companies involved in the system as clients of the sensed raw data.
• rules contains all the rules as described in the previous chapter.
• subscription contains, finally, the references of the client subscriptions to the stakeholders. In a future development, this table will be enhanced with a finer grain filtering on the specific sensor to monitor.
5.1 Central Coordination Unit 45
5.1.2
Server
The whole server is developed in Python 3.4.3. It has been decided to rely on this language to evade from the common choices as PHP is, keeping a stable and high per-formance server-side. Python (especially in the chosen version 3) provides also a huge amount of libraries, and finally, supplies an easier way to rapidly build, even complex, architectures, with small constructs and highly readable code.
The server relies on many specific libraries, which have been chosen to address in an easier way the following issues.
• MySQL Connector is a standardized database driver for Python platforms and development1. This library is used to interface the server with the MySQL
data-base in the following easy manner:
1 i m p o r t m y s q l . c o n n e c t o r
2 c o n n = m y s q l . c o n n e c t o r . c o n n e c t ( u s e r =” u s e r ”, p a s s w o r d =” p a s s w ”,
d a t a b a s e =” db ”, h o s t =” h o s t ”)
3 c u r s o r = c o n n . c u r s o r ( )
4 r e s = s e l f . c u r s o r . e x e c u t e (”SELECT ∗ FROM t a b l e ”)
• MGRS coordinate conversion for Python is one of the rare libraries to deal with the Military Grid Reference System according to the UTM grid. This library is a wrapper for Python, actually written in C, compatible with the commonest and widest used CPython implementation (for Python3). This is an example, from the official documentation2about how it works in a nutshell:
1>>> i m p o r t mgrs 2 3>>> l a t i t u d e = 4 2 . 0 4>>> l o n g i t u d e = −93.0 5 6>>> m = mgrs .MGRS ( ) 7>>> c = m. toMGRS ( l a t i t u d e , l o n g i t u d e ) 8>>> c 9 ’ 15 TWG0000049776 ’ 10 1https://dev.mysql.com/downloads/connector/python/ 2https://pypi.python.org/pypi/mgrs
46 5. Implementation 11 >>> d = m. t o L a t L o n ( c ) 12 >>> d 13 ( 4 1 . 9 9 9 9 9 7 9 7 5 1 2 7 9 9 7 , − 9 3 . 0 0 0 0 0 0 0 0 0 0 0 0 0 1 4 ) 14 15 >>> y = ’ 3 2 1 9 4 2 . 2 9N ’ 16 >>> yd = m. d m s t o d d ( y ) 17 3 2 . 3 2 8 4 1 4 18 19 >>> d , m, s = m. d d t o d m s ( 3 2 . 3 2 8 4 1 4 ) 20 >>> d , m, s 21 ( 3 2 . 0 , 1 9 . 0 , 4 2 . 2 9 0 4 0 0 )
• Aiocoap3is a great Python implementation of Constrained Application Protocol
for our communication purposes, the fundamental part of this project to respect low battery consumption constraints. Aiocoap uses asyncio4 as the module that
provides infrastructure for writing single-threaded concurrent code using coroutines, multiplexing I/O access over sockets and other resources, running network clients and servers, and other related primitives.
• Other common and standard libraries concern random, time, json and strings op-erations.
The server consists of four modules, each of which fulfills specific duties, let us see more in detail.
Module - Query.py
This module provides an easy interface to database for other modules. It will be needed just to instantiate an object of Query class to rapidly get access to all the possible queries, from the basic CRUD operations to the most complex rule filtering calls.
1 # ## WHICHEVER MODULE ### 2 f r o m Query i m p o r t ∗ 3 4 q u e r y O b j = Query ( ) 5 s u b S t a k e s = l i s t( q u e r y O b j . g e t S u b s c r i b e d S t a k e h o l d e r s ( d a t a [’ u s e r ’] ) ) 6 q u e r y O b j . c l o s e ( ) 3https://github.com/chrysn/aiocoap 4https://docs.python.org/3/library/asyncio.html
5.1 Central Coordination Unit 47
When a Query object is instanced, a connection with the database is established as follow: 1 # ## CLASS QUERY ### 2 c l a s s Query : 3 c o n n = None 4 c u r s o r = None 5 6 d e f i n i t ( s e l f ) : 7 # Read c o n n e c t i o n i n f o r m a t i o n s f r o m a f i l e 8 db , u s e r , passw , h o s t = t u p l e(map(l a m b d a x : x . s t r i p (” \ n ”) . s p l i t ( ” : ”) [ 1 ] , o p e n(” a u t h . t x t ”, ” r ”) . r e a d l i n e s ( ) ) ) 9 s e l f . c o n n = m y s q l . c o n n e c t o r . c o n n e c t ( u s e r = u s e r , p a s s w o r d = passw , d a t a b a s e =db , h o s t = h o s t )
Now we can interface with the database through this object, finally, it is important to call the close() method, which terminates the connection with the database, closing the cursor and committing possible updates.
1 # ## CLASS QUERY ### 2 d e f c l o s e ( s e l f ) : 3 t r y: 4 s e l f . c u r s o r . c l o s e ( ) 5 s e l f . c o n n . commit ( ) 6 s e l f . c o n n . c l o s e ( ) 7 e x c e p t m y s q l . c o n n e c t o r . E r r o r a s e r r : 8 p r i n t (”DB ERROR : {} ”.f o r m a t( e r r ) )
This module contains many queries mostly for selecting, inserting, deleting rules, stake-holders, measurements and other complex specific queries functional for other modules. This is the most in-constant-evolution module of the project.
Module - utils.py
This module contains all the functions useful for other modules. Most of these functions regard tricky calculations for spatial and time constraints. MGRS conversion, spatial-belonging check, zone and timer calculations to answer the clients are implemented here.
For instance, the following is an interesting function, illuminating in understanding how the MGRS mask, debated above, is implemented to check sensing client belonging.
48 5. Implementation 1 # ## MODULE UTILS ### 2 d e f b e l o n g s t o ( zone , c o o r d , g r a n u l a r i t y ) : 3 # D i v i s i o n i n ”32T PQ 12345 1 2 3 4 5 ” 4 g r i d s q z o n e , b i g s q z o n e , x z o n e , y z o n e = z o n e [ : 3 ] , z o n e [ 3 : 5 ] , z o n e [ 5 : 1 0 ] , z o n e [ 1 0 : 1 5 ] 5 g r i d s q c o o r d , b i g s q c o o r d , x c o o r d , y c o o r d = c o o r d [ : 3 ] , c o o r d [ 3 : 5 ] , c o o r d [ 5 : 1 0 ] , c o o r d [ 1 0 : 1 5 ] 6 r e t u r n g r i d s q z o n e == g r i d s q c o o r d and \ 7 b i g s q z o n e == b i g s q c o o r d and \ 8 x z o n e [ 0 : g r a n u l a r i t y ] == x c o o r d [ 0 : g r a n u l a r i t y ] and \ 9 y z o n e [ 0 : g r a n u l a r i t y ] == y c o o r d [ 0 : g r a n u l a r i t y ] Module - routines.py
This module, currently, only contains a routine function to remove all the old rules. This means that all the rules with an expire time minor than the current timestamp will be deleted from the database. In the same way, all the rules with a number of related meas-urements greater than the requested amount in the countExpire field, will be deleted. It has been planned, as future works, a series of different routines implementing a ma-chine learning system. This system will be in charge of optimize the entire system performance, operating mainly on the rules, adapting in this way the sensing client be-havior in an intelligent and efficient way.
Module - server.py
This is the main module of the server, it is the point of access for sensing clients and the brain of the whole system, coordinating resources, database access, receiving and sending data.
As we have seen, first of all, it have been created the resource tree, identifying the exposed services: 1 # ## MODULE SERVER ### 2 d e f main ( ) : 3 [ . . . ] 4 # R e s o u r c e t r e e c r e a t i o n 5 r o o t = r e s o u r c e . S i t e ( ) 6 r o o t . a d d r e s o u r c e ( ( ’ s e n s i n g s e n d ’, ) , S e n s i n g S e n d ( ) )
5.2 Sensing Client Android 49 7 r o o t . a d d r e s o u r c e ( ( ’ g e t s u b s c r i p t i o n s ’ , ) , G e t S u b s c r i p t i o n s ( ) ) 8 r o o t . a d d r e s o u r c e ( ( ’ u p d a t e s u b s c r i p t i o n s ’ , ) , U p d a t e S u b s c r i p t i o n ( ) ) 9 r o o t . a d d r e s o u r c e ( ( ’ c a l c t h r o u g h p u t ’ , ) , C a l c T h r o u g h p u t ( ) ) 10 a s y n c i o . a s y n c ( a i o c o a p . C o n t e x t . c r e a t e s e r v e r c o n t e x t ( r o o t ) ) 11 a s y n c i o . g e t e v e n t l o o p ( ) . r u n f o r e v e r ( )
For each resource, it has been developed a class providing the service requested. All the calls are made through POST CoAP.
• SensingSend accept a JSON from the client containing a sensor measurement with the related location, time, user and sensor identifiers fields. After the rule ex-traction mechanism described previously, in this class it will be crafted a response with zone and timeout parameters for the next client update.
• GetSubscriptions answers the client with the list of stakeholders previously sub-scribed, given the user identifier. In future developments, this class will also add to the response which sensors for each stakeholder the user accepted the data access.
• UpdateSubscription accept a JSON containing the list of stakeholders the user subscribed. Once obtained this information, the database will be consequently updated.
• CalcThroughput only contains a mock method to accept a certain amount of no-sense data and answer an empty response. The semantic of this call is expressed on the next sensing send call for a cellular sensing measurement, which also will contain the value of the throughput estimated on the client-side, knowing the size of the sent packet (header plus body) and the time within which the process is completed.
5.2
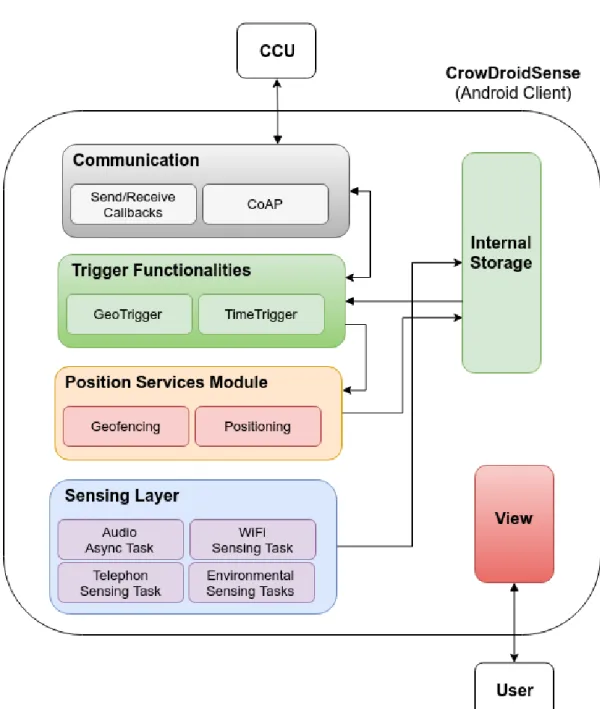
Sensing Client Android
As mentioned in the previous chapters, my mobile application implements a mixed form of participatory sensing because of user’s possibility to choose the stakeholders (and in future the single measurements too) to subscribe, and opportunistic sensing because
50 5. Implementation
of the background running nature of the applications itself. A user, once subscribed the preferred stakeholders, can forget the application running in background, while it senses and communicates with the CCU seamlessly.
Currently, the sensing client is available on Android platforms, compiled with SDK ver-sion 23, which also is the minimum target verver-sion. As we can in see in the build.gradle file it have been used many libraries.
1 d e p e n d e n c i e s { 2 c o m p i l e f i l e T r e e ( d i r : ’ l i b s ’, i n c l u d e : [’ ∗ . j a r ’] ) 3 t e s t C o m p i l e ’ j u n i t : j u n i t : 4 . 1 2 ’ 4 c o m p i l e ’ com . a n d r o i d . s u p p o r t : a p p c o m p a t −v7 : 2 3 . 4 . 0 ’ 5 c o m p i l e ’ com . g o o g l e . a n d r o i d . gms : p l a y −s e r v i c e s : 9 . 0 . 2 ’ 6 c o m p i l e ’ com . a n d r o i d . s u p p o r t : a p p c o m p a t −v7 : 2 3 . 1 . 1 ’ 7 c o m p i l e ’ de . u z l . i t m : ncoap−c o r e : 1 . 8 . 3 −SNAPSHOT ’ 8 c o m p i l e ’ o r g . s l f 4 j : s l f 4 j −a n d r o i d : 1 . 7 . 2 1 ’ 9 c o m p i l e ’ com . a n d r o i d . s u p p o r t : m u l t i d e x : 1 . 0 . 0 ’ 10 }
Just mentioning two libraries among them, Google Play Services, has been fundamental to obtain easy access to location services like device position and Geofencing, and Spit-Firefox5, based on CoAP Java implementation nCoAP6 that allows us, instead, to
im-plement the CoAP client functionalities for Android applications.
Android development highly relies on asynchronous calls and tasks. Many methods are invoked through an Intent call where a specific event is triggered or a preparatory task is completed. This is true especially in this case, where most of the work is done, for instance, when a CoAP request is answered, a sensing measurement is ready and it is given to us from the system, when a Geofencing event is triggered because the user is entered/exited/dwelling into/from/within an area. Navigate into the code, also because of this intrinsic aspect could be tricky, let us more in detail how the application is structured.
5.2.1
The View
As a case of study, the application is composed of two simple screens.
5https://github.com/okleine/spitfirefox 6https://github.com/okleine/nCoAP
5.2 Sensing Client Android 51
![Figure 1.1: A Smart City portrayal [6]](https://thumb-eu.123doks.com/thumbv2/123dokorg/7432157.99709/9.892.184.729.534.838/figure-a-smart-city-portrayal.webp)
![Figure 2.1: CoAP packet [9]](https://thumb-eu.123doks.com/thumbv2/123dokorg/7432157.99709/13.892.177.731.634.807/figure-coap-packet.webp)
![Figure 2.2: A typical architecture using CoAP [9]](https://thumb-eu.123doks.com/thumbv2/123dokorg/7432157.99709/15.892.198.709.163.451/figure-a-typical-architecture-using-coap.webp)
![Figure 2.3: Geofencing modalities [11]](https://thumb-eu.123doks.com/thumbv2/123dokorg/7432157.99709/16.892.262.667.366.775/figure-geofencing-modalities.webp)
![Figure 2.4: UTM grid example with zone 19 [15].](https://thumb-eu.123doks.com/thumbv2/123dokorg/7432157.99709/18.892.323.607.564.958/figure-utm-grid-example-zone.webp)

![Figure 3.1: MCSC taxonomy [2]](https://thumb-eu.123doks.com/thumbv2/123dokorg/7432157.99709/23.892.139.691.329.830/figure-mcsc-taxonomy.webp)
![Figure 3.2: MCS Categorization [2]](https://thumb-eu.123doks.com/thumbv2/123dokorg/7432157.99709/25.892.141.719.482.650/figure-mcs-categorization.webp)
![Paolo Rumiz, Appia, Milano, Feltrinelli, 2016. [Recensione]](data:image/gif;base64,R0lGODlhAQABAIAAAP///wAAACH5BAEAAAAALAAAAAABAAEAAAICRAEAOw==)