1 2 3 4 5 6 7 8 9 10 11 12 13 14 15 16 17 18 19 20 21 22 23 24 25 26 27 28 29 30 31 32 33 34 35 36 37 38 39 40 41 42 43 44 45 46 47 48 49 50 51 52 53 54 55 56 57
Exploring the Molecular Mechanisms Underlying the
in vitro Anticancer Effects of Multitarget-Directed
Hydrazone Ruthenium(II)–Arene Complexes
Massimiliano Cuccioloni
+,*
[a]Laura Bonfili
+,
[a]Valentina Cecarini,
[a]Massimo Nabissi,
[b]Riccardo Pettinari,
[b]Fabio Marchetti,
[c]Riccardo Petrelli,
[b]Loredana Cappellacci,
[b]Mauro Angeletti,
[a]and Anna Maria Eleuteri
[a]The molecular targets and the modes of action behind the cytotoxicity of two structurally established N,O- or N,N-hydrazone ruthenium(II)–arene complexes were explored in human breast adenocarcinoma cells (MCF-7) and paralleled in non-cancerous and cisplatin-resistant counterparts (MCF-10A and MCF-7CR respectively). Both complexes, [Ru(hmb)(L1)Cl] (1, L1 = 4-((2-(2,4-dinitrophenyl)hydrazono)(phenyl)methyl)-3-meth-yl-phenyl-1H-pyrazol-5-olate) and [Ru(cym)(L2)Cl] (2, L2 = 1-((3-methyl-5-oxo-1-phenyl-1H-pyrazol-4(5H)-ylidene)(phenyl) methyl)-2-(pyridin-2-yl)hydrazin-1-ide), reversibly interact with
moderate-to-high affinity with a number of molecular targets in cell-free assays, namely serum albumin, DNA, the 20S protea-some and hydroxymethylglutaryl-CoA reductase. Most interest-ingly, only 2 readily crosses the cell membrane and preserves its binding/modulatory ability toward the targets of interest upon rapid cellular internalization. The resulting action at multiple levels of the cancer cascade is likely the cause for the selective sensitization of tumour cells to p27-mediated apop-totic death, and for the ability of 2 to overcome the drug resistance problem.
Introduction
Conventional treatments of cancer (one of the leading causes of death in developed countries[1]
) include radiotherapy,[2] surgery,[3]
and chemotherapy,[4]
with targeted therapies being available for some cancer types.[5]
In this context, irrespective of the significant success rate of drug-based treatment, clinical data show that patients treated with a single-target therapy can develop drug resistance and suffer relapses, demonstrating that targeting a unique molecule may not be sufficient for the effective eradication of the disease.[6]
Additionally, several effective drugs, platinum-containing molecules in particular,[7] are frequently associated with severe side-effects.[8]
In the last decades, ruthenium complexes emerged as promising alter-native metal-based anticancer agents, and some ruthenium(III)
compounds have reached various stages of clinical trials.[9] More recently, the development of organometallic ruthenium(II)-arene compounds opened a new avenue to different metal-lodrug scaffold.[10]
We have contributed in this field with many examples of N,N-,[11]
N,O-[12]
and O,O-chelating ligands.[13] One way for fine-tuning the properties of ruthenium(II)–arene complexes is to conjugate an organic ligand of known bio-logical function to the organometallic fragment.[14]
In this perspective, hydrazones gained prominence in medicinal chemistry due to their wide range of activities, having been screened for their antioxidant,[15]
anti-inflammatory,[16] anticonvulsant,[17] analgesic,[18] antimicrobial,[19] antiparasitic,[20] antitubercular,[21] anti-HIV,[22]
and anticancer properties.[23] Since metal complexation can further improve intrinsic properties of biologically active ligands,[24]
our interest focused on ruthenium (II)-arene hydrazone complexes and their biological and pharmacological properties, and we recently synthesized a group of arene-Ru-hydrazone complexes with cytotoxicity toward a panel of human cancer cells.[25]
Herein, in the presence of the emerging evidence that demonstrates the multitarget nature of ruthenium complexes[26] (these molecules being shown not only to target DNA,[27] but also enzymes,[28] other functional proteins,[29] and cellular organelles[30]), we further explored the molecular mechanisms underlying the observed effects exerted by the most and the least efficient metal complexes of the series on human breast adenocarcinoma cell line, to dissect the role of the chemical modifications in establishing the optimal cytotoxic potential of the ruthenium-hydrazone complexes.
[a] Dr. M. Cuccioloni,+Dr. L. Bonfili,+Dr. V. Cecarini, Prof. M. Angeletti, Prof. A. M. Eleuteri
School of Biosciences and Veterinary Medicine University of Camerino
Via Gentile III da Varano 62032 Camerino (Italy)
E-mail: [email protected]
[b] Prof. M. Nabissi, Prof. R. Pettinari, Prof. R. Petrelli, Prof. L. Cappellacci School of Pharmacy
University of Camerino Via S. Agostino 1 62032 Camerino (Italy) [c] Prof. F. Marchetti
School of Science and Technology University of Camerino
Via S. Agostino 1 62032 Camerino (Italy)
[+] These authors contributed equally to this work.
Supporting information for this article is available on the WWW under https://doi.org/10.1002/cmdc.201900551
1 2 3 4 5 6 7 8 9 10 11 12 13 14 15 16 17 18 19 20 21 22 23 24 25 26 27 28 29 30 31 32 33 34 35 36 37 38 39 40 41 42 43 44 45 46 47 48 49 50 51 52 53 54 55 56 57
Results and Discussion
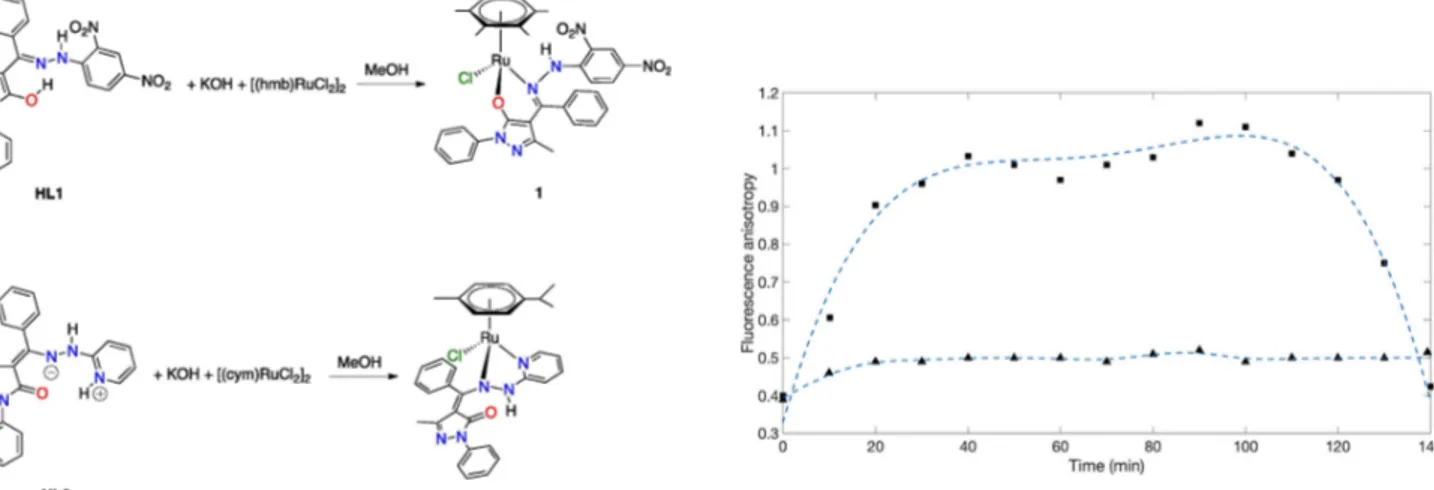
Complexes 1 and 2 were synthesized according to a previously reported method (Scheme 1).[25]
Their stability in the presence of DMSO-d6 was first evaluated. 1 and 2 were dissolved in pure deuterated dimethyl sulfoxide (1 mM) and spectra at t = 0 h, 24 h, 48 h, 120 h were recorded (Figures S1 and S2). Complex 1 is stable under these conditions although the formation of cationic 1 a species, with a coordinate DMSO molecule replacing the chloride, can be observed after 120 h. Further confirmation to the formation of 1 a is provided by the addition of an equimolar quantity of AgSO3CF3 which shifts the equilibrium toward the cationic species (Figure S1). Complex 2 is less stable than 1 under the same conditions. Indeed, the formation of cationic species 2 a and of tautomeric form 2 b occurs already after 24 h (Figure S2). In this case also the addition of an equimolar quantity of AgSO3CF3completely shifts the equilibrium toward the cationic species 2 a. It is worth noting that complexes 1 and 2 do not decompose in pure DMSO-d6 at millimolar concentration and the complexes are stable for 24 h in cell culture media, the final DMSO concentration being lower than 1.0 %v/v(Figure S3).
Cell membrane permeability. 1 and 2 passages across the cell membrane were paralleled by monitoring the changes in membrane fluidity using trimethylammonium diphenylhexa-triene (TMA-DPH) fluorescent probe. Upon incorporation into the lipid–water interface of the cell membrane, TMA-DPH fluorescence properties reflect the dynamics of the surface: specifically, TMA-DPH steady-state emission anisotropy data can be interpreted as snapshots in time of the average lipid packaging density, which in turn is related to membrane viscosity (measured anisotropy value (r) is inversely related to membrane fluidity). MCF-7 cells treated with 1 showed a rapid but minor increase in emission anisotropy peaking at 20 min that persisted during data acquisition interval. This behavior is representative of the slow and poor internalization of the compound, most likely due to its higher polarity and conse-quent ability to form a higher number of intermolecular
H-bonds with water molecules.[31]
Conversely, the addition of 2 caused an initial increase in emission anisotropy with signifi-cantly higher steepness compared to 1, which peaked at 40 min and persisted for additional 60 min before restoring initial conditions, demonstrating that 2 was internalized more efficiently within cells (Figure 1).
Cell cycle. In line with previously reported evidences on cytotoxicity, cell cycle analysis of MCF-7, MCF-7CR and MCF-10A cells treated with 40 μM or 65 μM of 1 and 2 (these concentrations corresponding to the IC50 values of 2 against MCF-7 and MCF-7CR, respectively)[25]
revealed a significant inhibition of cell cycle at G1 phase in MCF-7 cell lines, while no effect was observed in MCF-10A cells. Specifically, in MCF-7 cells the G1 peak represents 68.2 % of the cell cycle phases, while in MCF-10A the G1 peak was comparable to that observed in vehicle- (DMSO) (38.7 % vs 35.9 %, respectively). In MCF-7CR cells, 2 induced the increase both of G1 and (mainly) sub-G1 phases (hypodiploid nuclei, a signal of cell death) compared with 2-treated MCF-10A cells, indicating that 2 induced cell cycle inhibition and cell death in MCF-7CR cell line (Figure S4). No significant effect on the cell cycle was evident in 1-treated cell lines (data not shown).
DNA binding – kinetics of binding. DNA is an established target for chemotherapeutics,[32]
metal-based anticancer agents in particular. The DNA binding ability of 1 and 2 was evaluated using a previously presented biosensor-based approach, which exploits the interaction between a surface-blocked DNA probe and the soluble molecules of interest.[33]
Both molecules showed a moderate affinity for DNA, with equilibrium dissociation constants in the low-to-sub micromolar range. Additionally, the mono-exponential binding kinetics (Figure S5) proved the ability of tested compounds to specifi-cally and reversibly target DNA on a specific site (the biphasic model was statistically nonsignificant at 95 % confidence, as assessed by a standard F-test procedure).
The comparison of the binding kinetics of 1 and 2 revealed that the interaction of 1 with DNA is kinetically and thermody-namically promoted, as shown by the approximately 6-fold higher value of association kinetic constant and 4-fold lower value of the equilibrium dissociation constant (Table 1).
Scheme 1. Synthetic procedures of 1 and 2.
Figure 1. Comparative changes in emission anisotropy with time observed
1 2 3 4 5 6 7 8 9 10 11 12 13 14 15 16 17 18 19 20 21 22 23 24 25 26 27 28 29 30 31 32 33 34 35 36 37 38 39 40 41 42 43 44 45 46 47 48 49 50 51 52 53 54 55 56 57
DNA binding – competitive binding. To map the binding sites for 1 and 2 on DNA, we performed three distinct competitive assays using two established DNA binders (DAPI and methyl green), and a DNA intercalator (EtBr).
Globally, both compounds were capable of selectively forming a complex with DNA at the minor groove, as proved by the concentration-dependent decrease in fluorescence intensity of DNA-DAPI complex (Figure 2). Conversely, no significant decrease in the absorbance/fluorescence of methyl green-DNA and EtBr-DNA complexes were observed (Figure S6).
Docking studies. A geometric docking approach based on local shape feature matching algorithm was performed to computationally predict the binding modes of both Ru-complexes to DNA.
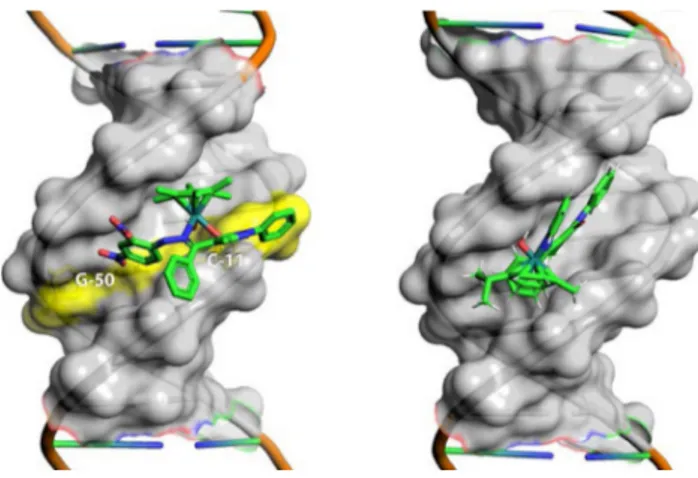
Consistently with the experimental results from competitive binding assays, 1 and 2 were predicted to bind DNA specifically at the minor groove, being the hydrazone moiety the major discriminants in establishing the binding geometry. Specifically, 1 showed a partial insertion within the minor groove, since dinitrobenzene, hexamethylbenzene and the ancillary ligand of 1 accommodated within the cleft. The resulting complex was predicted to form two H-bonds with a guanosine (G-50) and a cytidine (C-11) nucleotides. Conversely, 2 accommodated the whole hydrazone moiety longitudinally along the minor groove, and the p-cymene group pointed outside the complex approx-imately with a 90°offset rotation. No H-bond was predicted to
be formed between 2 and the DNA molecule, consistently with the nearly four-fold lower affinity observed in binding experi-ments.
The best scoring predicted complexes with DNA are shown in Figure 3 and the energy contributions to the stabilization of both complexes are provided in Table 2.
Inhibition of HMGR activity. HMG-CoA reductase rate-regulates the production of sterols and isoprenoids in the mevalonate pathway. These molecules are fundamental sub-strates for tumour growth and progression, and statins (potent inhibitors of HMGR, and established cholesterol-lowering drugs) have been successfully used as non-conventional anticancer agents,[34]
unequivocally proving the role of sterols in fueling cancer cell-growth processes.[35]
Available evidences reported the enhancement of HMGR inhibitory potency of small ligands upon Ru-complexation,[36] and an inhibitory activity displayed by other metals belonging to same group.[37]
In line with these findings, we showed that 1 and 2 targeted human HMGR at cofactor site with high affinity (Figures S7-S8, S10) and inhibited the reductase with statin-like potency (Figure 4),[38]
at the nanomolar level (Table 3).
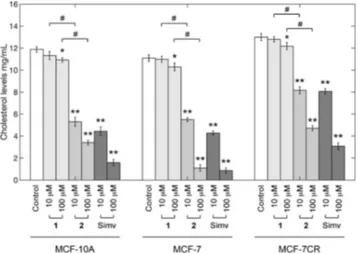
Cholesterol-lowering effect. On the strength of the in vitro HMGR inhibitory activity of 1 and 2, we determined their effects on cytoplasmic cholesterol concentration in MCF-7, MCF-10A and MCF-7CR cell lines after individual treatment for 4 h with 1 and 2 at 10–100 μM.
Table 1. Kinetic and equilibrium parameters of 1 and 2 binding to
surface-blocked DNA.
kass(M 1s 1) kdiss(s1) KD(μM)
1 (1.52 � 0.25) × 105 0.059 � 0.028 0.39 � 0.19
2 (2.63 � 0.68) × 104 0.036 � 0.008 1.36 � 0.46
Figure 2. Changes in fluorescence emission spectra of DAPI-DNA complex
(black curves) solution upon excitation at 338 nm in the presence of increasing concentration of 1 (left panel) and 2 (right panel) in the range 0– 100 μM (control, black line; 1 or 2 10 μM, blue line; 1 or 2 20 μM, purple line;
1 or 2 50 μM, red line; 1 or 2 100 μM, green line).
Figure 3. Snapshot of the best scoring complexes formed upon docking 1
(left) and 2 (right) on dsDNA. Minor groove is emphasized as transparent grey surface; nucleotides involved in the formation of H-bonds are labeled and visualized as solid yellow sticks. Images were rendered with PyMOL 2.2.3.
Table 2. Energy contribution to the stabilization of 1-DNA and 2-DNA
complexes expressed as kcal/mol (aVdW, rVdW: softened attractive and repulsive van der Waals energy; ACE: atomic contact energy; Inside: insideness measure).
Total Energy aVdW rVdW ACE Inside
1-DNA 58.33 21.57 20.99 17.57 7.64
2-DNA 60.79 23.27 7.48 23.49 8.16
Table 3. Kinetic, equilibrium and inhibitory parameters of 1 and 2 binding
to HMGR.
kass(M1s 1) kdiss(s1) KD(nM) Ki(nM)
1 (1.5 � 0.7) × 105 0.015 � 0.001 100.0 � 65.2 113.0 � 32.1
1 2 3 4 5 6 7 8 9 10 11 12 13 14 15 16 17 18 19 20 21 22 23 24 25 26 27 28 29 30 31 32 33 34 35 36 37 38 39 40 41 42 43 44 45 46 47 48 49 50 51 52 53 54 55 56 57
Consistent with the data on cell internalization and with the observed inhibition of HMGR activity, the results showed a dose-dependent decrease of cytoplasmic cholesterol upon a single short-term treatment with 2 fully comparable to commercially available simvastatin. On the other hand, com-pound 1 showed a minor but still significant effect only at the highest dosage.
No significant difference was observed between cancer and normal control cells (Figure 5).
Proteasome inhibition. Proteasomes express four major hydrolytic activities, each associated to specific subunits (chymotryptic activity involves the cleavage after hydrophobic residues, and is mainly associated to β5 subunit; tryptic activity involves the cleavage after basic residues, and is mainly associated to β2 subunit; PGPH (caspase) activity involves the cleavage after acidic residues, and is mainly associated to β1 subunit; BrAAP involves the preferential cleavage of branched chain residues, and is associated to β1 and β5 subunits).[39]
Since the interference with normal 20S proteasome function is a possible cause of apoptosis triggering[13c,33]
, we evaluated the effects exerted by 1 and 2 on proteasome activities. 1 and 2 significantly inhibited all proteasome catalytic activities in a concentration dependent manner, even if to different extents (Figure 6).
Figure 4. Residual activity plot of HMGR in the presence of increasing
concentrations of 1 (~) and 2 (*).
Figure 5. Effect of 1 and 2 on cellular cholesterol levels. Cytoplasmic
cholesterol was measured in MCF-10A, MCF-7 and MCF-7CR cells using AmplexRed Cholesterol Assay kit upon 4 h treatment with 10–100 μM of 1 and 2 compared to equimolar treatment with simvastatin (*p < 0.05 and **p < 0.01 and with the control (vehicle) by ANOVA;#p < 0.05 compared with
the HL ligand by ANOVA; ANOVA was always followed by post hoc Holm-Sidak test).
Figure 6. Inhibition of 20S proteasome proteolytic activities by 1 (~) and 2
1 2 3 4 5 6 7 8 9 10 11 12 13 14 15 16 17 18 19 20 21 22 23 24 25 26 27 28 29 30 31 32 33 34 35 36 37 38 39 40 41 42 43 44 45 46 47 48 49 50 51 52 53 54 55 56 57
Differential subunit specificity is commonly observed for proteasome inhibitors.[40]
Globally, our data demonstrated significant difference between 1 and 2 in terms of (i) higher hydrophobic properties of 2 with respect to 1, (ii) higher acidic properties of 1 with respect to 2, and comparable basic properties.
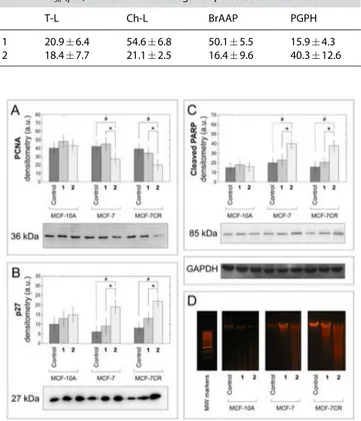
IC50values of 1 and 2 for ChT L, T L, BrAAP, and PGPH are summarized in Table 4.
Proliferation and apoptotic markers. To dissect the molec-ular basis for both the arrest of cell proliferation and the initiation of apoptosis in response to the suppression of mevalonate and proteasome pathways and to DNA damage, the levels of some key proliferative and apoptotic markers, namely PCNA and PARP, were measured upon treatment with 1 and 2 and paralleled in the three cell lines of interest (Figure 9). Generally, no significant changes in the levels of selected markers were observed upon cell treatment with either vehicle (DMSO 1 %) or 1. Conversely, the decreased in the levels of PCNA, a protein enabler of replicative immortality and an established marker of cell proliferation in human cancers,[41] confirmed the ability of 2 to arrest MCF-7 and MCF-7CR cells proliferation, in line with the effects observed on cell cycle and with decreased levels of cellular cholesterol upon treatment
with 2.[42]
No significant changes in PCNA levels were observed in MCF-10A non-cancerous counterpart (Figure 7, Panel A). Similarly, DNA fragmentation occurred exclusively in MCF-7 and MCF-7CR cell lines after treatment with 2 for 24 h (Figure 9, Panel C). Under these conditions of extensive DNA damage, caspase-3 cleaves poly-(ADP)-ribose polymerase (PARP, an enzyme involved in the repair of damaged DNA) to the inactive 85 kDa fragment, thus preventing DNA repair and triggering apoptosis. Based on this premise and in agreement with the selective fragmentation of DNA of cancer cells (Figure 7, Panel D), 85 kDa PARP fragment accumulated only in MCF-7 and in MCF-7CR cells treated with 2 (Figure 7, Panel C). Insignificant changes in PARP levels were observed in non-cancerous counterpart.
Additionally, p27, besides being a proteasome substrate, is also involved in the apoptotic cascade and its increase promotes the activation of pro-apoptotic events.[43]
Here, in agreement with the proteasome inhibition and with the ability to efficiently cross cell membrane displayed by 2,[44]
we showed p27 to accumulate selectively in MCF-7 and in MCF-7CR (Figure 7, Panel B). No significant changes in p27 levels occurred in MCF-10A cells. Collectively, cell-based evidences suggested apoptosis as the mechanism of 2-triggered cell death, the event being cell cycle dependent. Most importantly, in line with the observed preservation of cell viability, neither the activation of the apoptotic pathway nor the arrest of cell proliferation was reported in MCF-10A cells upon 2 treatment, confirming the higher adaptability on normal cells to transient perturbations, such as their ability to survive and recover from reversible proteasome[45]
and HMGR[46]
inhibition.
BSA binding. The physiological role of serum albumin in drug transport is widely established. The binding ability of 1 and 2 toward bovine serum albumin (here used instead of HSA, due to their high structural similarity)[47]
was qualitatively evaluated according to fluorometric and biosensor assays.
Upon excitation of the tryptophan residue at 295 nm, fluorescence emission spectra were recorded in the range 340– 600 nm after independent additions of both complexes.
1 and 2 bound BSA and quenched (to a comparable extent) its intrinsic fluorescence emission in a concentration-dependent manner (Figure 8). Next, the interaction between 1 and 2 complexes and BSA was quantitatively characterized using a
Table 4. IC50(μM) values for 1 and 2 against proteasomal activities.
T-L Ch-L BrAAP PGPH
1 20.9 � 6.4 54.6 � 6.8 50.1 � 5.5 15.9 � 4.3 2 18.4 � 7.7 21.1 � 2.5 16.4 � 9.6 40.3 � 12.6
Figure 7. Apoptotic events: MCF-7, MCF-7CR and MCF-10A cells were treated
with either 50 μM 1 or 2 for 24 h as described in the Material and Methods Section. Changes in cellular PCNA, p27 and PARP levels are shown in panel A, B and C, respectively. Results are representative of three distinct experiments. Data points marked with an asterisk or hashtag are statistically significant relative to internal respective controls (*p < 0.05). Equal protein loading was verified by using an anti-GAPDH antibody. DNA fragmentation assay upon 24 h treatment: samples were resolved by 1.8 % agarose gel electrophoresis, stained with EtBr (Panel D).
Figure 8. Changes in fluorescence emission spectra of BSA (black curves)
upon titration with 1 (Panel A) and 2 (Panel B) in the range 0–100 μM (control, black line; 1 or 2 10 μM, blue line; 1 or 2 20 μM, purple line; 1 or 2 50 μM, red line; 1 or 2 100 μM, green line).
1 2 3 4 5 6 7 8 9 10 11 12 13 14 15 16 17 18 19 20 21 22 23 24 25 26 27 28 29 30 31 32 33 34 35 36 37 38 39 40 41 42 43 44 45 46 47 48 49 50 51 52 53 54 55 56 57
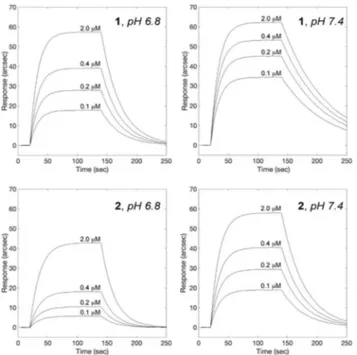
biosensor-based assay (Figure 9 and Table 5). We reported both interactions to be reversible, with a general affinity for BSA in the sub-micromolar range in blood-like pH (higher for 1, due to more favorable electrostatic interactions, as shown in Figure S9), and geometric docking analyses predicted both complexes to insert with minor differences in a cleft between domains IB and IIIA of BSA, in close proximity to Trp-213 (the tryptophan residue responsible for the intrinsic fluorescence of BSA – Figure S11). Additionally, we demonstrated the affinities of both complexes to change with pH, with a general 3-fold decrease at pH 6.8 (Table 5), a value in line with the extracellular pH of tumour tissues.[48]
These data were of particular interest, as the pH-dependent affinity of 1 and 2 for serum albumin could help their transport in the blood and favor the release of the candidate Ru drugs in proximity of the tumour cell target.
Conclusions
Multitarget drugs are emerging as effective therapeutics in the treatment of diseases where single-target drugs frequently fail to achieve optimal results such as in cancer.
In this study, two rationally designed organometallic hydrazone ruthenium(II)–arene complexes confirmed their promising therapeutic potential. They were shown to reversibly interact with albumin and bind different oncotargets, such as HMGR, the proteasome, and DNA, to an extent comparable to other Ru(II) organometallic compounds. Cell membrane perme-ability was critical in determining the difference in cytotoxic efficacy in vitro of the two Ru-complexes investigated. Specifi-cally, the mechanism behind the cytotoxic effect of 2 began with the internalization of the molecule by passive transfer in a relatively short time interval (approx. 120 min).
Consequently, 2 (but not 1) induced the partial inhibition of cell cycle progression in G0/G1 phase, and the consequent accumulation of cells in G1 and G1/subG1 phases, in MCF-7 and MCF-7CR cells, respectively. These events afforded apoptosis likely as a result of independent pro-apoptotic mechanisms, namely DNA damage, HMGR-induced arrest of cholesterol synthesis and the accumulation of proteasome substrates. Most interestingly, the multitarget nature of 2 was evident in MCF-7CR cells, in which apoptosis was triggered irrespective of the acquired resistance to a DNA-targeting drug (cisplatin) and the plausible initiation of alternative signaling pathways.
Limited to cancerous cells, we observed decreased levels of the tumour marker PCNA, and accumulation of 85 kDa PARP fragment and p27 in MCF-7 and MCF-7CR cells. All these events supported the selective triggering of apoptosis, and confirmed the ability of normal cells to recover from transient suppression of proteasome and HMGR pathways and to evade cell death.
Collectively, these results provide further evidences support-ing the possibility of tunsupport-ing up the native properties of biologically active compounds via Ru(II) modification, 2 repre-senting a promising multitarget candidate for the treatment of complex diseases such as cancer.
Experimental Section
Fluorescence anisotropy measurements. TMA-DPH probe (λexc=
340 nm; λem=460 nm) was used to monitor the changes in
membrane fluidity[49] of MCF-7 cells independently treated with
either 10 μM 1 or 2. Anisotropy measurements were carried out in an RF-5301PC Shimadzu spectrofluorometer in a thermostated cell
holder. In detail, 1.5 × 10⁵ MCF-7 cells per mL were individually
incubated with the compounds, and 1 μM TMA-DPH was added at
37°C. Fluorescence anisotropy (r) was measured for 150 min, and
was calculated from the following equation as previously reported elsewhere:[13c]
r ¼ 2P
3 P
Fluorescence polarization (P) was derived using the equation:
P ¼Ij I? IjþI?
with Ij and I⊥ being the fluorescence intensities parallel and
perpendicular to the excitation beam, respectively. Figure 9. Superimposition of sensor traces showing association kinetics of 1
and 2 to surface-blocked BSA. Panels A and B report the association curves obtained for 1 binding to BSA at pH 6.8 and 7.4, respectively. Panels C and D report the association curves obtained for 2 binding to BSA at pH 6.8 and 7.4, respectively.
Table 5. Kinetic and equilibrium parameters of 1 and 2 binding to
surface-blocked BSA at pH 6.8 and 7.4.
kass(M1s1) kdiss(s1) KD,(μM)
1 pH 6.8 117643 � 37531 0.031 � 0.010 0.27 � 0.12 pH 7.4 154474 � 27671 0.014 � 0.005 0.09 � 0.04 2 pH 6.8 43529 � 16739 0.045 � 0.004 1.03 � 0.41 pH 7.4 108919 � 42017 0.026 � 0.011 0.24 � 0.14
1 2 3 4 5 6 7 8 9 10 11 12 13 14 15 16 17 18 19 20 21 22 23 24 25 26 27 28 29 30 31 32 33 34 35 36 37 38 39 40 41 42 43 44 45 46 47 48 49 50 51 52 53 54 55 56 57
Cell cycle analyses. MCF-7, MCF-7CR and MCF-10 cell lines (4 ×
104cells/mL) were independently incubated with 1, 2 or vehicle
(DMSO), at the appropriate concentration, for 48 h. Then, cells were fixed for 1 h by adding one mL of ice-cold 70 % ethanol and then
washed with staining buffer (PBS, 2 % FBS and 0.01 % NaN3). After
that, the cell lines were treated with 100 μg/mL ribonuclease A
solution (Sigma Aldrich), incubated for 30 min at 37°C, stained for
30 min at room temperature with propidium iodide (PI) 20 μg/mL (Sigma Aldrich) and analyzed on a FACScan flow cytometer using CellQuest software.
DNA binding. A biosensor-based assay was used to test the DNA
binding ability of 1 and 2. dsDNA sensing surface was obtained as
previously described.[33] Briefly, the carboxylate surface was
acti-vated by addition of an equimolar mixture of N-hydroxysuccinimide
and N-ethyl-N-(dimethylaminopropyl)carbodiimide
hydrochloride.[50] Streptavidin was dissolved in 10 mM CH
3COONa
buffer pH 5, and then anchored to the carboxylic surface. Free carboxylic sites on the sensor surface were deactivated by injection of 1 M ethanolamine, pH 8.5. Finally, 5’-biotinylated dsDNA (se-quence: 3’-CCACCCACTACCCTGGTTGGATGCTAATGT-5) was coupled to surface-blocked the streptavidin. The compounds of interest were independently added to the DNA coated surface at different concentrations, each time following binding kinetics up to equili-brium. Dissociation steps were performed by a single 1 min wash (80 μL) with fresh PBS buffer, whereas free DNA surface regener-ation was achieved by serial PBS washes (the number of washing cycles depending on the interaction strength), each time assessing the recovery of free DNA baseline prior to any further addition of the ruthenium compounds. Raw data were globally fitted to both mono- and bi-exponential models, and the validity of each model to fit time courses was assessed by a standard F-test procedure.
Competitive binding assays. Three distinct displacement assays
were used to map the preferential binding site of DNA for 1 and 2: specifically, DNA molecules were independently labelled with DAPI (a minor groove binder), methyl green (a major groove binder), and
EtBr (an intercalating agent) as previously reported,[33]and
individ-ual DNA complexes were challenged with increasing concentration of 1 and 2. Briefly, DAPI displacement was monitored by recording the emission spectra of solutions containing different concentra-tions of both Ru(II)–arene complexes (0–100 μM), DNA (20 μM), and DAPI (15 μM) in phosphate buffer (10 mM, pH 7.4). Methyl green displacement assay was performed by monitoring the absorbance at 630 nm upon addition of candidate competitors. Specifically, EtBr displacement was performed by recording the changes in the emission spectra of solutions containing different concentrations of Ru(II)–arene complexes (0-100 μM), DNA (20 μM), and EtBr (10 μM) in phosphate buffer (pH 7.4). All experiments were run at room temperature.
DNA docking analysis. The predictive models of 1-DNA and 2-DNA
complexes were computed by independently docking the ligands onto 3’-CCACCCACTACCCTGGTTGGATGCTAATGT-5’ dsDNA oligonu-cleotide (both ligands and target oligomer were prepared and
energy minimized using Avogadro[51]). Rigid geometric docking was
performed using PatchDock server,[52] 1 or 2 and DNA being
uploaded as ligand and receptor, respectively, and FireDock[53]was
used for interaction refinement. Settings were always kept to default values. The best scoring complex and images were rendered with PyMOL (The PyMOL Molecular Graphics System, Version 2.2.3 Schrödinger, LLC).
HMGR binding. HMGR surface was prepared as reported
elsewhere.[54]Surface-blocked HMGR was tested for binding to the
compounds of interest at different concentrations in the range 10– 1000 nM. The preservation of the native-like conformation/function-ality of the enzyme upon immobilization and the identification of
the site of binding for Ru complexes was assessed using HMGR physiological ligands, namely HMG and NADPH. The biosensor
chamber was thermostated at 37°C throughout. Raw data were
analysed with mono- and bi-exponential models, the validity of each model to fit time courses being assessed by F-test procedure.
HMGR inhibition. The anti-HMGR effect of 1 and 2 was established
according to a chromatographic method described elsewhere.[55]
Briefly, HMGR residual activity was monitored upon 60 min pre-incubation of the isolated human reductase (0.4 mM) with
increas-ing levels of both compounds (in the range 10 8–10 3M). The
reaction was started by addition of 1.55 mM HMG-CoA and
2.68 mM NADPH, and additionally stored for 60 min at 37°C. The
resulting mixture was separated with a Phenomenex Luna C18
reverse phase (RP)-HPLC column at 26 � 0.1°C, following both the
decrease in HMG-CoA/NADPH consumption and mevalonate/
NADP+ production rates. Residual activities were calculated from
raw data using a standard model for reversible competitive inhibition.[54]
Cytoplasmic cholesterol levels. Cytoplasmic levels of cholesterol in
MCF-7, MCF-7CR and MCF-10 A cells upon treatment were deter-mined to assess the effective cholesterol-lowering capacity of 1 and
2. After 4 h incubation at 37°C in the presence of 10 and 100 mM of each compound, cells were trypsinized, washed with PBS, and pelleted at 8000 × g for 5 min. For each sample, cytoplasmic cholesterol levels were determined using AmplexRed Cholesterol Assay kit. Briefly, the pellets were suspended in 40 mL of 1 × reaction buffer and lysed with a 29G syringe. The working solution, containing Amplex® Red reagent (300 mM), horseradish peroxidase (2 U/mL), cholesterol oxidase (2 U/mL), and cholesterol esterase (0.2 U/mL) in 1 × reaction buffer was freshly prepared before each experiment. Cholesterol calibration curve was generated using serial dilutions of cholesterol reference standard (5.17 mM) in 1 × reaction buffer. 50 mL of working solution, 40 mL of 1 × reaction buffer and 40 mL of cell lysates were placed in a 96-well plate and
incubated at 37°C for 30 min. After 4 h, fluorescence measurements
were recorded (λexc=540 nm, λem=590 nm) using a SpectraMax
Gemini XPS microplate reader (Molecular Device, Milan – Italy).
Proteasome inhibition. The effects of both Ru-complexes on the
isolated constitutive 20S proteasome were tested using fluorogenic peptide substrates (Suc-Leu-Leu-Val-Tyr-AMC for chymotrypsin-like activity, Z-Leu-Ser-Thr-Arg-AMC for trypsin-like activity, Z-Leu-Leu-Glu-AMC for peptidylglutamyl peptide hydrolase activity, and Z-Gly-Pro-Ala-Phe-Gly-pAB for branched-chain amino acid preferring
activity).[56] The incubation mixture contained either 1 or 2 (0–
100 μM), 1 μg of isolated 20S proteasome, the specific substrate, and 50 mM Tris-HCl pH 8.0 up to a final volume of 100 μL.
Incubation was carried out at 37°C, and after 60 min the
fluorescence measurements of the hydrolyzed 7-amino-4-meth-ylcoumarin (AMC) and 4-aminobenzoic acid (PABA) were recorded
(AMC: λexc=365 nm, λem=449 nm; PABA: λexc=304 nm, λem=
664 nm) on a SpectraMax Gemini XPS microplate reader.
Proliferation and apoptotic markers. Proliferating cell nuclear
antigen (PCNA), p27 and PARP levels were analyzed using western blotting assays. Cell lysate proteins were resolved on 12 % SDS-PAGE and electroblotted onto PVDF membranes. Membranes with
transferred proteins were blocked overnight at 4°C in TBS (10 mM
Tris-HCl and 0.5 M NaCl) containing 5 % bovine serum albumin and incubated with a primary monoclonal antibody and successively with a specific peroxidase-conjugated secondary monoclonal anti-body. The immunoblot detection was performed with an ECL western blotting analysis system. Each gel was loaded with molecular mass markers in the range of 20–120 kDa (Prestained Protein MW markers, Euroclone, Milan, Italy). Glyceraldehyde-3-phosphate dehydrogenase (GAPDH) was utilized as a control for
1 2 3 4 5 6 7 8 9 10 11 12 13 14 15 16 17 18 19 20 21 22 23 24 25 26 27 28 29 30 31 32 33 34 35 36 37 38 39 40 41 42 43 44 45 46 47 48 49 50 51 52 53 54 55 56 57
equal protein loading: membranes were stripped and re-probed with an anti-GAPDH monoclonal antibody. Densitometry values were normalized to the corresponding GAPDH signal intensity. Ratios of band intensities were calculated within the same western
blots.[57]All experiments were repeated in triplicate. The
densitom-etry analysis of the bands was performed using a program implemented in MatLab ver. R2017b (MathWorks Inc., Massachu-setts, USA).
DNA fragmentation assay. DNA fragmentation assay was
per-formed as described elsewhere.[58] Briefly, MCF-7, MCF-10A and
MCF-7CR cells (1 × 10⁶ each) were grown in six-well microtiter
plates; upon 24 h treatment with 1 and 2 (10–100 μM), cells were collected and the pellets were suspended in lysis buffer (50 mM Tris-HCl pH 8, 10 mM EDTA, 0.5 % SDS, and 0.5 mg/mL proteinase
K). After 1 h incubation at 50°C, 10 mg/mL RNase was added to the
lysates and incubated for 1 h at 50°C and for 10 min at 70°C. DNA
was precipitated with NaOAc pH 5.2 and ice-cold 100 % EtOH, incubated on ice for 10 min, and centrifuged at 10,000 × g for 10 min. Pellets were dissolved in sterile water. Samples were resolved on a 1.8 % agarose gel stained with ethidium bromide.
BSA quenching. The interaction between serum albumin and the
compounds of interest was evaluated via quenching of BSA tryptophan fluorescence and biosensor binding assay. Briefly, fluorescence spectra of 10 μM BSA were recorded from 300 nm to
450 nm upon tryptophan excitation at 295 nm.[59] Fluorometric
titrations were performed by individual additions of 1 and 2 in the
range 1–10 μM. All titrations were performed at 37°C.
BSA binding. The BSA binding ability of Ru complexes was tested
on an IAsys plus biosensor. BSA sensing surface was prepared essentially following the same protocol described above for DNA. 1 and 2 were independently added at different concentrations in the range 0.1-2 μM, each time following binding kinetics up to equilibrium. Dissociation and regeneration steps were performed by serial washes with fresh PBS buffer. Binding experiments were replicated at different pH values (6.8 and 7.4) The biosensor
chamber was thermostated at 37°C throughout. Raw data were
globally fitted to both mono- and bi-exponential models, and the validity of each model to fit time courses was assessed by a standard F-test procedure.
Statistical analysis. Results presented in this study are expressed as
mean values with their standard deviations obtained from tree separate experiments. Statistical analysis was performed with one-way ANOVA, followed by the Bonferroni test using Sigma-stat 3.1 software (SPSS, Chicago, IL). p values of < 0.05 and < 0.01 were considered significant.
Acknowledgement
The Authors thank the University of Camerino for the financial support.
Conflict of Interest
The authors declare no conflict of interest.
Keywords: Ruthenium complexes · Metal-based anticancer drugs · Mechanisms of action · Cellular targets.
[1] F. Bray, J. Ferlay, I. Soerjomataram, R. L. Siegel, L. A. Torre, A. Jemal, Ca-Cancer J. Clin. 2018, 68, 394–424.
[2] D. E. Citrin, N. Engl. J. Med. 2017, 377, 1065–1075.
[3] L. Wyld, R. A. Audisio, G. J. Poston, Nat. Rev. Clin. Oncol. 2015, 12, 115– 124.
[4] B. A. Chabner, T. G. Roberts, Jr., Nat. Rev. Cancer 2005, 5, 65–72. [5] P. Gotwals, S. Cameron, D. Cipolletta, V. Cremasco, A. Crystal, B. Hewes,
B. Mueller, S. Quaratino, C. Sabatos-Peyton, L. Petruzzelli, J. A. Engelman, G. Dranoff, Nat. Rev. Cancer 2017, 17, 286–301.
[6] A. Petrelli, S. Giordano, Curr. Med. Chem. 2008, 15, 422–432.
[7] S. Dilruba, G. V. Kalayda, Cancer Chemother. Pharmacol. 2016, 7, 1103– 1124.
[8] R. Oun, Y. E. Moussa, N. J. Wheate, Dalton Trans. 2018, 47, 6645–6653. [9] a) E. Alessio, G. Mestroni, A. Bergamo, G. Sava, Curr. Top. Med. Chem.
2004, 4, 1525–1535; b) C. G. Hartinger, M. A. Jakupec, S. Zorbas-Seifried,
M. Groessl, A. Egger, W. Berger, H. Zorbas, P. J. Dyson, B. K. Keppler, Chem. Biodiversity 2008, 5, 2140–2155; c) P. Heffeter, B. Atil, K. Kryeziu, D. Groza, G. Koellensperger, W. Korner, U. Jungwirth, T. Mohr, B. K. Keppler, W. Berger, Eur. J. Cancer 2013, 49, 3366–3375; d) L. S. Flocke, R. Trondl, M. A. Jakupec, B. K. Keppler, Invest. New Drugs 2016, 34, 261– 268; e) R. Trondl, P. Heffeter, C. R. Kowol, M. A. Jakupec, W. Bergerbd, B. K. Keppler, Chem. Sci. 2014, 5, 2925–2932.
[10] a) E. A. Hillard, G. R. Jaouen, Organometallics 2011, 30, 20–27; b) M. Hanif, M. V. Babak, C. G. Hartinger, Drug Discovery Today 2014, 19, 1640–1648; c) C. Scolaro, A. Bergamo, L. Brescacin, R. Delfino, M. Cocchietto, G. Laurenczy, T. J. Geldbach, G. Sava, P. J. Dyson, J. Med. Chem. 2005, 48, 4161–4171; d) S. Guichard, R. Else, E. Reid, B. Zeitlin, R. Aird, M. Muir, M. Dodds, H. Fiebig, P. Sadler, D. Jodrell, Biochem. Pharmacol. 2006, 71, 408–415; e) A. Habtemariam, M. Melchart, R. Fernández, S. Parsons, I. D. Oswald, A. Parkin, F. P. Fabbiani, J. E. Davidson, A. Dawson, R. E. Aird, J. Med. Chem. 2006, 49, 6858–6868; f) A. Bergamo, A. Masi, A. F. Peacock, A. Habtemariam, P. Sadler, G. Sava, J. Inorg. Biochem. 2010, 104, 79–86.
[11] a) F. Marchetti, C. Pettinari, R. Pettinari, A. Cerquetella, C. Di Nicola, A. Macchioni, D. Zuccaccia, M. Monari, F. Piccinelli, Inorg. Chem. 2008, 47, 11593–11603; b) M. Montani, G. V. B. Pazmay, A. Hysi, G. Lupidi, R. Pettinari, V. Gambini, M. Tilio, F. Marchetti, C. Pettinari, S. Ferraro, M. Iezzi, C. Marchini, A. Amici, Pharmacol. Res. 2016, 107, 282–290. [12] a) R. Pettinari, F. Marchetti, C. Pettinari, A. Petrini, R. Scopelliti, C. M.
Clavel, P. J. Dyson, Inorg. Chem. 2014, 53, 13105–13111; b) R. Pettinari, C. Pettinari, F. Marchetti, C. M. Clavel, R. Scopelliti, P. J. Dyson, Organo-metallics 2013, 32, 309–316.
[13] a) J. Palmucci, F. Marchetti, R. Pettinari, C. Pettinari, R. Scopelliti, T. Riedel, B. Therrien, A. Galindo, P. J. Dyson, Inorg. Chem. 2016, 55, 11770–11781; b) R. Pettinari, F. Marchetti, A. Petrini, C. Pettinari, G. Lupidi, P. Smoleński, R. Scopelliti, T. Riedel, P. J. Dyson, Organometallics
2016, 35, 3734–3742; c) L. Bonfili, R. Pettinari, M. Cuccioloni, V. Cecarini,
M. Mozzicafreddo, M. Angeletti, G. Lupidi, F. Marchetti, C. Pettinari, A. M. Eleuteri, ChemMedChem 2012, 7, 2010–2020.
[14] a) G. S. Smith, B. Therrien, Dalton Trans. 2011, 40, 10793–10800; b) A. K. Singh, D. S. Pandey, Q. Xu, P. Braunstein, Coord. Chem. Rev. 2014, 270, 31–56; c) G. Süss-Fink, J. Organomet. Chem. 2014, 751, 2–19; d) C. G. Hartinger, N. Metzler-Nolte, P. J. Dyson, Organometallics 2012, 31, 5677– 5685.
[15] N. Belkheiri, B. Bouguerne, F. Bedos-Belval, H. Duran, C. Bernis, R. Salvayre, A. Nègre-Salvayre, M. Baltas, Eur. J. Med. Chem. 2010, 45, 3019–3026.
[16] a) M. A. Radwan, E. A. Ragab, N. M. Sabry, S. M. El-Shenawy, Bioorg. Med. Chem. 2007, 15, 3832–3841; b) A. Almasirad, M. Tajik, D. Bakhtiari, A. Shafiee, M. Abdollahi, M. J. Zamani, R. Khorasani, H. Esmaily, J. Pharm. Pharm. Sci. 2005, 8, 419–425.
[17] a) S. K. Sridhar, S. N. Pandeya, J. P. Stables, A. Ramesh, Eur. J. Pharm. Sci.
2002, 16, 129–132; b) D. Kaushik, S. A. Khan, G. Chawla, S. Kumar, Eur. J.
Med. Chem. 2010, 45, 3943–3949.
[18] C. D. Duarte, E. J. Barreiro, C. A. Fraga, Mini-Rev. Med. Chem. 2007, 7, 1108–1119.
[19] a) U. Salgın-Gökşen, N. Gökhan-Kelekçi, Ö. Göktaş, Y. Köysal, E. Kılıç, Ş. Işık, G. Aktay, M. Özalp, Bioorg. Med. Chem. 2007, 15, 5738–5751; b) A. J. Rasras, T. H. Al-Tel, A. F. Al-Aboudi, R. A. Al-Qawasmeh, Eur. J. Med. Chem. 2010, 45, 2307–2313.
[20] M. A. S. Aslam, S.-u. Mahmood, M. Shahid, A. Saeed, J. Iqbal, Eur. J. Med. Chem. 2011, 46, 5473–5479.
[21] a) A. K. Jordão, P. C. Sathler, V. F. Ferreira, V. R. Campos, M. C. de Souza, H. C. Castro, A. Lannes, A. Lourenco, C. R. Rodrigues, M. L. Bello, Bioorg. Med. Chem. 2011, 19, 5605–5611; b) A. Mahajan, L. Kremer, S. Louw, Y.
1 2 3 4 5 6 7 8 9 10 11 12 13 14 15 16 17 18 19 20 21 22 23 24 25 26 27 28 29 30 31 32 33 34 35 36 37 38 39 40 41 42 43 44 45 46 47 48 49 50 51 52 53 54 55 56 57
Guéradel, K. Chibale, C. Biot, Bioorg. Med. Chem. Lett. 2011, 21, 2866– 2868.
[22] Y. Jin, Z. Tan, M. He, B. Tian, S. Tang, I. Hewlett, M. Yang, Bioorg. Med. Chem. 2010, 18, 2135–2140.
[23] a) D. Kumar, N. M. Kumar, S. Ghosh, K. Shah, Bioorg. Med. Chem. Lett.
2012, 22, 212–215; b) K. Effenberger, S. Breyer, R. Schobert, Eur. J. Med.
Chem. 2010, 45, 1947–1954.
[24] a) M. Mohanraj, G. Ayyannan, G. Raja, C. Jayabalakrishnan, Appl. Organo-met. Chem. 2016, 30, 550–560; b) S. D. Joshi, D. Kumar, S. R. Dixit, N. Tigadi, U. A. More, C. Lherbet, T. M. Aminabhavi, K. S. Yang, Eur. J. Med. Chem. 2016, 121, 21–39; c) D. Rogolino, M. Carcelli, A. Bacchi, C. Compari, L. Contardi, E. Fisicaro, A. Gatti, M. Sechi, A. Stevaert, L. Naesens, J. Inorg. Biochem. 2015, 150, 9–17; d) R. S. Hunoor, B. R. Patil, D. S. Badiger, I. Muchchandi, K. B. Gudasi, Appl. Organomet. Chem. 2015, 29, 101–108; e) R. P. Bakale, G. N. Naik, C. V. Mangannavar, I. S. Muchchandi, I. Shcherbakov, C. Frampton, K. B. Gudasi, Eur. J. Med. Chem. 2014, 73, 38–45; f) J. Benítez, A. C. de Queiroz, I. Correia, M. A. Alves, M. S. Alexandre-Moreira, E. J. Barreiro, L. M. Lima, J. Varela, M. González, H. Cerecetto, Eur. J. Med. Chem. 2013, 62, 20–27; g) P. Krishnamoorthy, P. Sathyadevi, R. R. Butorac, A. H. Cowley, N. S. Bhuvanesh, N. Dharmaraj, Dalton Trans. 2012, 41, 4423–4436; h) D. S. Raja, N. S. Bhuvanesh, K. Natarajan, Dalton Trans. 2012, 41, 4365–4377; i) P. Krishnamoorthy, P. Sathyadevi, A. H. Cowley, R. R. Butorac, N. Dharmaraj, Eur. J. Med. Chem. 2011, 46, 3376–3387; j) M. V. Angelusiu, S.-F. Barbuceanu, C. Draghici, G. L. Almajan, Eur. J. Med. Chem. 2010, 45, 2055–2062.
[25] R. Pettinari, F. Marchetti, C. Di Nicola, C. Pettinari, A. Galindo, R. Petrelli, L. Cappellacci, M. Cuccioloni, L. Bonfili, A. M. Eleuteri, M. F. C. Guedes da Silva, A. J. L. Pombeiro, Inorg. Chem. 2018, 57, 14123–14133. [26] a) R. G. Kenny, C. J. Marmion, Chem. Rev. 2019, 119, 1058–1137; b) G. Palermo, A. Magistrato, T. Riedel, T. von Erlach, C. A. Davey, P. J. Dyson, U. Rothlisberger, ChemMedChem 2016, 11, 1199–1210.
[27] S. Q. Zhang, L. H. Gao, H. Zhao, K. Z. Wang, Curr. Med. Chem. 2018. [28] a) S. Ristovski, M. Uzelac, J. Kljun, T. Lipec, M. Ursic, S. Zemljic Jokhadar,
M. C. Zuzek, T. Trobec, R. Frangez, K. Sepcic, I. Turel, ChemMedChem
2018, 13, 2166–2176; b) J. Kladnik, J. Kljun, H. Burmeister, I. Ott, I.
Romero-Canelon, I. Turel, Chemistry 2019.
[29] a) Y. Gou, Z. Zhang, D. Li, L. Zhao, M. Cai, Z. Sun, Y. Li, Y. Zhang, H. Khan, H. Sun, T. Wang, H. Liang, F. Yang, Drug Delivery 2018, 25, 321–329; b) B. Demoro, A. Bento-Oliveira, F. Marques, J. Costa Pessoa, L. Otero, D. Gambino, F. M. d. A. R, A. I. Tomaz, Molecules 2019, 24.
[30] W. Ma, S. Zhang, Z. Tian, Z. Xu, Y. Zhang, X. Xia, X. Chen, Z. Liu, Eur. J. Med. Chem. 2019, 181, 111599.
[31] J. M. Diamond, E. M. Wright, Proc. R. Soc. Lond. B Biol. Sci. 1969, 171, 273–316.
[32] V. Brabec, O. Novakova, Drug Resist. Updates 2006, 9, 111–122. [33] R. Pettinari, C. Pettinari, F. Marchetti, B. W. Skelton, A. H. White, L. Bonfili,
M. Cuccioloni, M. Mozzicafreddo, V. Cecarini, M. Angeletti, M. Nabissi, A. M. Eleuteri, J. Med. Chem. 2014, 57, 4532–4542.
[34] a) A. Hoque, H. Chen, X. C. Xu, Cancer Epidemiol. Biomarkers Prev. 2008, 17, 88–94; b) A. Parikh, C. Childress, K. Deitrick, Q. Lin, D. Rukstalis, W. Yang, Prostate 2010, 70, 971–981; c) Y. H. Park, H. H. Jung, J. S. Ahn, Y. H. Im, Biochem. Biophys. Res. Commun. 2013, 439, 275–279; d) Y. G. Shellman, D. Ribble, L. Miller, J. Gendall, K. Vanbuskirk, D. Kelly, D. A. Norris, R. P. Dellavalle, Melanoma Res. 2005, 15, 83–89; e) T. T. Wei, Y. T. Lin, W. S. Chen, P. Luo, Y. C. Lin, C. T. Shun, Y. H. Lin, J. B. Chen, N. W. Chen, J. M. Fang, M. S. Wu, K. C. Yang, L. C. Chang, K. Y. Tai, J. T. Liang, C. C. Chen, EBioMedicine 2016, 10, 124–136.
[35] G. Llaverias, C. Danilo, I. Mercier, K. Daumer, F. Capozza, T. M. Williams, F. Sotgia, M. P. Lisanti, P. G. Frank, Am. J. Pathol. 2011, 178, 402–412.
[36] M. Cuccioloni, L. Bonfili, M. Mozzicafreddo, V. Cecarini, R. Pettinari, F. Condello, C. Pettinari, F. Marchetti, M. Angeletti, A. M. Eleuteri, RSC Adv.
2016, 6, 39636–39641.
[37] a) R. Pettinari, F. Marchetti, C. Di Nicola, C. Pettinari, M. Cuccioloni, L. Bonfili, A. M. Eleuteri, B. Therrien, L. K. Batchelor, P. J. Dyson, Inorg. Chem. Front. 2019; b) T. Kawachi, H. Rudney, Biochemistry 1970, 9, 1700–1705.
[38] T. Carbonell, E. Freire, Biochemistry 2005, 44, 11741–11748. [39] K. Tanaka, Proc. Jpn. Acad. Ser. B Phys. Biol. Sci. 2009, 85, 12–36. [40] L. J. Crawford, B. Walker, H. Ovaa, D. Chauhan, K. C. Anderson, T. C.
Morris, A. E. Irvine, Cancer Res. 2006, 66, 6379–6386.
[41] F. J. Kubben, A. Peeters-Haesevoets, L. G. Engels, C. G. Baeten, B. Schutte, J. W. Arends, R. W. Stockbrugger, G. H. Blijham, Gut 1994, 35, 530–535.
[42] S. T. Wang, H. J. Ho, J. T. Lin, J. J. Shieh, C. Y. Wu, Cell Death Dis. 2017, 8, e2626.
[43] a) M. Pagano, S. W. Tam, A. M. Theodoras, P. Beer-Romero, G. Del Sal, V. Chau, P. R. Yew, G. F. Draetta, M. Rolfe, Science 1995, 269, 682–685; b) J. Sun, S. Nam, C. S. Lee, B. Li, D. Coppola, A. D. Hamilton, Q. P. Dou, S. M. Sebti, Cancer Res. 2001, 61, 1280–1284.
[44] D. Levy, A. Davidovich, S. Zirkin, Y. Frug, A. M. Cohen, S. Shalom, J. Don, PLoS One 2012, 7, e34736.
[45] A. Field-Smith, G. J. Morgan, F. E. Davies, Ther. Clin. Risk Manage. 2006, 2, 271–279.
[46] W. W. Wong, J. Dimitroulakos, M. D. Minden, L. Z. Penn, Leukemia 2002, 16, 508–519.
[47] J. R. Brown, Fed. Proc. 1976, 35, 2141–2144.
[48] L. E. Gerweck, S. Vijayappa, S. Kozin, Mol. Cancer Ther. 2006, 5, 1275– 1279.
[49] a) J. G. Kuhry, P. Fonteneau, G. Duportail, C. Maechling, G. Laustriat, Cell Biophys. 1983, 5, 129–140; b) J. Jasniewski, C. Cailliez-Grimal, M. Younsi, J. B. Milliere, A. M. Revol-Junelles, Appl. Microbiol. Biotechnol. 2008, 81, 339–347.
[50] R. J. Davies, P. R. Edwards, H. J. Watts, C. R. Lowe, P. E. Buckle, D. Yeung, T. M. Kinning, D. V. Pollard-Knight, The resonant mirror: A versatile tool for the study of biomolecular interaction, San Diego, 1994.
[51] M. D. Hanwell, D. E. Curtis, D. C. Lonie, T. Vandermeersch, E. Zurek, G. R. Hutchison, J. Cheminform. 2012, 4, 17.
[52] D. Schneidman-Duhovny, Y. Inbar, R. Nussinov, H. J. Wolfson, Nucleic Acids Res. 2005, 33(Web Server issue), W363–367.
[53] E. Mashiach, D. Schneidman-Duhovny, N. Andrusier, R. Nussinov, H. J. Wolfson, Nucleic Acids Res. 2008, 36(Web Server issue), W229–232. [54] M. Cuccioloni, M. Mozzicafreddo, M. Spina, C. N. Tran, M. Falconi, A. M.
Eleuteri, M. Angeletti, J. Lipid Res. 2011, 52, 897–907.
[55] M. Mozzicafreddo, M. Cuccioloni, A. M. Eleuteri, M. Angeletti, J. Lipid Res.
2010, 51, 2460–2463.
[56] M. Orlowski, C. Cardozo, C. Michaud, Biochemistry 1993, 32, 1563–1572. [57] M. Cuccioloni, L. Bonfili, M. Mozzicafreddo, V. Cecarini, S. Scuri, M. Cocchioni, M. Nabissi, G. Santoni, A. M. Eleuteri, M. Angeletti, Food Funct. 2016, 7, 4299–4309.
[58] F. Buonanno, L. Quassinti, M. Bramucci, C. Amantini, R. Lucciarini, G. Santoni, H. Iio, C. Ortenzi, Chem.-Biol. Interact. 2008, 176, 151–164. [59] D. E. Epps, T. J. Raub, V. Caiolfa, A. Chiari, M. Zamai, J. Pharm. Pharmacol.
1999, 51, 41–48.
Manuscript received: September 28, 2019 Revised manuscript received: October 26, 2019 Accepted manuscript online: November 8, 2019 Version of record online: November 18, 2019