UNIVERSITA’ DEGLI STUDI DI FOGGIA
PhD Course
"Experimental and Regenerative Medicine"
XXXI Cycle
A novel biomarker for cancer and autoimmune diseases:
IGFBP6
Tutor
PhD Student
Prof. Arcangelo Liso
Dr. Rosa Trotta
Supervisor
Summary Abstract
Abbreviations 1. Introduction
2. Dendritic cells, immunity and cancer 2.1 Dendritic cells activation 2.2 Dendritic cells migration
2.3 Dendritic cells and Cancer-Immunity Cycle
2.4 Hyperthermia and metabolic reprogramming of dendritic cells 3. Neutrophils, immunity and cancer
4. Insulin-Like Growth Factor Binding Protein 6 (IGFBP6) 4.1 Effect of IGFBP6 on cell survival
4.2 Effect of IGFBP6 on cell proliferation 4.3 Effect of IGFBP6 on cell migration 4.4 Effect of IGFBP6 on cell differentiation 4.5 IGFBP6 and cancer
4.5.1 IGFBP6 in Rhabdomyosarcoma
4.5.2 IGFBP6 in Nasopharyngeal Carcinoma 4.5.3 IGFBP6 in Glioblastoma
4.5.4 IGFBP6 in Breast Cancer 4.5.5 IGFBP6 in Ovarian Cancer
4.6 IGFBP6 and autoimmune diseases
4.6.1 IGFBP6 as biomarker in Diabetes Mellitus 4.6.2 IGFBP6 as biomarker in Rheumatoid Arthritis
5. Materials and Methods
5.1 Ethics Statement
5.2 Monocyte-derived Dendritic Cells Isolation
5.3 Gene Expression Profiles: Sample Preparation and Hybridization 5.4 Microarray Data Analysis
5.5 Analysis of Gene Expression Data 5.6 Cell Lines
5.7 Real Time RT-PCR Analysis
5.9 Analysis of IGFBP6 in Conditioned Medium 5.10 Apoptosis and Necrosis
5.11 Cell Chemotaxis 5.12 Neutrophils Isolation
5.13 Neutrophils: IGFBP6 and ROS Production 5.14 Degranulation in Neutrophils
5.15 Transwell Migration Assay 5.16 Statistical analysis
6. Results
6.1 moDCs exposed to mild hyperthermia present a distinct gene expression profile
6.2 moDCs and regulation of IGFBP6
6.3 The up-regulation of IGFBP6 is specific to moDCs 6.4 IGFBP6 protein expression
6.5 IGFBP6 is a chemoattractant factor in Monocytes and T cells but not in B cells
6.6 Neutrophils during inflammation: IGFBP6 and ROS production 6.7 Neutrophils during inflammation: IGFBP6 and degranulation
6.8 Neutrophils during inflammation: IGFBP6 and chemotaxis
7. Discussion 8. Conclusion 9. References
Abbreviation
APC antigen presenting cell ARG1 arginase 1
ARMS alveolar rhabdomyosarcoma -cat beta-catenin
BC breast cancer
BM bone marrow
BMP bone morphogenetic protein
CACO2 heterogeneous human epithelial colorectal adenocarcinoma cell line CAD coronary artery disease
CNS central nervous system CTL cytotoxic T lymphocyte DC dendritic cell
DC-LAMP DC-lysosome-associated membrane protein DM diabetes mellitus
Dsh dishevelled
dsRNA double-stranded RNA
ELISA Enzyme-linked immunosorbent assay ERMS embryonal rhabdomyosarcoma
fMLP N-formyl-methionyl-leucyl-phenylalanine
Fzd frizzled GBM glioblastoma
GM-CSF granulocyte-macrophage colony-stimulating factor GSK3 glycogensynthase kinase 3
HAEC human aortic endothelial cells HCT116 human colon cancer cell line HD healthy donors
HK2 human renal tubular cancer cell lines HSP heat shock protein
HTN hypertension IFN interferon
IGF insulin-like growth factor IGFBP IGF binding protein IL interleukin
iNOS nitric oxide synthase LEF lymphoid enhancer factor LMP-1 LIM mineralization protein-1
LN lymph node
LRP low-density lipoprotein-related protein receptors MANF mesencephalic astrocyte-derived neurotrophic factor MAP kinase mitogen activated protein kinase
MCF-7 Cells human breast adenocarcinoma cell line MCP-1 monocyte chemoattractant protein-1 MDSC myeloid-derived suppressor cells MHC-I major histocompatibility class I MHC-II major histocompatibility class II MMP-9 metalloproteinase-9
moAb monoclonal antibody
moDC monocyte-derived dendritic cell MPO myeloperoxidase
mtCa2+ mitochondrial calcium
NK natural killer cells
NPC nasopharyngeal carcinoma OA osteoarthritis
OC ovarian cancer
OxPhos oxidative phosphorylation PC3 human prostate cancer cell line Phb2 prohibitin-2
PLAT tissue-type plasminogen activator PLT primary lymphoid tissue
PMA phorbol 12-myristate 13-acetate PRR pathogen recognition receptor RA rheumatoid arthritis
RMS rhabdomyosarcoma
ROI reactive oxygen intermediates RONS reactive nitrogen and oxygen species ROS reactive oxygen species
RP retinopathy SL synovial fluid
SLO secondary lymphoid organ ST synovial tissue
T1DM type 1 diabetes mellitus T2DM type 2 diabetes mellitus TAN tumor-associated neutrophil TCF T-cell factor
TD thoracic duct
TGF transforming growth factor TLR 2/4 toll-like receptor 2/4
TMZ temozolomide
TNF- tumor necrosis factor-alpha TR thyroid hormone receptor-1 VDR vitamin D receptor
1. Introduction
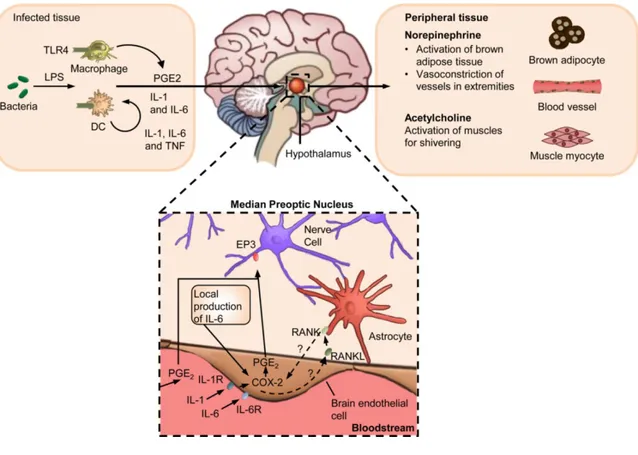
Fever response is a characteristic symptom of infection and inflammatory disease retained through hundreds of millions of years of natural selection; is a hallmark of infection and inflammatory disease and has been shaped through hundreds of millions of years of natural selection [1]. The increase from 1 to 4°C of body temperature in endothermic (warm-blooded) animals is associated with improved survival and resolution of many infections [2]. The American College of Critical Care Medicine and the Infectious Diseases Society of America has defined fever as a body temperature of at least 38.3°C (101°F) [3, 4]. During infection, ecthotermic vertebrates can increase their body temperature through behavioral regulation [1], while, in the endothermic animals, the induction and the maintenance of fever involves numerous coordinated interplay between the innate immune system and neuronal circuits both in the central and peripheral nervous systems. Immune sensing of infection begins with the cell populations of innate immunity (macrophages, neutrophils and dendritic cells), which, through the pathogen recognition receptors (PRRs), stimulate the synthesis of pyrogenic cytokines, such as, 1, TNF- and IL-6 both at the site of infection and within the brain [5, IL-6]. IL-IL-6 and IL-1, in the hypothalamus, induce the synthesis of cyclooxygenase 2 (COX2) in the brain vascular endothelial cells with a consequent production of prostaglandin E2 (PGE2) by oxidizing arachidonic acid [7, 8]. PGE2 is considered the most important pyrogenic mediator of fever [9-11]. Thus, PGE2 can bind to the EP3 prostaglandin receptors expressed by thermoregulatory neurons in the median preoptic nucleus inside the hypothalamus [12], determining the release of norepinephrine (also known as noradrenaline) which raises body temperature by increasing the thermogenesis in brown adipose tissue, induces vasoconstriction in order to prevent passive heat loss [1, 13, 14] and acetylcholine which stimulates the muscles to convert the stored chemical energy into thermal energy increasing the overall metabolic rates [15]. Moreover, acetylcholine contributes to fever by stimulating muscle myocytes to induce shivering (Figure 1).
One benefit widely attributed to fever is the enhancement of immune-protective mechanisms following infection.
Defence against pathogens involves tight spatial and temporal regulation of the immune system, and the pyrogenic cytokines that are produced during the induction of fever also operate locally to orchestrate immunity within infected tissues [16]. Some possible noninfectious causes of fever include blood transfusions, endocrine disturbances, alteration of oral mucosa leading mucositis, surgery and tumor fever [17-19]. Moreover, about 15-20% of patients with cancer have fever of unknown origin (FUO) [19], known as neoplastic fever or tumor fever. Unlike infectious fevers that tend to present with warmth, diaphoresis and chills reflective of peripheral vasodilation, neoplastic fever is commonly associated with diaphoresis and rubor and in some cases chills/rigors [20]. Many agents can induce fever, among them, antimicrobials, anticonvulsants, bisphosphonates, immunosuppressants, and antineoplastic agents. These agents are among the most common to induce fevers and are also frequently used in patients with cancer. Some examples are represented by: bleomycin, chlorambucil, cisplatin, daunorubicin, hydroxyurea, vincristine, and 6-mercaptupurine [21].
Several studies have shown that fever-like temperature changes might activate innate and also adaptive immunity [22, 23]. It is well-known that hypertermia can modulate the activities of immune cells, including dendritic cells [24] (innovative approach capable of enhancing the anti-tumor functions of DCs) and neutrophils [25]. Moreover, fever enhances DC cross-presenting functions by increasing DCs expression of MHC class I and class II molecules and co-stimulatory molecules, like CD80 and CD86, and stimulates the secretion of the IL-12 and TNF [26].
2. Dendritic cells, immunity and cancer
Dendritic cells (DCs) are the most potent professional Antigen-Presenting cells (APCs) in vivo. They are key regulators of the adaptive immune response, and play a fundamental role for T cell-mediated cancer immunity. However, numerous studies have concluded that DCs can infiltrate tumors.
DCs can be distinguished in different subsets: conventional dendritic cells (also known as classic dendritic cells, cDCs), plasmocytoid dendritic cells (pDCs), Langerhans cells and monocyte-derived dendritic cells (moDCs).
cDCs transport tumor antigens to draining lymph nodes and cross-present antigen to activate cytotoxic T lymphocytes [27]. These cells are very adept at initiating a T-cell response, directing T T-cell polarization, and presenting exogenous and endogenous Ag in both MHC-I and -II contexts. cDCs can respond to stimulation by pathogen associated signatures (PAMPs) by secreting large amounts of IFN-I (notably IFN- and IFN-) [28]. These cells are present in the thymus, spleen, and lymph nodes can be divided into two main subsets that are distinguished by the paths they follow to access the lymphoid organs [29].
pDCs are found circulating in the blood and in peripheral organs and show a characteristic surface phenotype and morphology. They are found in small numbers throughout the periphery and are recognized by their expression of B220, Ly6C, and PDCA. They were first identified in humans [30] and later in mice [31]. pDCs selectively express TLR7 and TLR9, generate high amounts of type I interferon (IFN-I) [32] and acquire the typical DC morphology after activation. Their activation and IFN-I production are fundamental for the initiation of antiviral immune responses. Thanks to the expression of MHC-II and co-stimulatory molecules, the pDCs also have the potential to act as antigen-presenting cells.
A substantial portion of DCs in the epidermal skin layer are a specialized subset of cells namely Langerhans cells. These cells have been described in many species of mammal.
After inflammation or infection, lymphoid and non-lymphoid organs can receive DCs that originate from monocyte infiltrates [33] and have been defined "monocyte-derived DCs" (moDCs) or "inflammatory DCs" (iDCs) [34, 35].
moDCs are phenotypically difficult to distinguish from cDCs because they share similar expression patterns of MHC-II, CD11b and CD11c; although, as the
monocytes from which they derive express CD64, the Fc-gamma receptor 1 (FcgRI) [36, 37]. In 1994, Sallusto and Lanzavecchia developed a protocol in order to generate dendritic cells in vitro, starting from monocytes stimulated with GM-CSF (Csf2) and IL-4 [38].
2.1 Dendritic cells activation
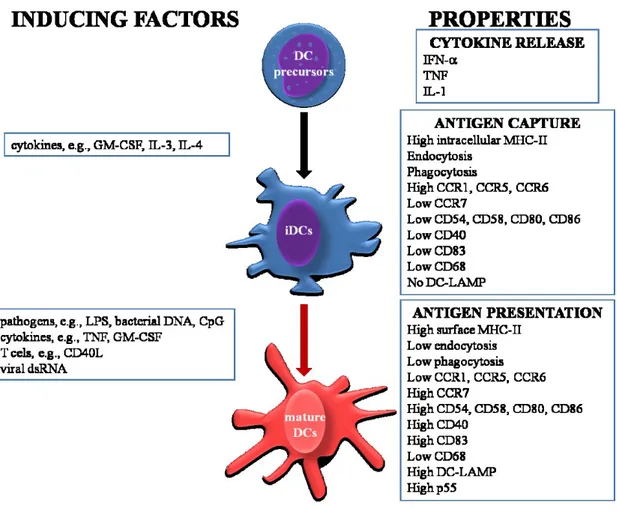
DCs can be activated by different molecules, such as, CD40, TNF-R and IL-1R. These molecules have been shown to activate transition from immature Ag-capturing cells to mature Ag-presenting DCs [39]. DCs maturation is a multistep process, which begins in the periphery after Ag encounter and/or inflammatory cytokines and completing during DC-T cell interaction. This process can be induced and/or regulated by numerous factors (Figure 2), including i) pathogen-related molecules such as lipopolysaccaride (LPS) [40], bacterial DNA [41-43] and dsRNA [44]; ii) in the local microenvironment, the balance between proinflammatory and anti-inflammatory signals, including TNF, IL-1, IL-6, IL-10, TGF- and prostaglandins; and (iii) T cell-derived signals. The maturation is associated with numerous events, including i) loss of endocytic/phagocytic receptors; ii) up-regulation of costimulatory molecules (CD40, CD58, CD80 and CD86); iii) morphological changes with loss of adhesive structures, cytoskeleton reorganization (that can be controlled by actin-bundling protein p55 fascin [45]), and acquisition of high cell motility [46]; iv) shift in lysosomal compartments with CD68 down-regulation and DC-lysosome-associated membrane protein up-regulation (DC-LAMP); and v) modification of the MHC-II compartments.
2.2 Dendritic cells migration
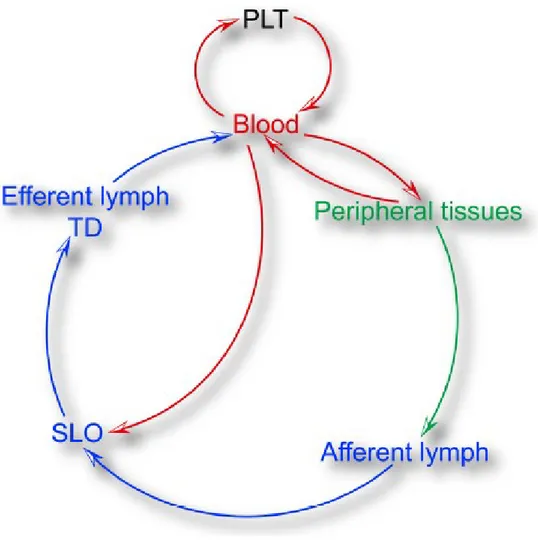
DCs develop from precursors that originate from primary lymphoid tissues (PLT). Fully differentiated DCs are found in healthy tissues as immature cells, that is, endowed with highly-active endocytic machinery for sampling foreign Antigens but have not acquired the ability for priming of naive T cells [39]. DCs are very present in some tissues, such as, skin and mucosal surfaces because a central function of DCs in non-lymphoid tissues is the transport and presentation of antigenic cargo into and within secondary lymphoid organs (SLOs). The microarchitecture of secondary lymphoid tissues allows interactions between DCs, B cells and T cells that generate antigen in order to initiate adaptive immune responses [47]. The SLOs function is exercised thanks to the capacity of DCs to enter the small lymphatic vessels in the peripheral tissues and migrate to local draining lymph nodes (LNs). During the migration to the LN these Ag-bearing DCs mature, i.e. they assume an immunostimulatory phenotype. The maturation is coupled with the increased expression of the MHC complexes, the up-regulation of the co-stimulatory molecules and cytokines necessary for T cell priming. A small number of cells that have migrated to the lymphatic system are not retained in the LNs, but travel along the lymphatic tree towards venous circulation. These DCs can deliver their antigenic cargo to the spleen [48] and to primary lymphoid tissues (BM and thymus) [49, 50] (Figure 3). The migration of DCs, therefore, occurs in different environments, in different biophysical conditions and involves many cellular and molecular mechanisms.
2.3 Dendritic cells and Cancer-Immunity Cycle
DCs play a fundamental role in the antitumor immune response. These cells are necessary for T-cell-mediated cancer immunity. As inducers of a T cell response, they are critical for responses to cytotoxic and targeted agents [51].
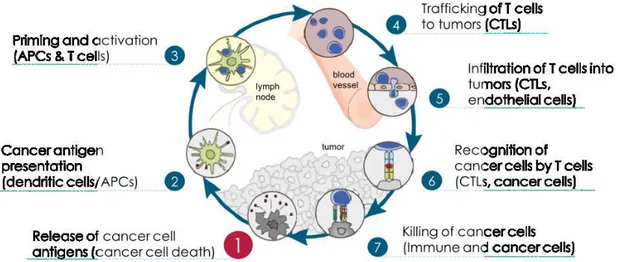
Chen and Mellman summarized the interaction between cancer and immune system as a multi-step, multi-tissue, highly-regulated process, which they named the "Cancer-Immunity Cycle". Considering this definition, antitumor responses consist of a series of steps aimed at killing cancer cells. The generation of anticancer immunity is a cyclic process that can be self propagating, leading to an accumulation of immunostimulatory factors that should be amplify and broaden T cell responses (Figure 4) [27].
During the first step of the cycle, neoantigens created by oncogenesis are released and captured by DCs for processing (step 1). Subsequently (step 2), DCs present the captured antigens on MHCI and MHCII molecules to T cells, inducing in the priming and activation of effector T cell responses against the cancer-specific antigens (step 3). During these steps, the primary function of DCs is to sequentially acquire tumor antigen, migrate to the lymph node and activate a de novo T-cell response. However, only a small number of tumor DCs will migrate to the lymph nodes, probably this process is controlled by the expression of CCR7 [52]. Finally, the activated effector T cells transit to (step 4) and infiltrate the tumor (step 5), recognize and bind to cancer cells through the interaction between its TCR and its cognate antigen bound to MHCI (step 6), and kill their target cancer cell (step 7).
2.4 Hyperthermia and metabolic reprogramming of dendritic cells
Reprogramming energy metabolism has been described as an emerging hallmark in cancer cells [53].Metabolic processes have been shown to have specific effects on the function of dendritic cells and that alteration, even if only one of these processes can modify the whole functioning of these cells [54, 55].
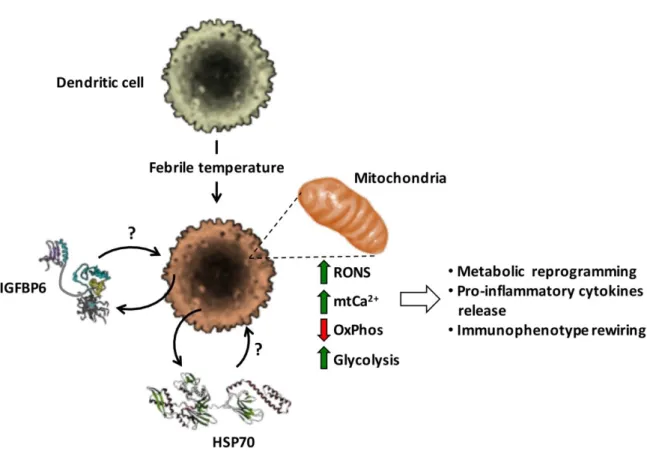
Recently, we have studied how exposure at 39°C for 3h in moDCs can induce alterations in the metabolic phenotype. Specifically, we have focused our attention on the activity of mitochondrial respiration and oxidative phosphorylation (OxPhos). Our results demonstrated the decrease in mitochondrial respiratory chain activity with a consequent decrease in oxidative phosphorylation, an increase in reactive nitrogen and oxygen species (RONS) production, and accumulation of intramitochondrial (mt) of Ca2+ ions (mtCa2+). This process is accompanied by an
increase in glycolysis, thus allowing us to hypothesize a metabolic rewiring and release of pro-inflammatory cytokines. Most likely, at the base of these phenomena there could be HSP70 and/or IGFBP6 [56, 57] (Figure 5).
Figure 5. Effect of mild hyperthermic conditioning on MoDCs (Liso, A. et al.,
3. Neutrophils, immunity and cancer
Neutrophilic granulocytes (neutrophils) are the most abundant leukocytes in blood. These cells play a primary role in the innate immunity [58]. In general, the neutrophils were associated with acute inflammation, but, a number of studies show that neutrophils are key effector cells also in the orchestration of adaptive immunity in the resolution of chronic inflammatory response. Neutrophils are integrated in the activation, regulation and effector mechanisms of the innate and adaptive immune systems [59-61]. They are considered the first line of defense during inflammation and infections [60].
Neutrophils are characterized by the ability to act as phagocytic cells, to produce reactive oxygen intermediates (ROI) with antimicrobical potential and to release enzymes from their granules [60, 62]. Neutrophils store numerous molecules in three types of granules: primary, secondary and tertiary. Primary or azurophilic granules are characterized by the accumulation of antimicrobial proteins and proteases (MPO and elastase); secondary or specific granules, which contain high levels of iron-binding protein lactoferrin, and tertiary or gelatinase granules, which contain matrix metalloproteinases [61]. Secondary and tertiary granules contain an overlapping set of proteins. More recently, a fourth granule has been described that was enriched in the microbial lectin ficolin-1 [63].
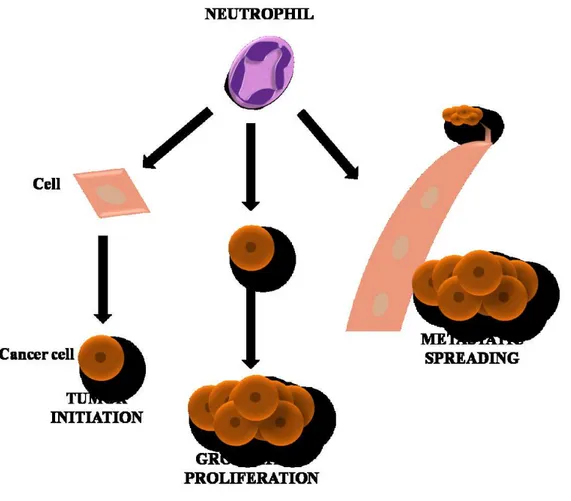
Neutrophils play an important role in inflammation within the tumor as they are attracted by CXCR2 ligands like CXCL1, CXCL2 and CXCL5, among others [64, 65]. High levels of neutrophils expression have been associated with detrimental outcome in several solid tumors [66]. The role of these cells in cancer is not fully understood, and as a hallmark of cancer, they reflect a state of host inflammation [53]. They can participate in different stages in the oncogenic process, including initiation, growth and proliferation, dissemination to the other tissues, and formation of new blood vessels in the tumor (Figure 6) [64, 67].
Early studies suggest that tumor-associated neutrophils (TANs) did not play a primary role in chronic and progressive diseases, such as cancer. However, more recently it is becoming clear that TANs have a significant function in tumor disease. In fact, neutrophils are considered potent antitumor effector cells [68]. These cells play an important role in antitumor activities thanks to the various antimicrobial and cytotoxic compounds contained in the granules that can destroy malignant cells; moreover, cytokines and chemokines secreted by neutrophils can also recruit other cells with antitumor activity [61, 69]. Neutrophils can facilitate tumor cells proliferation by attenuating the immune system. For example, neutrophils may suppress CD8+ T lymphocyte antitumor response by releasing nitric oxide synthase (iNOS), or arginase 1 (ARG1) under TGF- stimulation [70, 71].
Neutrophils can be activated by direct contact with T cells or DCs, as well as by locally produced cytokines, such as in the case of TH17 cells, which have been shown
4. Insulin-Like Growth Factor Binding Protein 6 (IGFBP6)
Insulin-like growth factor binding proteins (IGFBPs) are a group of secreted proteins involved in the transport of insulin-like growth factors (IGFs) with high affinity, regulating the bioavailability and function of IGFs. The IGFBP family consist of six proteins, IGFBP 1-6 [73, 74], however other proteins with low binding affinity to IGFs were incorrectly named as IGFBP7, IGFBP8, IGFBP9, etc. [75]. IGFBP 1-6 are composed of a three-domain structure [73]. The N-domain contains a highly conserved high affinity IGF binding subdomain that has two disulfide linkages that stabilize a globular structure containing a three stranded anti-parallel -sheet [76]. IGFBP6 has structural and functional characteristics distinct compared to the other members of the IGFBPs family [77-79]. In IGFBPs 1-5, the N-terminal subdomanins contain a conserved GCGCC motif, with four disulphide bonds [80], whereas, IGFBP6 differs from the other IGFBPs as it is lacking this cysteine-rich motif and has only three disulfide bonds [81]. Moreover, this region of IGFBP6 has a different three-dimensional structure than that of the other IGFBPs [82]. The C-domains of IGFBPs 1-6 share sequence homology and are made up of three homologous disulphide bonds. Each domain consist of three homologous disulphide linkages, a conserved CWCV sequence and a thyroglobulin type 1 fold comprising an -helix followed by a loop, a three-stranded antiparallel -sheet incorporating a second loop and a disulphide-bonded flexible third loop [78, 83]. C-domain plays a key role in linking with IGFs. Many IGF-independent actions are mediated by the interaction of the C-domain with other proteins or glycosaminoglycans [73]. Due to the different structure, unlike the other IGFBPs 1-5, IGFBP6 binds IGF-II with an affinity greater than about 50 times the binding affinity with IGF-I [84].IGFBP6 may undergo post-translational modifications, such as glycosylation, phosphorylation and proteolysis [85]. IGFs actions are mediated by binding to receptors, namely IGF type I receptor (IGF-IR), IGF type II receptor (IGF-IIR), insulin receptor type A (IR-A), insulin receptor type B (IR-B) and hybrid insulin/IGF-I receptor [86].
IGFBP6 is highly conserved across species, in fact, human IGFBP6 shares 70–85 % sequence identity with rat, mouse, bovine and pig IGFBP6[87].
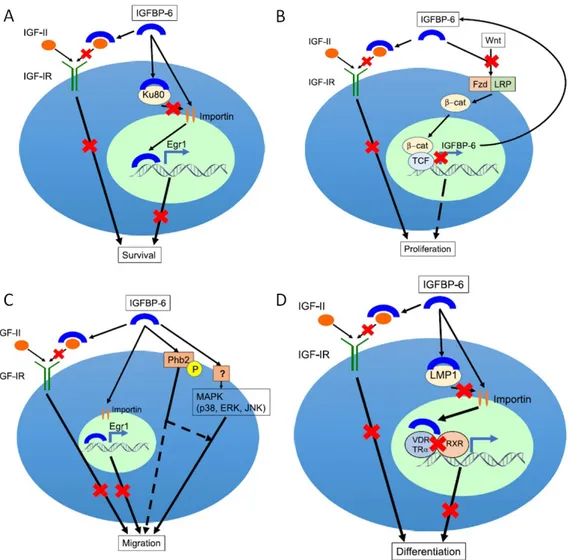
IGFBP6 protein is well known to inhibit the actions of IGF-II including proliferation, differentiation, migration and survival in many cell lines [77, 78], is a tumour suppressor and inhibits growth by an IGF-II-dependent mechanism (Figure 7).
Figure 7. Effects of IGFBP6 on cell survival, proliferation, migration and differentiation (Bach, A.L. 2016)
Although the main IGFBP6 biological function is binding with IGF-II, it can also carry out functions independent of the IGF system [88]. IGFBP6 inhibits IGF-II actions but has little effect on IGF-I [78]. Numerous studies indicate that IGFBP6 inhibits angiogenesis and promotes cell migration by IGF-independent mechanisms, and enters the nucleus where it modulates differentiation and survival [86]. In contrast to other IGF binding proteins, IGFBP6 is a negative regulator of cellular senescence in the human fibroblasts; in fact, IGFBP6 over-expression increases the cellular lifespan [89]. However, recent studies suggest novel actions independent of IGF. In particular, IGFBP6 has been shown to induce chemotaxis in Rh30 rhabdomyosarcoma cells [90], to regulate cell apoptosis and migration in glioma [91], to be a novel nasopharyngeal carcinoma prognostic biomarker [92], to inhibit angiogenesis and to promote cell migration [86]. The migratory response mediated by IGFBP6 was due to the activation of MAP kinase pathway and possibly other signalling pathways [79].
4.1 Effect of IGFBP6 on cell survival
IGFBP6 can impair survival by inhibiting IGF-II actions but also by increasing EGR-1 transcription in an IGF-independent manner. This protein can exert intracellular actions through its translocation to the nucleus. In 2010, Iosef et al., showed that IGFBP6 specifically binds Ku80. Ku80 competes with importin- in binding IGFBP6, using the same binding site (Figure 7A).
Ku80 is a component of the Ku complex and it is required for proper telomere maintenance [93]. Intracellular IGFBP6 interacts preferentially with Ku80 during mitosis, thus regulating the availability of Ku proteins and indirectly influencing the DNA repair process [94].
4.2 Effect of IGFBP6 on cell proliferation
IGFBP6 can impair cell proliferation by inhibiting IGF-II actions but also by inhibiting Wnt/-catenin signaling. Wnt/-catenin pathway contains Wnt proteins, Frizzled (Fzd) receptor families, low-density lipoprotein-related protein receptors (LRP), cytoplasmic proteins, such as Dishevelled (Dsh), glycogensynthase kinase 3 (GSK3), APC, and transcription factors such as -catenin (-cat), Axin, T-cell factor/lymhoid enhancer factor (TCF/LEF) [95, 96]. Wnt signaling pathway is associated with oncogenesis in various cancers and play an important role in the
development of the central nervous system [97]. The translocation of -catenin from the cytoplasm to the nucleus involves the binding of Wnt to its Fzd receptor and the LRP5/6 co-receptor. Only following the translocation, -cat can modulate the transcription. IGFBP6 is directly down-regulated by the -cat/TCF complex in desmoid tumors. Desmoid tumors are aggressive fibromatosis in witch -cat-mediated TCF-3-dependent transcription is activated. Starting from this evidence, IGFBP6 can be defined as target gene [98] (Figure 7B).
4.3 Effect of IGFBP6 on cell migration
IGFBP6 can enhance or inhibited cell migration by an IGF-dependent and/or independent mechanism. This protein enhance cancer cell migration by an IGF-independent manner that include binding to cell surface prohibitin-2 (Phb2) and/or MAP kinase pathway activation [86, 90]. Action of Phb can be modulated by phosphorylation and they also regulate intracellular signaling pathway, including MAP kinases [99]. MAP kinases (including JNK, p38 and and ERK) are implicated in cell migration and invasion [100]. In contrast, IGFBP6 can impair migration by an IGF-II-dependent action and by promoting EGR-1 transcription (Figure 7C).
4.4 Effect of IGFBP6 on cell differentiation
As shown in Figure 7D, IGFBP6 has been reported to inhibit the differentiation of myoblast and osteoblasts [101]. In particular, this protein can impair differentiation by inhibiting IGF-II actions but also by modulating cytoplasmic-nuclear translocation of LIM mineralization protein-1 (LMP-1) and nuclear receptor-mediated transcription by an IGF-independent mechanism [84]. LMP-1 is an intracellular osteogenesis regulator. This function is exerted through the up-regulation of bone morphogenetic proteins (BMPs) [102]. Overexpression of IGFBP6 alters the intracellular localization of LMP1 to the perinuclear region and suppresses the differentiation of human and murine osteoblasts. In addition, IGFBP6 and LMP-1 physically interact and this interaction is functionally relevant [103]. IGFBP6 can inhibit osteoblast differentiation by also binding the vitamin D receptor (VDR) in the nucleus and potentially inhibiting RXR/vitamin D receptor dimerization [104]. Furthermore, IGFBP6 binds the thyroid hormone receptor-1 (TR) in the nucleus and inhibits liothyronine-mediated osteoblast differentiation [101].
4.5 IGFBP6 and cancer
IGFBP6 has been indicated to be involved in the development and progression of numerous tumor types and can be used as prognostic biomarkers in various malignancies [74]. In numerous studies, IGFBP6 expression is lower in malignant than normal cells, suggesting that it has an inhibitory effect. IGFBP6 inhibits proliferation and tumor development in a number of IGF-II-dependent cancers, including neuroblastoma [105], colon [106], ovarian [107], prostate [108] and rhabdomyosarcoma [109]. Some studies have shown the opposite, which may represent a compensatory response to increased IGF-II activity or may reflect IGF-II-independent actions. A number of brief examples in different cancers follow.
4.5.1 IGFBP6 in Rhabdomyosarcoma
Rhabdomyosarcoma (RMS) is a primitive pediatric malignant soft tissue sarcoma of skeletal muscle phenotype that arises from a primitive mesenchymal cell. There are two principle RMS subtypes, embryonal (ERMS) and alveolar (ARMS). ERMS mainly affects children younger than 10 years of age [110], whereas ARMS is predominantly found in adolescents and young adults [111]. The etiology and risk factors remain largely unknown. Despite mutations in components of the IGF system have not been detected [112, 113], dysergulation of IGF signalling is important in RMS transformation and progression [114, 115]. Thus, IGF-II is an autocrine growth factor for RMS, playing an important role in the development and progression of the disease [78].
As reported in section 4, IGFBP6 inhibits the tumorigenic properties of IGF-II-action. This distinctive function of IGFBP6 compared to other IGFBPs, makes this protein a potential therapeutic candidate for IGF-II-dependent pediatric malignancies, such as RMS, where it may be possible to inhibit IGF-II in the tumor environment with minimal effect on normal growth induced by IGF-I. Moreover, IGFBP6 also promotes RMS cell migration in an IGF-independent manner; this mechanism involves MAPK pathway activation [116, 117].
4.5.2 IGFBP6 in Nasopharyngeal Carcinoma
Nasopharyngeal carcinoma (NPC) is a malignant tumor, endemic in some areas including southern China, Southeast Asia, North Africa and the Arctic, but it is rare in Europe and in the American continent [118-122]. It comes from epithelial cells that cover the surface and line the nasopharynx [123]. The symptoms include neck
masses, epistaxis, nasal obstruction and discharge, headaches and other non-specific indicators. Furthermore, considering the anatomical localization, it shows a high metastatic rate (lung, liver and bone) [124] and is diagnosticated when it is in an advanced stage [125]. A few studies have provided the effects of IGFs and IGFBPs on NPC. IGF-IR is overexpressed in malignant NPC [126] and one in vitro study has proposed IGFBP6 as a tumor suppressor [127]. Chen et al., have demonstrated that IGFBP6 is differentially expressed in NPC tissues and positive IGFBP6 expression is correlated with reduced locoregional relapse and distant metastasis risk. This study suggests that IGFBP6 may be an independent prognostic biomarker for NPC [92].
4.5.3 IGFBP6 in Glioblastoma
Glioblastoma (GBM) is the commonest and the most lethal form of brain tumor in adults. A subset of human gliomas expresses IGF1 and/or IGF2 [128] and, IGF2 is related to the aggressiveness of some GBMs [129]. Furthermore, the expression of IGF-1R is associated with shorter survival and poor response to the immunotherapeutic drug temozolomide (TMZ) [130]. A recent study showed that chemosensitive tumor cells are a source of IGFBP6, and the secretion of this protein serves to inhibit GBM progression [131]. Additionally, it has been demonstrated that higher plasma IGFBP6 levels are associated with a better prognosis for GBM patients [132, 133]. Finally, overexpression of IGFBP6 induced apoptosis and inhibited migration of glioma cells [91].
4.5.4 IGFBP6 in Breast Cancer
Breast cancer (BC) is the most prevalent type of cancer in the word, and considered to be the most invasive cancer in women. Numerous epidemiologic studies have examined the association between components of the IGF system and female breast cancer [134]. One of the most important clinical problems in the treatment of HER2+ breast cancer is the development of tumor resistance. This resistance appears to be, in large part, due to IGF signaling [135]. In HER2+ breast cancer model, the activity of the monoclonal antibody commonly used in therapy, such as trastuzumab (Herceptin) is interrupted by the increased expression of IGF-1R [136]. Furthermore, up-regulation of IGF-1R partially leads to a trastuzumab-resistance phenotype, while its down-regulation restores its sensitivity to the drug [137].
IGFBP6 expression is higher in breast cancer cells resistant to HER2 inhibition by trastuzumab than in sensitive cells, but its functional consequences are not studied
[138]. A few studies indicate that IGFBP6 can be defined as a new diagnostic marker in patients with breast cancer [139].
4.5.5 IGFBP6 in Ovarian Cancer
Ovarian cancer (OC) is the sixth commonest tumour in women [140] and is most lethal gynecologic cancer [141]. IGF-II has an important role in ovarian cancer; its levels predict poor survival in advanced stage [142]. IGFBP6 is expressed at low levels in ovarian cancers [143]. In vitro studies show opposite effects on the migration of HEY and SKOV3 ovarian cancer cells, but in both cases IGFBP6 activates the MAP kinase pathway [107]. These findings require further study.
4.6 IGFBP6 and autoimmune diseases
Recent studies have focused on the use of IGFBPs as biomarkers in autoimmune diseases, highlighting a diagnostic role. Moreover, several studies have shown the potential role in the diagnosis and monitoring of autoimmune diseases by IGFBP6 (and other IGFBPs). Nevertheless, the mechanism by which this function is explained remains partially unknown. A number of brief examples in different autoimmune diseases follow.
4.6.1 IGFBP6 as biomarker in Diabetes Mellitus
Type 1 diabetes mellitus (T1DM) is an organ-specific autoimmune disease characterized by progressive destruction of pancreatic cells, resulting in insulin deficiency and hyperglycemia [144]. The pathogenesis of T1DM appears to be different when compared with type 2 diabetes mellitus (T2DM). However, recent studies show that there are autoimmune aspects also in T2DM. This theory is based on the presence of circulating autoantibodies against cells, self-reactive T cells, but also on the glucose-lowering efficacy of some immunomodulatory therapies in T2DM [145]. Due to the close relationship to insulin, the IGF system and its binding proteins has been explored as a biomarkers in diabetes. In particular, the IGFBP6 serum levels modifications are correlated with diabetic retinopathy (RP) both in T1DM and in T2DM [146]. Furthermore, circulating levels of IGFBP6 may be useful in predicting the onset of complications in patients with T1DM. Numerous studies have shown a moderation increased of IGFBP6 in patients with T1DM and a severe increased in patients with diabetic complications such as nephropathy, photocoagulation, RP, blindness, foot ulcer, coronary artery disease (CAD),
hypertension (HTN), amputation, and peripheral neuropathy [147, 148]. These studies mainly addressed IGF-II-dependent effects of IGFBP6 and speculated that the increase of protein levels in T1DM patients can be the consequence of increased IGF-II levels induced by chronic hyperglycemia [147].
4.6.2 IGFBP6 as biomarker in Rheumatoid Arthritis
Rheumatoid arthritis (RA) is a systemic inflammatory disorder that predominantly affects the joints. The profile of IGFBPs were first characterized in the synovial fluid (SL) of RA patients, in which IGFBP2, IGFBP3 and IGFBP4 level were elevated compared to healthy donors (HD) or osteoarthritis patients (OA) [149-152]. More recently, Alunno et al., have demonstrated an increased IGFBP6 levels in RA synovial tissue (ST) compared to OA ST and a decreased of IGFBP6 levels in RA SL compared to OA SL. Furthermore, in vitro experiments showed that IGFBP6 acts as chemoattractant for RA immune cells (T cells) and this effect was partially inhibited by dexamethasone [153]. This study suggests a pathogenic role of IGFBP6 in RA and supports its therapeutic role.
5. Materials and Methods
5.1 Ethics Statement
Specific approval of the local ethics committee was obtained for this study (Ospedali Riuniti University Hospital cod. 30/CE/2014). Written informed consent was obtained from all participants.
5.2 Monocyte-derived Dendritic Cells Isolation
Nine consecutive healthy adult blood donors were recruited without regard to age, ethnic origin, or gender. Peripheral blood mononuclear cells were isolated from buffy coats by LymphoprepR densiy centrifugation resuspendend in AIM-V serum-free
medium (Thermo FisherScientific) and seeded on T25 flasks. After overnight incubation at 37°C, nonadherent cells were removed and adherent cells were cultured for 6 days with 50 ng/mL GM-CSF and 1000 U/mL IL-4 for six days in a humified 5% CO2 incubator at 37 °C [38].
In order to confirm DC phenotype, cells were stained with specific mAbs for 30 minutes at 4°C in FACS buffer Dulbecco's PBS (Lonza, Basel, Switzerland) containing 2% FBS (PAA GmbH, Pashing, Austria), washed twice and resuspended in cold FACS buffer with 0.1 g/mL propiudium iodide (PI) (Carl Roth, Karlsruhe, Germany). Subsequently, stained cells were analyzed with Epics XL-MCLTM flow cytometer (Beckman Coulter, Brea, CA, USA). Cell debrids and dead cells were excluded from analysis by gating on proper forward and sideward light scatter and on PI negative cells (~98%). For each condition, a minimum of 1x10⁴ living cells were analyzed. The results obtained were analyzed using Expo 32 ADC Software (Beckman-Coulter).
In order to confirm the DC phenotype, the following antibodies were used: anti- CD14; anti-CD80; anti-CD11c; anti-CD83; anti-HDRII (Beckman-Coulter). Some flasks were incubated at 39°C for 3 or 24 hours. For each experimental condition, appropriate controls were set up at 37°C.
5.3 Gene Expression Profiles: Sample Preparation and Hybridization
Cells were lysed in TRIZOL (Invitrogen, Frederick, MD, USA) and total RNA was purified with the QIAGEN RNeasy kit following manufacturer’s instructions. RNA was quantified with the NanoDrop ND-1000, while, the quality was checked with the 2100 Bioanalyzer (Agilent Technologies, Santa Clara, CA, USA). Five μg total RNA
were transcribed from a T7-oligo (dT) primer with SuperScript II polymerase (Invitrogen). cDNA was then purified on affinity columns and in vitro transcribed with the T7 RNA polymerase and a biotinylated dUTP. Labeled cRNA was purified on affinity columns and quantified on the NanoDrop ND-1000. Twenty μg of cRNA were fragmented and the quality was verified with the Bioanalyzer 2100 (Agilent Technologies). The biotinylated cRNA was hybridized using the Affimetrix HGU133 Plus 2.0 array, containing about 55,000 probe sets and reading frames opened by the genome databases H. sapiens GenBank, dbEST and RefSeq. The chips were scanned into the Affimetrix Complete GeneChip® Instrument System, resulting in digitized image data (DAT) files.
5.4 Microarray Data Analysis
DAT files were analyzed by Expression Console (Affymetrix Inc.). In order to normalize the full data set, the Robust Multi alignment Algorithm [154] was used. The expression values were analyzed by using GeneSpring GX 10 (Agilent Technologies). Further normalization steps included per-chip normalization to 50th percentile and per-gene normalization to median. Normalized data were filtered for fold changes greater than 2, giving a list of 67 genes on 83 probe sets. This set of differentially expressed genes constitutes our "focus gene list". The fold change represents the ratio between the averages of the normalized expression values at temperatures of 39°C and at 37°C.Microarray data are available in the ArrayExpress database (www.ebi.ac.uk/arrayexpress) with the following access number E-MTAB-697.
5.5 Analysis of Gene Expression Data
The analysis algorithm from Ingenuity Pathway Analysis (IPA; Ingenuity® Systems, www.ingenuity.com) was used in order to identify the biological functions (IPA’s biofunction tool) and knowledge-based networks (IPA’s network generation tool) from the differentially expressed focus genes. By exploiting the biological information stored in the Ingenuity Pathway Knowledge Base (IPKB) it was possible to highlight the biological functions and/or diseases associated to the considered data sets. Focus genes were associated with biological functions and/or diseases in the IPKB.
In order to calculate the probability (p-value) that each biological function/disease association is due to chance alone, the exact Fisher test was used [155]. Finally,
resulting p-values were corrected for multiple tests using the Benjamini-Hockberg False Discovery Rate (FDR) [156].
5.6 Cell Lines
Numerous cell lines have been used, among them: Human Renal Tubular (HK2), Human Aortic Endothelial Cells (HAEC), Human Colon Cancer (HCT116), Human Breast Adenocarcinoma (MCF-7 Cells), Human Prostate Cancer (PC3) and heterogeneous Human Epithelial Colorectal adenocarcinoma (CACO2).
HK2 cells were cultured in 50% DMEM and 50% HAM’s F12 supplemented with 10% fetal bovine serum, 2 mM L-glutamine, 100 IU/ml penicillin and 100 μg/ml streptomycin (Invitrogen).
HAEC were cultured in EBM™-2 (endothelial basal Medium-2), supplemented with EGM™-2 BulletKit™ (EBM™-2 plus SingleQuots™ of growth supplements) containing BBE (Bovine Brain Extract), hEGF, hydrocortisone, GA- 1000 (Gentamicin, Amphotericin-B), FBS (Fetal Bovine Serum), VEGF, hFGF-B, R3-IGF-1, ascorbic acid, heparin (Lonza).
HCT116, MCF-7 Cells, PC3 and CACO2 were cultured in Dulbecco’s modified Eagle’s medium (DMEM) supplemented with 10% fetal bovine serum (FBS), 1% PenStrep (10,000 U/mL Pen, 10 mg/mL Strep) 2 mM L-glutamine (medium and reagents from Sigma- Aldrich, Milan, Italy).
5.7 Real Time RT-PCR Analysis
For each sample, we isolated the total RNA using TRIZOL (Invitrogen), quantified the RNA using the NanoDrop-ND-1000 and checked the quality with the 2100 Bioanalyzer using the average A260/280 ratio of 2.0. Three μg total RNA were used in a from a 20 μl reaction mixture using Oligo (dT) primers and cDNA SuperScript II (Invitrogen). For real-time PCR, the following primers were used: IGFBP6, forward 5’-GGAAGCTGAGGGCTGTCTC-3’, reverse
5’-GTCTCTGCGGTTCACATCCT-3’; ARMET forward 5’-CTGAGCACAGTGGACCT-3’, reverse
5’-GGCTGTTTTGGGAGTAA-3’; PLAT forward 5’-AGGGCTGGAGAGAAAAC-3’,
reverse 5’-CTGGCTCCTCTTCTGAAT-3’; GAPDH forward
5’-CAAGGCTGAGAACGGGAA-3’, reverse 5’-GCATCGCCCCACTTGATTTT-3’. Primers were designed to be intron spanning.
The size of the products was also confirmed by gel electrophoresis. mRNA levels were expressed relative to the housekeeping gene by comparing PCR threshold cycle
(CT) between cDNA of samples and GAPDH (ΔCT). Subsequently, relative gene expression was calculated as follows: fold change = 2-Δ(ΔCT), where ΔCT = CTtarget - CThousekeeping and Δ(ΔCT) = ΔCTtreated - ΔCTcontrol. All experiments were performed in triplicate for each experimental condition. In order to assess the expression in both normothermia and hyperthermia for the three selected genes, the Student's t-test for paired data was used. All tests were two-sided and significance was set at p<0.05.
5.8 Flow Cytometry: IGFBP6 Production
After incubation for 3, 8, 24 and 48 h at 39°C moDCs were fixed in 3% paraformaldehyde and 2% sucrose in PBS and permeabilized (or not) with ice-cold Triton HEPES buffer (20 mM HEPES, 300 mM sucrose, 50 mM NaCl, 3 mM MgCl2, 0.5% Triton X-100, pH 7.4) for 5 min at room temperature. For each condition the respective control was analyzed after incubation at 37°C. Subsequently, cells were incubated with rabbit anti-human IGFBP-6 (Abcam; ab135606) for 1 h at 4°C (dilution 1:25), washed twice with PBS, and incubated with secondary antibody donkey anti-rabbit IgG (Alexafluor 488) for 30 minutes at 4°C (dilution 1:1000). Negative controls were set up by incubating the cells either only with secondary antibody or rabbit IgG, polyclonal - isotype control (Abcam, ab37415) followed by incubation with secondary antibody.
After fixation (or not), the number of dead cells was assessed using Zombie Aqua Fixable Viability kit (BioLegend, San Diego, USA). The labeled cells were washed twice with PBS and resuspended in 50l of PBS 1X according to manufacturer's protocol. The cells were analyzed by AmnisFlowsight IS100 (Merck Millipore). By plotting the Area (a parameter related to the cellular dimension) on x-axis vs Aspect Ratio (a parameter reflecting the ratio of the cell Minor Axis divided by the Major Axis) on y-axis, scatter plots of the brightfield were obtained, and then single cells events were gated. Finally, 20,000 single-cell events for sample were acquired.
Using the Amnis IDEAS software the percentage of positive green cells (Channel 2, excitation laser 488 nm) and mean fluorescence were analyzed. The value of the negative control was subtracted from the values obtained. Brightfield and green fluorescent images for any single cell event were collected. A representative image of a single cell for any condition is shown (Paragraph 6.4; Figure 14). The data
obtained by Zombie Dye staining revealed that an average of 4% of unfixed cells and 10% of fixed cells were dead.
5.9 Analysis of IGFBP6 in Conditioned Medium
After 3, 8, 24 and 48 h exposure of moDCs to 39°C (or maintained at 37°C as control), conditioned media were harvested and centrifuged at 200 x g at 4°C for 12 min and proteinase inhibitor (Aprotinin, Boehringer Mannheim GmbH) was added. Secreted protein was detected using a Bio-Plex cytokine, chemokine and growth factor assay (Bioclarma, Turin, Italy).
According to manufacturer's instructions, the assay was performed in 96-well microplates using the Human IGF Binding Protein (IGFBP-6) Magnetic Beads Panel (HIGFBMAG-53K, Millipore) at the Bioclarma - Research and Molecular Diagnostics, Turin, Italy. Undiluted supernatant samples were drawn up into the Bio-Plex 100 System array reader (Bio-Rad). This reader identifies and quantifies each specific reaction based on the bead color and on the fluorescent signal intensity. Data processing was done using the Bio-Plex Manager software (version 6.1) using the five-parametric curve fitting and converted to ng/mL. The concentration of IGFBP6 was obtained by comparing the fluorescence with that obtained from a standard curve (sensitivity limit of the assay: 0.04 ng/mL).
5.10 Apoptosis and Necrosis
In order to evaluate the rate of apoptosis/necrosis, after incubation for 3, 8, 24 and 48 h at 39°C (or 37°C as control), we used the FlowCellectTM Annexin Red Kit (Merck Millipore), according to the manufacturer's instructions. Then, the cells were stained with Annexin V conjugated with a sensitive CF647 dye (excitation laser: 642 nm, emission max: 670 nm) for 15 minutes at 37°C, washed in assay buffer and stained with 7-AAD (excitation laser: 488 nm, emission max: 642 nm) for 5 min and analyzed by AmnisFlowsight IS100 (Merck Millipore).
Brightfield aspect ratio versus brightfield area plots were generated to identify single cells events. For each condition, 20,000 single-cell events were acquired.
By plotting the fluorescence of AnnexinV (Channel 11) vs. fluorescence of 7-AAD (Channel 5), dot plots were obtained.
In dot plots it is possible to identify four different populations: (1) healthy cells, Annexin V(-) and 7-AAD(-);
(3) early apoptotic cells, Annexin V(+) and 7-AAD(-); (4) late apoptotic cells, Annexin V(-) and 7-AAD(+).
5.11 Cell Chemotaxis
PBMCs were isolated from buffy coats of healthy donors and used to purify CD14+ monocytes, CD19+ B cells and CD3+ T cells with magnetic microbeads kit (Miltenyi Biotec). We evaluated the chemotactic activity of IGFBP6 by adding monocytes, T and B lymphocytes (106 per filter) to the upper compartment of 0.33 cm2 Transwells with 3 μm-pore filters (Corning, Acton, MA, USA), while no IGFBP6 (as a negative control) or different concentrations of IGFBP6 (Peprotech, London, UK) (0.01 μg/ml, 0.1 μg/ml, 1 μg/ml) corresponding respectively to 0.4, 4 and 40 nM were dissolved in serum free Eagle's Medium minimal essential medium (MEM, Sigma-Aldrich, Milan, Italy) in the lower compartment.
As a positive control, different concentrations of SDF-1 were used (Peprotech, London, UK). The concentrations added to the lower compartment are as follows: 0.05 μg/ml, 0.5 μg/ml, 1 μg/ml and correspond to 6 nM, 60 nM and 125 nM respectively. The SDF-1 concentrations used have been shown to be optimal for chemotaxis of monocyte, T and B lymphocytes [86, 90, 116].
To evaluate the specificity of the IGFBP6 chemotactic effect, before adding the mixture in the lower compartment, we pre-incubated the protein at the highest dose with a rabbit IgG anti-human C-terminal IGFBP6 antibody (Abcam, Cambridge, UK) or with an irrelevant rabbit IgG antibody (anti-human HVCN1, Abcam, Cambridge, UK) in a weight ratio (IGFBP6/antibody) of 1:6 for 30 minutes at room temperature. As a negative control, we used recombinant human/murine/rat (insect-derived) Activin A (Peprotech, London, UK), in the lower compartment at a dose of 40 nM.
Subsequently, after 150 min, cells were recovered in the lower compartment and quantified by flow cytometry. The data obtained were expressed as a percentage of migration of the control (100%).
5.12 Neutrophils Isolation
Five-seven consecutive healthy blood donors were recruited without regard to age, ethnic origin, or gender. Leukocytes were isolated by sedimentation on a Lymphoprep gradient. After blood stratification, peripheral blood mononuclear cells were eliminated and neutrophils and red blood cells were centrifuged. Pellet was
resuspended in 1800 μL hydrogen peroxide and after 10 seconds, the reaction was blocked in 200 μL PBS 10X.
5.13 Neutrophils: IGFBP6 and ROS Production
To investigate ROS production, neutrophils were treated with IGFBP6. We have added or not IGFBP6 (as a negative control) at different concentrations of IGFBP6 (Peprotech, London, UK) (0.01 μg/ml, 1 μg/ml, 5 μg/ml) corresponding respectively to 4, 40 and 200 nM were dissolved in serum free Eagle's Medium minimal essential medium (MEM, Sigma-Aldrich, Milan, Italy) for 50 minutes. In order to evaluate whether IGFBP6 may increase or potentiate other stimuli, cells were first incubated with IGFBP6 1 μg/ml for 50 minutes and then with either N-formyl-methionyl-leucyl-phenylalanine (fMLP) 1 M or phorbol 12-myristate 13-acetate (PMA) 10 nM for 5 minutes. As a positive control, we used fMLP or PMA without the addition of IGFBP6. The fMLP and PMA concentrations used have been shown to be optimal for ROS production in neutrophils [157, 158].
After cells incubation with IGFBP6, with or without fMLP or PMA, cells were supplemented with 2,7-dichlorofluorescein diacetate (which is converted to dichluorofluorescein-DCF by intracellular esterases) for 10 minutes, washed with PBS, resuspendend in 50 l PBS and then analyzed by AmnisFlowsight IS100 (Merck Millipore).
5.14 Degranulation in Neutrophils
In order to test the involvement of IGFBP6 in degranulation of primary and tertiary granules, neutrophils were pre-incubated with IGFBP6 1 g/ml for 50 minutes and then with either fMLP 1M or with IGFBP6 alone. Then, culture supernatants were collected and stored at -80°C until enzymes quantification. Degranulation was studied in terms of release of myeloperoxidase (MPO; primary granules), matrix metalloproteinase (MMP-9) and TNF- by ELISA (R&D Systems, Minneapolis, MN, USA).
5.15 Transwell Migration Assay
Human neutrophils were isolated by Lymphoprep's blood stratification ad described in section 5.12 and then were suspended inPBS 1X.
The transmigration through the epithelium was evaluated in the basolateral to apical direction ('down' mode) in monolayers grown 3-μm-pore filters. 7 ×
104 cells were plated on the bottom Transwells (Corning, Acton, MA, USA) for 48 h and then the filters were inverted [159, 160]. Medium was added both in the lower and upper compartments. After 7 days from seeding of epithelial cells, neutrophils were added in the upper compartment (106 per filter), i.e., from the basolateral side, while in the lower compartment, ie, from the apical side, different concentrations of IGFBP6 (Peprotech, London, UK) was added. The concentrations of IGFBP6 used are shown below: 0.01 μg/ml, 1 μg/ml, 5 μg/ml, corresponding respectively to 4, 40 and 200 nM. After 150 minutes, cells were recovered in the lower compartment and quantified by flow cytometry. In order to evaluate whether IGFBP6 could have a priming effect, neutrophils were pre-incubated with IGFBP6 1 g/ml for 50 minutes, and were then added to the basolateral side of the epithelium in the presence of apical fMLP 1 M. As a positive control, fMLP was used [159]. The data obtained were expressed as a percentage of migration of the control (100%).
5.16 Statistical analysis
Data obtained from apoptosis/necrosis and chemotaxis experiments in moDCs are shown as mean ± standard error of the mean (SEM) and analyzed for statistical significance using 2-way ANOVA with Tukey’s Multiple Comparison test using Graphpad Software v. 4 (La Jolla, CA, USA). P<0.05 was considered statistically significant.
Neutrophils data presented shown mean ± SEM and analyzed using two-tailed Student's t test using Software v. 4 (La Jolla, CA, USA). P values <0.05 were considered to be statistically significant.
6. Results
6.1 moDCs exposed to mild hyperthermia present a distinct gene expression profile
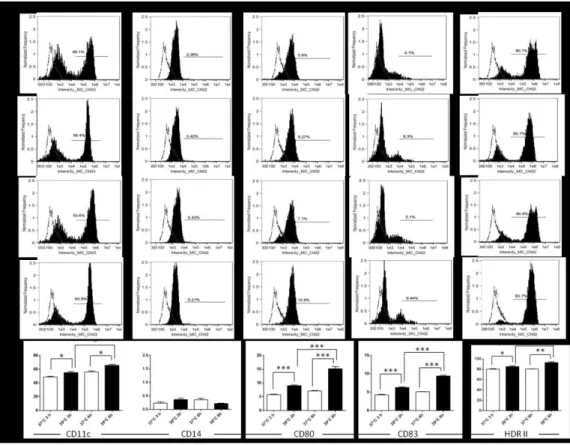
Gene expression profile was performed on nine healthy donors. In all cases, moDCs were obtained from buffy coats. After monocytes isolation, cells were differentiated into monocyte derived-dendritic cells (moDCs). In order to evaluate the phenotype in normothermia or hyperthermia, cells were incubated at 39°C for 3 and 24 h (or 37°C as a control) (Figure 8). Data shown that incubation at 39°C for 3 and 24 h resulted in a significant increase of percentage of cells expressing maturation
markers (such as CD11c, CD80, CD83, and HDRII), but not of CD14, if compared
to the control at 37°C.
Gene expression analysis demonstrated that the exposure of moDCs for 3 h at 39°C causes a significant increase in the expression of 43 genes and a decrease of another 24 genes if compared to the expression of normothermic cells (Table 1). A biologically meaningful effect was defined as significant when a greater than 2-fold difference was detected in all experiments.
Figure 8. Phenotypic characterization of moDCs. Phenotypic characterization of monocyte-derived dendritic cells was performed after differentiation and incubation for 3 h at 37°C (A) and 39°C (B) and for 24 h at 37°C (C) and 39°C (D) by staining them with specific antibodies (black filled histograms). Unstained controls are shown as dotted lines. The panels are representative of one case of the nine analyzed for gene expression. E. The percentage of maturation markers after exposure at 39°C and 37°C at different times. Data are representative of four separate experiments. All data represent means ± SEM of four independent experiments. Statistical comparisons were made using the unpaired Student's t-test. *p<0.05; **p<0.001; ***p<0.0001.
Downregulated Upregulated
Gene Symbol Fold change Gene Symbol Fold change Gene Symbol Fold change 228603_at ACTR3 2.1212146 201491_at AHSA1 3.0668783 201841_s_at HSPB1 2.105686 226025_at ANKRD28 2.3790717 217911_s_at BAG3 3.3147337 200806_s_at HSPD1 3.5899048 233011_at ANXA1 2.3608308 219966_x_at BANP 3.369214 200807_s_at HSPD1 2.923671 225166_at ARHGAP18 2.2429798 228928_x_at BANP 2.9106443 205133_s_at HSPE1 3.3237238 235088_at C4orf46 2.0362923 233186_s_at BANP 2.674547 235573_at HSPH1 3.050632 229695_at fam107b 2.348431 211761_s_at CACYBP 2.099444 208744_x_at HSPH1 6.470141 1554678_s_at HNRPDL 2.129529 210691_s_at CACYBP 2.2031457 206976_s_at HSPH1 8.415396 204334_at KLF7 2.6032488 206331_at CALCRL 2.0365825 200825_s_at HYOU1 2.0537353 230636_s_at KLF9 2.1131873 210815_s_at CALCRL 2.2632575 210029_at IDO1 2.4012868 240655_at LOC100133690 2.1164844 200910_at CCT3 2.1207094 203851_at IGFBP6* 2.2617126 244846_at MAP4K4 2.2667267 218566_s_at CHORDC1 4.3639574 207901_at IL12B 2.0140626 1558111_at MBNL1 2.2078938 204170_s_at CKS2 2.359756 227140_at INHBA 2.0002825 1569030_s_at NUB1 2.0441904 225434_at DEDD2 2.2326558 202220_at KIAA0907 3.196178 214963_at NUP160 2.017219 225061_at DNAJA4 5.536901 1558404_at LOC644242 2.2391515 225626_at PAG1 2.0477161 1554334_a_at DNAJA4 4.3517003 218559_s_at MAFB 2.2515247 213933_at PTGER3 2.5118344 1554333_at DNAJA4 2.3606193 202655_at MANF* 2.083146 554999_at RASGEF1B 3.3729293 200664_s_at DNAJB1 2.4289098 217907_at MRPL18 2.3864717 226312_at RICTOR 2.2310023 200666_s_at DNAJB1 2.4802563 209785_s_at PLA2G4C 2.0645976 209684_at RIN2 2.0676558 209015_s_at DNAJB6 3.323787 201860_s_at PLAT* 2.0551631 220123_at SLC35F5 2.102914 213145_at FBXL14 3.1741052 204186_s_at PPID 2.0264704 215078_at SOD2 2.2981791 200894_s_at FKBP4 2.268422 212706_at RASA4 2.0581238 226837_at SPRED1 2.4078321 200895_s_at FKBP4 2.213333 203164_at SLC33A1 2.208336 207983_s_at STAG2 2.0910532 222033_s_at FLT1 2.0301073 212009_s_at STIP1 2.211557 217833_at SYNCRIP 2.120536 201503_at G3BP1 2.117231 213330_s_at STIP1 3.3498967
214359_s_at HSP90AB1 2.6591988 223330_s_at SUGT1 2.3122559 200064_at HSP90AB1 2.6207926 235542_at TET3 2.130128 1557910_at HSP90AB1 3.1781142 200799_at HSPA1A 2.4917276 200800_s_at HSPA1A /// 4.0723443 202581_at HSPA1A /// 10.3153925 230031_at HSPA5 2.2923908 211936_at HSPA5 2.530812 210338_s_at HSPA8 2.1047974
* Genes also tested by RT-PCR are shown in bold
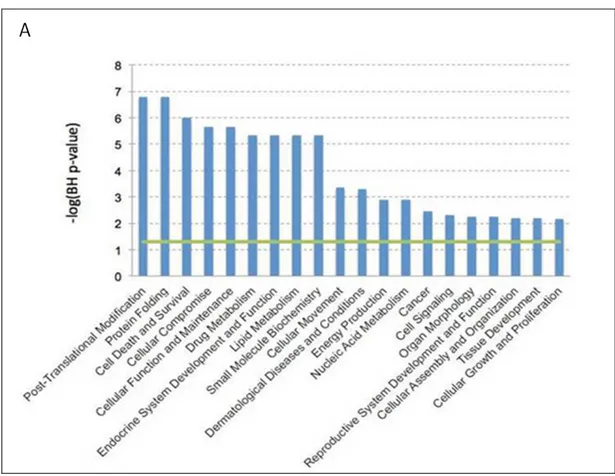
We found that exposure for 3h at 39°C causes up/down regulation of genes encoding proteins involved in post-translational modification (e.g., NUB1 and CACYBP), cellular movement (e.g., IDO1), protein folding (e.g., CCT3), and cell death and survival (e.g., ANXA1 and KLF7) (Figure 9).
Our study allowed to further investigate the key role played by DCs in the response to heat shock.
As a control, we considered the upregulation of genes encoding heat shock proteins (HSP90AB1, HSPA1A, HSPA1B, HSPA5, HSPA8, HSPB1, HSPD1, HSPE1, HSPH1). These data indicate that 3 h-exposure to 39°C may increase the
maturation of moDCs and causes a modification in the global gene expression profile of DCs.
Figure 9. Gene expression profile data analysis. DCs expression profiles were evaluated by Affimetrix HUG133 Plus 2.0 array. Data were analyzed by Expression Console (Affimetrix Inc.). All the biological functions values exceeding the threshold (-log(BH) p-value)= 1.3), represented the green line, identified by the IPA-Biofunction tool are statistically significant.
6.2 moDCs and regulation of IGFBP6
The gene expression profile showed that some up-regulated genes encode for
secreted protein, namely, MANF, PLAT, and IGFBP6; we have focused our
attention on these proteins because if a protein is secreted, it is a protein potentially capable of interacting with other immune cells through receptors.
Mesencephalic Astrocyte-derived Neurotrophic Factor (MANF) also known as Arginine-Rich Mutated in Early Tumors (ARMET) encodes for a secreted protein
[161] localized in the luminal endoplasmic reticulum (ER). Apostolou et al., have shown that the reduced expression of MANF is linked to increased susceptibility to ER stress-induced death and cell proliferation [162]. Moreover, recent studies in rodent models have showed that this gene exerts neurotrophic function in neurodegenerative disease, mitigates diabetes, protect cardiomyocytes and neurons in
myocardial infarction and cerebral ischemia [163].
Tissue-type Plasminogen Activator (PLAT) is a gene that encodes a secreted serine
protease (also known as tPA), which converts the proenzyme plasminogen to plasmin [164]. This enzyme plays a key role in cell migration, tissue remodeling and thrombus dissolution. Furthermore, plasma levels of tPA have been associated with cardiovascular disease [165].
Insulin-like Growth Factor Binding Protein 6 (IGFBP6) encodes for a secreted
protein that inhibits tumorigenic properties of IGF-II dependent cancers [86]. IGFBP6 has been shown to induce chemotaxis in Rh30 rhabdomyosarcoma cells [90, 116], to regulate cell apoptosis and migration in glioma [91] and to be a novel carcinoma prognostic biomarker [92]. In order to confirm the up-regulation of MANF, PLAT, and IGFBP6 in moDCs, RT-PCR was used. qPCR was performed on four healthy donors unrelated to the previous cohort. The data obtained allowed us to find that although there is an up-regulation of the three genes (Figure 10A), the
only gene in which statistical significance could be demonstrated was IGFBP6
(p=0.004), while, the PLAT up-regulation was not statistically significant (p=0.089). Probably, in the case of MANF, significance has not been reached due to the variability in expression levels in a small cohort. These data show that exposure
for 3 h at 39°C in moDCs causes a selective up-regulation of IGFBP6, suggesting
Figure 10. mRNA expression levels of MANF, PLAT and IGFBP6 by RT-PCR. MANF, PLAT and IGFBP6 mRNA expression in moDCs (A), HAEC (B), HK2 (C) and
monocytes (D) for 3h at 39°C under control (37°C). A. Bars represent the mean ± SEM of four different triplicate samples. Statistical comparisons were made using paired data Student's test. Difference were considered significant when p< 0.05. B., C., D. Bars represent the mean ± SEM of three different triplicate samples. Statistical comparisons were made using paired data Student's test. Difference were considered significant when p< 0.05.
6.3 The up-regulation of IGFBP6 is specific to moDCs
Subsequently, we investigated whether the up-regulation of MANF, PLAT, and IGFBP6 is a general biological phenomenon and therefore present in various cell types or if any of those genes would be differentially regulated in moDCs compared to other cells exposed at 39°C. Thus, we compared expression as measured by qPCR in ontogentically distant cell lines and we found that, while in moDCs exposure for 3h at 39°C induces ~5-fold increase of IGFBP6 expression, in human aortic endothelial cells (HAEC), in human kidney cells (HK2) and in a number of human tumor cell lines there is no gene up-regulation (Figure 10B and 10C, Figure 11) [166, 167]. We also studied the expressions of PLAT and MANF in the two ontogenetically distant cell lines (HAEC and HK2). The expressions of both genes were not significantly up-regulated (Figure 10B and 10C). In HAEC cells p-values for IGFBP6, MANF and PLAT were 0.26, 0.11, and 0.4 and in HK2 cells 0.16, 0.25, and 0.7 respectively.
In order to understand if the up-regulation was a characteristic phenomenon of the dendritic line, we evaluated if monocyte per se up-regulated IGFBP6 expression after exposure to hyperthermia. Surprisingly, we found that in this cell line IGFBP6 is not up-regulated (p=0.9) (Figure 10D).
These data indicate that up-regulation of IGFBP6 by hyperthermia is a specific in
moDCs and therefore could play a specific role in the physiology of DCs.
Considering the consistency of the data obtained, and in order to clarify its biological role in DCs, we decided to focus our attention only on IGFBP6.
Figure 11. Expression levels of IGFBP6 by RT-PCR in ontogenetically distant cell lines. IGFBP6 mRNA expression in 4 HCT116, MCF7, PC3 and CACO2 cells for 3h
at 39°C compared to the same cell lines at 37°C. Bars represent the mean ± SEM of three different triplicate samples. Statistical comparisons were made using paired data Student' test. Difference were considered significant when p< 0.05.
6.4 IGFBP6 protein expression
We decided to study by flow cytometry the time course of IGFBP6 protein expression. In order to evaluate total and plasma membrane protein expression, the study was performed both on permeabilized (total protein, Figure 12) and non-permeabilized cells (expression on the plasma membrane, Figure 13).
Figure 12. IGFBP6 expression in permeabilized moDCs. IGFBP6 expression was analyzed in moDCs after exposure for 3, 8, 24 and 48h at 39°C or for the same times at 37°C as controls. Cells were permeabilized and stained with an antibody anti-IGFBP6, followed by a secondary FITC antibody (black filled histograms). Histograms relative to the controls (cells stained only with secondary antibody) are shown with dotted lines. Gating strategy was performed considering scatter plots of control DCs at 37°C or 39°C obtained by plotting the Area vs. Aspect Ratio. Panels are representative of one case of the nine analyzed for gene expression.
Figure 13. IGFBP6 expression in non-permeabilized moDCs. IGFBP6 expression was analyzed in moDCs after exposure for 3, 8, 24 and 48h at 39°C or for the same times at 37°C as controls. Cells were stained with an antibody anti-IGFBP6, followed by a secondary FITC antibody (black filled histograms). Histograms relative to the controls (cells stained only with secondary antibody) are shown with dotted lines. Gating strategy was performed considering scatter plots of control DCs at 37°C or 39°C obtained by plotting the Area vs. Aspect Ratio. Panels are representative of one case of the nine analyzed for gene expression.