SME Development Banks: Conceptual Framework and Empirical
Analysis
A. Casagrande1, M. Spallone2,3, Fabio Massimo Mango4 & Pina Murè3,4 1
The Core and CASMEF LUISS Guido Carli, Roma, Italia 2 G. D’Annunzio University of Pescara, Roma, Italia 3
CASMEF LUISS Guido Carli, Roma, Italia 4
La Sapienza University of Rome, Roma, Italia
Correspondence: M. Spallone, G. D’Annunzio University of Pescara and CASMEF LUISS Guido Carli, Roma, Italia.
Received: February 1, 2018 Accepted: March 6, 2018 Online Published: March 14, 2018 doi:10.5430/ijfr.v9n2p112 URL: https://doi.org/10.5430/ijfr.v9n2p112
Abstract
In this paper we develop a conceptual framework to define small and medium-sized enterprise development banks (SMEDB). This conceptual effort is motivated by the lack of a clear definition of SMEDB. Once a consistent definition of SMEDB is provided, we compare a sample of banks that are SMEDB according to such definition with a sample of commercial banks. We conclude that it is possible to separate SMEDB from commercial banks in a statistically significant manner by taking into consideration a set of relevant financial indicators and we confirm the widespread idea that SMEDB play a crucial public/social role.
Keywords: SME, credit rationing, development banks JEL Codes: G21, G23
1. Introduction
The role of small and medium-sized enterprises (SMEs) in driving economic growth and boosting employment is nowadays unquestioned. What is more controversial is how to favor both the start-up and the growth of SMEs. There is a robust evidence that the lack of funding negatively affects the development of SMEs. Since credit rationing is mainly due to information asymmetries between SMEs and traditional lenders (banks), many administrations worldwide have established (public) financial agencies / operations to foster the start-up and growth of SMEs.
In this paper, we provide an exhaustive and consistent definition of small and medium-sized enterprise development banks (SMEDB), that is currently missing in the literature, and we analyze a sample of 25 banks located across all continents, that are SMEDB according to our definition.
In our definition, SMEDB are financial institutions (FI) whose mission is to support SME start-up and growth through the provision (both direct and / or through other FI) of financial services.
Given such definition, we derive two main empirical results:
1. It is possible to separate SMEDB from commercial banks by taking into consideration a set of relevant financial indicators. More precisely, it is possible to build up a discriminant function based on a set of financial indicators that is able to correctly classify our observations either as SMEDB or commercial banks;
2. SMEDB play a crucial public / social role, that is relaxing credit constraints of SMEs by means of public resources. This expectation is confirmed by our econometric analysis, in particular by the magnitude of the coefficients of the estimated discriminant function.
The paper is organized as follows. Section 2 provides the conceptual framework, with the definition of SMEDB, their focus and role. Section 3 is devoted to the empirical analysis, including a description of the survey, and a discussion of the statistical and econometric results. Section 4 concludes.
2. A Conceptual Framework for SME Development Banks
In order to carry on an empirical investigation over SMEDB we need to set up a conceptual framework that can clearly define what SMEDB (Section 2.1) are and explain what role SMEDB can play in funneling funds to SME (Section 2.2).
2.1 Definition of SME Development Banks
Our working definition of SMEDB, which will be consistently applied throughout this paper, is the following:
Definition 1. SMEDB are financial institutions (FI) whose mission is to support the start-up and the growth of SMEs
through the provision (both direct and/or through other FI) of financial services.
Given Definition 1, it is clear that SMEDB play a public / social role that is particularly relevant in developing countries and in depressed areas of developed countries. In fact, since credit markets in such areas are characterized by information asymmetries between borrowers and lenders, SMEs, especially those that are about to start up, are often credit rationed.
Definition is based on two pillars:
1. Focus. The main targets of SMEDB are SMEs. Their objective is the development (i.e., start-up and growth) of SMEs.
2. Activities. The main activity of SMEDB is the provision of financial services.
As for the first pillar, we need a clear definition of SMEs, and a solid argument for SMEs to be the target:
Definition of SMEs. A general definition of SMEs must be based on the identification of relevant dimensional and financial parameters; in practice, each country chooses different parameters to define SMEs. Throughout the paper we will rely on the definition of SMEs adopted in each one of the countries taken into consideration by our analysis. For the sake of completeness, we observe that usually the parameters that are selected to define SMEs are the number of employees, the turn-over, and the total assets (Note 1).
Why SMEs. For SMEs it is very difficult to be funded through regular credit channels, especially in emerging countries and in depressed areas of developed countries. This implies that there is a strong need for financial institutions specifically dedicated to SMEs. There are two main sources of market failures: 1) general credit market failures, since lenders are less informed than borrowers about the quality of the investment projects that are asked to be funded; 2) specific difficulties for SMEs, such as lack of a business track record for new entrepreneurs, lack of skills in presenting business plans, lack of detailed accounting data, and lack of collaterals.
As for the second pillar, we need to define what a financial institution is, and what difficulties financial institutions face in case of lending to SMEs:
Definition of financial institution. We adopt the following (very broad and operational) definition:
Definition 2. A financial institution is an agent that provides financial services and products for its clients.
In general terms, such services and products can be classified according to the type of financial institutions that supply them: commercial banks (deposits, loans, guarantees, intermediation, payment services), asset management companies (fund management), investment banks (corporate finance advisory, underwriting, others), insurance companies (life and P&C insurance products and services), leasing and factoring institutions (homonymous products), and other institutions (e.g. microfinance institutions, offering micro-loans). Obviously, universal financial institutions offer mixed combinations of all products and services.
Difficulties faced by financial institutions (mainly commercial banks) in case of lending to SMEs. Usually commercial banks are not keen on lending money to SMEs. There are two main sources of difficulties: 1) Banking practices: commercial banks require high collaterals and high interest rates to fund the investment projects undertaken by SMEs since they are considered as a very risky business; 2) Banking regulation: Basel II agreements make credit to non-rated counterparts (as the great majority of SMEs) very costly in terms of capital requirements.
2.2 Role of SMEDB
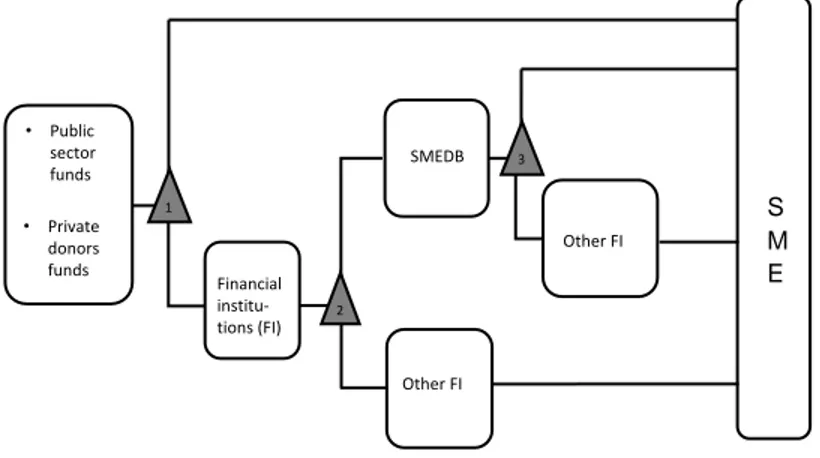
The role of SMEDB is to favor the flow of funds from donors (both public and private) to SMEs. In playing this role, SMEDB may operate either as an alternative to other financial institutions (mainly commercial banks) or in cooperation with them.
In fact, as Table 1 below explains, public and private funds reach SMEs through direct financing (including stock exchange financing) or through intermediaries that are specifically dedicated to financial and banking services
(financial institutions). Such intermediaries can be either specifically dedicated to SMEs (and this is the case of SMEDB) or not (and this is the case of all other financial institutions, such as commercial banks). In turn SMEDB can either finance SMEs directly, or use other financial institutions (mainly commercial banks) to supply financial services.
As Table 1 shows, there are three decisional nodes and correspondent trade-offs on how to funnel resources from investors / donors to SMEs:
Trade-off 1: direct versus indirect financing for donors. In case of direct financing donors retain total
control on the destination of funds. However, by letting financial institutions manage the financing process, donors take advantage the skills of financial institutions, and in particular: i) consolidated habit in evaluating the profitability of investment projects and the reliability of clients; ii) good skills in risk management practices; iii) established network of branches and offices.
Trade-off 2: use of SMEDB versus other financial institutions (mainly commercial banks) for donors. If
donors choose to let commercial banks (or other financial institutions) manage the financing process, they take advantage of their established network of branches and network. Making use of SMEDB can turn out to be convenient because of: (i) SME dedicated risk selection model; (ii) flexible collateral requirements; (iii) pricing strategies based on a fair evaluation of the risk of investment projects.
Trade-off 3: direct financing versus indirect financing (through other financial institutions, mainly
commercial banks) for SMEDB. If SMEDB choose to manage directly the financing process, they retain the total
control on the destination of funds. Opting to use other financial institutions, mainly commercial banks, as intermediaries implies taking advantage of their established network of branches and offices, and their established operations. Moreover, it implies having a lighter and more efficient (i.e., cost saving) structure.
Table 1. Flow of funds from donors to SME
SMEDB • Public sector funds • Private donors funds Other FI Financial institu-tions (FI) Other FI 1 2 3 S M E 3. Empirical Analysis
In this section, we describe our empirical investigation, aimed at highlighting the differences between SMEDB and commercial banks.
In the previous sections we provided both a definition of SMEDB (see Definition 1) and a conceptualization of their role (see Table 1). However, since the operational tools used by SMEDB to reach their goal do not differ much from those used by commercial banks to maximize their profits, the classification of banks into either SMEDB or commercial banks may be deemed to be only conceptual, especially in countries where the vast majority of firms is either small or medium. Here, we wish to point out that the differences between SMEDB and commercial banks are substantial and emerge from the analysis of a set of relevant indicators.
The basic idea is that even if commercial banks and SMEDB may both end up targeting small and medium size firms, they do it by employing different tools and strategies. In order to make these differences evident, we compare a sample of 25 SMEDB with a sample of commercial banks (Note 2). We chose to restrict our analysis to the time interval 1997-2007 in order to avoid data issues related to the financial crisis started in 2008 (Note 3).
It is important to notice that our choice of the SMEDB to sample is consistent with Definition 1: in other words, all sampled SMEDB are financial institutions whose mission is to support the start-up and the growth of SMEs through
the provision (both direct and/or through other financial institutions) of financial services.
In the next sections, we describe both the sample and the data set; then, we comment on some descriptive statistics, and on the results of the discriminant analysis that we performed in order to identify the (financial) indicators that best separate SMEDB from commercial banks.
3.1 Structure of the Sample
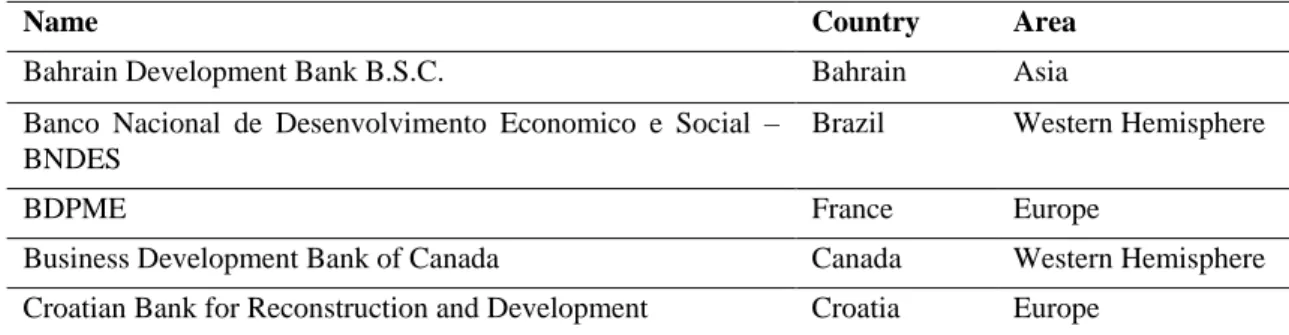
Our empirical analysis is based on a sample of 25 SMEDB located across all continents. The time interval taken into consideration goes from 1997 to 2007 for the reasons cited above. As for our knowledge, the universe of SMEDB at the time was not much larger than our sample. Hence, we think that our results are both informative and statistically significant.
Among the sampled SMEDB, 6 were located in Europe, 4 in the Western Hemisphere, 6 in Africa, and 9 in Asia. Table 2 below contains the complete list of the SMEDB sampled for our analysis.
For each one of the SMEDB listed in Table 2, we investigate four main issues: General features
Resources Services Performance
As for general features, we focus on ownership (public versus private) and distribution model (direct, indirect, or mixed). In fact, given the public role played by SMEDB, we think that it is relevant to assess whether SMEDB were publicly or privately owned. Also, since we already pointed out that SMEDB may have chosen to make funds available to SME either directly or indirectly, we think that it is very important to understand which distribution model was chosen by different SMEDB in different locations.
The investigation about resources is aimed at understanding the fund collection strategies of SMEDB. In particular, we wish to understand whether SMEDB gathered their resources on the market by competing for deposits with commercial banks or they relied on different sources. In fact, while commercial banks were obliged to collect deposits in order to perform their task, SMEDB could have had exclusive access to funds made available from public or private donors at non-market conditions.
As for services and performance, we investigate to which extent SMEDB differed from commercial banks both in terms of variety of services supplied and in terms of profitability.
Another important issue to consider could be the impact that SMEDB had on those economic systems in which they operated. In particular, for each SMEDB it could have been interesting to estimate the number of investment projects financed, the number of jobs created, the amount of sales generated,…, and in turn the total effect on economic growth. However, this task is beyond the objectives of this work.
For each one of the four issues mentioned above, we consider a set of relevant indicators. All indicators selected for our analysis will be described in details in the following sections. Now, it is useful to anticipate that all indicators are quantitative indicators, except for the two indicators that we deem relevant to analyze the general features of SMEDB, which are: ownership (public versus private) and distribution model (direct, indirect, or mixed).
Table 2. SMEDB sample
Name Country Area
Bahrain Development Bank B.S.C. Bahrain Asia
Banco Nacional de Desenvolvimento Economico e Social – BNDES
Brazil Western Hemisphere
BDPME France Europe
Business Development Bank of Canada Canada Western Hemisphere
Cyprus Development Bank Public Company Ltd. Cyprus Europe
Development Bank of Mauritius Ltd Mauritius Africa
Development Bank of the Philippines Philippines Asia
Development Bank of Zambia Zambia Africa
Economic Development Bank for Puerto Rico Puerto Rico Western Hemisphere
Finnvera Plc Finland Europe
Fiji Development Bank Fiji Asia
Industrial Development Bank of Egypt Egypt Africa
Industrial Development Bank Jordan Asia
Industrial Development Corporation of South Africa South Africa Africa
Industrial Development Corporation of Zimbabwe Zimbabwe Africa
Japan Finance Corp. for Small & Medium Enterprises Japan Asia
KfW Group Germany Europe
Nacional Financiera S.N.C. Mexico Western Hemisphere
Qatar Industrial Development Bank Qatar Asia
Oman Development Bank SAOG Oman Asia
Russian Bank for Development Russia Europe
Small Industries Development Bank of India India Asia
SME Bank of Thailand Thailand Asia
Swaziland Development Company Ltd Swaziland Africa
Data come from the annual reports, the annual balance sheets, the annual financial statements, and the official brochures of the SMEDB sampled for our analysis. The source of financial data is the data bank Bankscope from BVDEP. Hence, all financial data are consistent and homogeneous. We gathered other information (mainly about general features) by browsing the internet, and by interviewing (by phone or by e-mail) officers at the sampled banks.
As a benchmark for our analysis we consider the average data of the commercial banks located in the same countries where the sampled SMEDB were located during the time interval of our analysis. So, in the following sections whenever we compare SMEDB (either a single SMEDB or the whole sample of SMEDB) with commercial banks, we mean all commercial banks located in the countries where the SMEDB sampled for our analysis were located. The sources of the data for commercial banks are those that we mentioned above for SMEDB.
3.2 Descriptive Statistics
In terms of general features of SMEDB, descriptive statistics from our sample seem to be consistent with the SMEDB role defined in the previous sections. In fact, most of the sampled SMEDB (80%) were publicly owned, consistently with the public role that they played. Moreover, among the publicly owned SMEDB, in the great majority of the cases (85%), the share owned by the state was about 99%.
As for the distribution model, 21 out of the 25 sampled SMEDB reached their potential clients through their own branches and offices (direct distribution model); the other 4 SMEDB (located in Germany, France, Japan and Brazil) reached their potential clients through both their own offices and branches and those of private commercial banks (mixed distribution model). So, the distribution model chosen by the large majority of the sampled institutions is the direct one; however, in countries characterized by more developed financial markets a mixed distribution model was not rare.
It is quite easy to benchmark these two results on commercial banks. In fact, most commercial banks were private (even if we restrict our attention to the countries where the SMEDB sampled for our analysis were located) and all of them adopted a direct distribution model. So, in terms of ownership, it is quite easy to distinguish SMEDB from
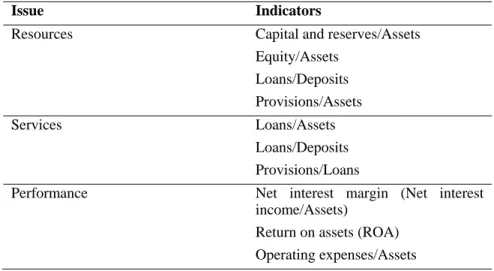
commercial banks. This result confirms that the role of SMEDB was to provide public services. In terms of distribution model, the majority of SMEDB and all commercial banks made use of a direct distribution model. It would be interesting to investigate where offices and branches were located. We expect the offices and branches of SMEDB to have been located in different areas with respect to those commercial banks: for instance, in developing countries we expect commercial banks to have had their offices and branches located in urban areas, while SMEDB to have had theirs located (at least partially) in rural areas. This investigation is beyond the scope of this paper. As for the investigation of the other issues mentioned in the previous section, we consider a set of financial indicators. They are summarized in Table 3.
Table 3. Financial indicators
Issue Indicators
Resources Capital and reserves/Assets
Equity/Assets Loans/Deposits Provisions/Assets Services Loans/Assets Loans/Deposits Provisions/Loans
Performance Net interest margin (Net interest
income/Assets)
Return on assets (ROA) Operating expenses/Assets
The ratio loans/deposits is considered twice. In fact, it provides information on: i) how important deposits are in terms of resources, and ii) how much leverage on deposits is applied in order to offer loans. For each one of the indicators listed in Table 3 and for each one of the sampled SMEDB we calculate the mean and the standard deviation over the time interval 1997-2007. Then, we perform the following two tasks:
i) A comparison between the average indicator calculated as the mean for all sampled SMEDB over the time interval 1997-2007 and the average indicator for commercial banks calculated as the mean for all commercial banks over the same time interval;
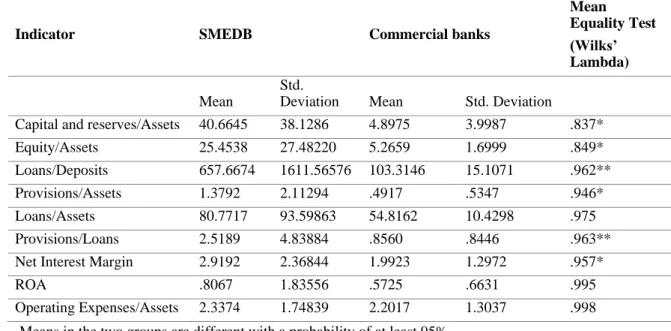
ii) A statistic test to see whether the average indicators in i) are significantly different. (Note 4) Table 4 summarizes our results.
It is worth commenting the statistics in Table 4 before showing the results of the econometric analysis (in the next section). First, the differences between SMEDB and commercial banks were not statistically significant in terms of ROA, operating expenses over assets, and loans over assets.
As for the indicators related to resources, SMEDB showed a much larger ratio of capital and reserves over assets, and a much larger ratio of equity over assets. This evidence, together with the fact that most of the SMEDB in our sample were publicly owned, provides a clear intuition about the fact that a large fraction of the resources available to SMEDB comes from the institutions that support them. In fact, the higher ratio of loans over deposits for SMEDB with respect to commercial banks confirms the idea that most of the resources were not gathered through the usual market channels (deposits and other debt instruments).
As for the indicators related to services, we already mentioned the ratio of loans over deposits and that of loans over assets. The fact that the first ratio was higher for SMEDB with respect to commercial banks and the second one is not statistically different between SMEDB and commercial banks confirms that SMEDB played their role mainly by offering loans, not differently from commercial banks; however, while SMEDB worked by leveraging on their capital, commercial banks worked by leveraging on the deposits they gathered on the market through their network of offices and branches.
As for the performance indicators, we already noticed that ROA and operating expenses over assets were not statistically different between SMEDB and commercial banks. However, from Table 4 it clearly emerges that the net interest margin of SMEDB was higher than that of commercial banks. This evidence may seem counterintuitive at first sight, since it is not easy to understand why a public good provider is more profitable than a profit maximizing agent. However, the considerations we made about the differences in terms of resources may provide an intuition about this seemingly counterintuitive evidence: in fact, while commercial banks gather their resources at market prices, SMEDB gather their resources at non-market prices exploiting a higher interest margin.
Table 4. Descriptive statistics
Indicator SMEDB Commercial banks
Mean Equality Test (Wilks’ Lambda) Mean Std.
Deviation Mean Std. Deviation
Capital and reserves/Assets 40.6645 38.1286 4.8975 3.9987 .837*
Equity/Assets 25.4538 27.48220 5.2659 1.6999 .849*
Loans/Deposits 657.6674 1611.56576 103.3146 15.1071 .962**
Provisions/Assets 1.3792 2.11294 .4917 .5347 .946*
Loans/Assets 80.7717 93.59863 54.8162 10.4298 .975
Provisions/Loans 2.5189 4.83884 .8560 .8446 .963**
Net Interest Margin 2.9192 2.36844 1.9923 1.2972 .957*
ROA .8067 1.83556 .5725 .6631 .995
Operating Expenses/Assets 2.3374 1.74839 2.2017 1.3037 .998
* Means in the two groups are different with a probability of at least 95% ** Means in the two groups are different with a probability of at least 90%
3.3 Discriminant Analysis
Our econometric investigation consists of a discriminant analysis. Our objective is to pinpoint the indicators which are able to separate (identify) SMEDB from commercial banks.
The purpose of any discriminant analysis is to classify objects (people, customers, things, etc.) into one of two or more groups based on a set of features that describe the objects (e.g. gender, age, income, weight, preference score, etc.). Notice that the groups are known or predetermined and do not have order (i.e. nominal scale). Thus, when performing a discriminant analysis, the dependent variable (Y) is the group and the independent variables (X) are the object features that might describe the group. The dependent variable is always a category (either nominal or scale) variable while the independent variables can be any measurement scale (nominal, ordinal, interval, or ratio). If we can assume that the groups are linearly separable, we can use a linear discriminant model, that is a linear combination of features, to identify each one of them.
Here, we want to know whether a bank was an SMEDB or a commercial bank. The class category or the group (“SMEDB” and “commercial banks”) is what we are looking for (i.e., it is the dependent variable). Each indicator listed in Table 3 is a potential “feature of the object” that can work as an independent variable to be put into a linear discriminant model.
In our analysis we label the group that contains SMEDB as Group 0 and the group that contains commercial banks as Group 1. SMEDB in Group 0 are those listed in Table 2; for all SMEDB we consider the mean over the time interval 1997-2007. Commercial banks in Group 1 are fictitious; in fact, each observation in Group 1 does not represent a single commercial bank, but rather the average across all commercial banks located in the same countries where SMEDB were located. Even for the commercial banks in Group 1 we consider the mean over the time interval 1997-2007.
Among all financial indicators listed in Table 3, our stepwise procedure excluded only the ratio of loans over deposits, and the ROA (that is, these two indicators were not deemed significant to separate SMEDB from commercial banks). Moreover, since we decided to exclude all observations for which we did not have a complete record, we also excluded the ratio of capital and reserves over assets in order not to reduce the size of our sample too much. So, the number of observations for our discriminant analysis is 48 and the number of independent variables considered in our model is 6.
Our discriminant model is able to classify in the right way 94% of our observations as Table 5 below clearly shows.
Table 5. Discriminant analysis performance Group Number of Observations Prediction Errors (%) Group 0 Group 1 0 23 21 2 9.5 1 25 1 24 4.2
So, in general terms our model is able to separate successfully SMEDB from commercial banks. Hence, our econometric analysis seems to confirm the intuitions of the descriptive statistics illustrated in the previous section. However, in order to further investigate these results, it is important to analyze the coefficients attached to each one of the features considered for the analysis.
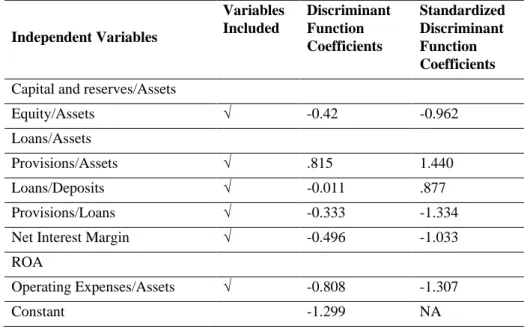
Table 6 below shows these coefficients.
The results described in Table 6 are slightly different from those of Table 4. In fact, while in Table 4 the differences between SMEDB and commercial banks were not statistically significant in terms of ROA, operating expenses over assets, and loans over assets, here the variables excluded from the analysis by our stepwise procedure are capital and reserves over assets, loans over assets, and ROA. This result confirms the fact that both ROA and the ratio of loans over assets are not useful separating devices; however, it is important to notice that the ratio of capital and reserves over assets is not in the discriminant function even if its mean was significantly different across the two groups.
Table 6. Discriminant analysis coefficients
Independent Variables Variables Included Discriminant Function Coefficients Standardized Discriminant Function Coefficients Capital and reserves/Assets
Equity/Assets √ -0.42 -0.962
Loans/Assets
Provisions/Assets √ .815 1.440
Loans/Deposits √ -0.011 .877
Provisions/Loans √ -0.333 -1.334
Net Interest Margin √ -0.496 -1.033
ROA
Operating Expenses/Assets √ -0.808 -1.307
Constant -1.299 NA
As for the indicators related to resources, we already mentioned the surprising exclusion of the ratio of capital and reserves over assets from our discriminant function. The positive coefficient attached to the ratio of equity over assets is consistent with the descriptive statistics in Table 4. This evidence confirms the intuition that a large fraction
of the resources available to SMEDB came from the institutions that supported them. In fact, the negative coefficient attached to the ratio of loans over deposits for SMEDB with respect to commercial banks confirms the idea that most of the resources were not gathered through the usual market channels (deposits and other debt instruments).
As for the indicators related to services, we already mentioned the ratio of loans over assets. As for the ratio of loans over deposits, the negative coefficient attached to this indicator confirms that while SMEDB worked by leveraging on their capital, commercial banks worked by leveraging on the deposits they gathered on the market through their network of offices and branches. Another interesting intuition is provided by the negative coefficient attached to the ratio of provisions over loans. This coefficient may indicate that either SMEDB tended to employ more prudent lending policies or that the pool of customers of SMEDB was riskier than the pool of customers of commercial banks, thus inducing SMEDB to be more prudent.
As for the performance indicators, while in Table 4 operating expenses over assets were not statistically different across SMEDB and commercial banks, in Table 6 the negative coefficient attached to this ratio indicates that SMEDB were less efficient than commercial banks. This is probably due to the fact that SMEDB that were located in developing countries had to bear high operating expenses to make their services available to SMEs. More importantly, the coefficient attached to the net interest margin confirms the fact that SMEDB were more profitable than commercial banks. This result strengthens our previous conclusion, that is while commercial banks gathered their resources at market prices, SMEDB gathered their resources at non-market prices exploiting a higher margin. As for errors, we must distinguish between Type 0 errors and Type 1 errors. Type 0 errors occur when a Group 0 observation (SMEDB) is classified as a Group 1 observation (commercial banks). The two Type 0 errors refer to BDPME and KfW, located in France and Germany respectively. An analysis of these errors highlights the fact that for both cases the misclassification is mainly due to:
A much smaller equity/assets ratio than their group mean; A smaller net interest margin than their group mean.
Since both SMEDB were located in developed countries, one may think that the difference between SMEDB and commercial banks in developed countries is probably more subtle. In particular, this difference may be found by looking at the services supplied (guarantees, consulting, etc….) more than by looking at the financial structure. The Type 1 error refers to commercial banks located in Japan. Since this observation is actually an aggregated observation as we mentioned above, it is quite difficult to interpret this error. However, Japanese commercial banks seemed to have an average net interest margin higher than that of other commercial banks. This may be due to the fact that official rates were very low in Japan during the time interval considered for our analysis.
4. Concluding Remarks
In this paper we developed a conceptual framework to define SMEDB. The need of such framework was motivated by the lack of a clear definition of SMEDB.
Consistently with our definition of SMEDB, we selected a sample of 25 SMEDB located across all continents and performed an in-depth analysis over such sample: in particular we carried on a discriminant analysis aimed at separating SMEDB from commercial banks. The main econometric result is that it is possible to build up a discriminant function based on a set of financial indicators that is able to correctly classify our observations either as SMEDB or as commercial banks. In terms of economic intuition, our results confirm the idea that SMEDB provided public services.
In particular, our empirical investigation indicates that a large fraction of the resources available to SMEDB comes from the institutions that support them and are not gathered through the usual market channels (deposits and other debt instruments). In fact, we find that while SMEDB work by leveraging on their capital, commercial banks work by leveraging on the deposits they gather on the market through their network of offices and branches.
As for the performance indicators, we find that SMEDB incur in higher operating expenses than commercial banks. This is probably due to the fact that SMEDB that are located in developing countries must bear high operating expenses to make their services available to SME. More importantly (and surprisingly), in our analysis SMEDB end up being more profitable than commercial banks. Given our findings about operating expenses, this result strengthens our previous conclusion, that is while commercial banks gather their resources at market prices, SMEDB gather their resources at non-market prices exploiting a higher margin.
References
Bossone, B. (1999). What Makes Banks Special? A Study of Banking, Finance, and Economic Development. The
World Bank, Policy Research Working Paper Series, 2408. https://doi.org/10.1596/1813-9450-2408
Bruck, N. (1998). Role of Development Banks in the Twenty-First Century. Journal of Emerging Markets, 3(3), Fall-Winter, 39-67.
Bull, B., & Boas, M. (2003, July). Multilateral Development Banks as Regionalising Actors: The Asian Development Bank and the Inter-American Development Bank. New Political Economy, 8(2), 245-61. https://doi.org/10.1080/13563460307176
Bulow, J., & Rogoff, K. (2005, May). Grants versus Loans for Development Banks. American Economic Review,
95(2), 393-97. https://doi.org/10.1257/000282805774669727
Callison, S. (2003, August). “All You Need Is Love”? Assessing Time Banks as a Tool for Sustainable Economic Development. Local Economy, 18(3), 264-67. https://doi.org/10.1080/0269094032000111048d
Culpeper, R. (1997). The multilateral development banks. Titans or behemoths?. Boulder and London: Rienner; Ottawa: North-South Institute.
Eccles, S., & Gwin, C. (1999). Supporting effective aid: A framework for future concessional funding of multilateral development banks. Policy Essay, no. 23. Washington, D.C.: Overseas Development Council, distributed by Johns Hopkins University Press, Baltimore.
Hafsi, T. (2003). Strategic Management and Change of Structurally Global Organizations: The Case of Development Banks. Globalization and multicultural societies: Some views from Europe, 41-58.
Holbik, K. (1969, November). Development Banks: A Catalyst for Economic Progress. Rivista Internazionale di
Scienze Economiche e Commerciali.
Kuo, H. C., et al. (2002). Contingent Fuzzy Approach for the Development of Banks' Credit-Granting Evaluation Model: The Case of Taiwan. International Journal of Business, 7(2), 53-65.
Lindbaek, J., Pfeffermann, G., & Gregory, N. (1998). The Evolving Role of Multilateral Development Banks: History and Prospects. EIB Papers, 3(2), 61-81.
Mistry, P. S. (1995). Multilateral development banks: An assessment of their financial structures, policies and
practices. The Hague: Forum on Debt and Development.
Okazaki, T., & Ueda, K. (1995, December). The Performance of Development Banks: The Case of the Reconstruction Finance Bank. Journal of the Japanese and International Economies, 9(4), 486-504. https://doi.org/10.1006/jjie.1995.1027
Sanford, J. E. (1975, April). Development Theory and the Multilateral Development Banks: An Assessment of the Effectiveness of Strategies Used in International. American Journal of Economics and Sociology, 3(42), 175-95. https://doi.org/10.1111/j.1536-7150.1975.tb01176.x
Schmidt, Wilson E. (1979). Rethinking the Multilateral Development Banks. Policy Review, 10, Fall, 47-61.
Notes
Note 1. In the US, SMEs are defined as those firms with either total number of employees below 500, or turn-over below 5 million US dollars; in Europe they are firms with either total number of employees below 250, or turn-over below 50 million Euros, or total assets below 43 million Euros.
Note 2. As it will be clear in the next sections, this sample consists of all commercial banks located in the same countries where the SMEDB in our sample are located.
Note 3. The recent financial crisis induced substantial changes to the financial structure of many financial institutions, both private and public. We decided not to deal with the effects of the financial crisis since they are not relevant for the objective of this paper and may be misleading.
Note 4. We also performed some robustness check by adopting different tests (for example, t-tests), but we ended up with the same results.