Transcriptional and epigenetic analyses of the DMD locus reveal novel cis'acting DNA elements that govern muscle dystrophin expression
Samuele Gherardi, Matteo Bovolenta, Chiara Passarelli, Maria Sofia Falzarano, Paolo Pigini, Chiara Scotton, Marcella Neri, Annarita Armaroli, Hana Osman, Rita Selvatici, Francesca Gualandi, Alessandra Recchia, Marina Mora, Pia Bernasconi, Lorenzo Maggi, Lucia Morandi, Alessandra Ferlini, Giovanni Perini
PII: S1874-9399(17)30135-9
DOI: doi:10.1016/j.bbagrm.2017.08.010
Reference: BBAGRM 1181
To appear in:
Received date: 9 May 2017
Revised date: 2 August 2017
Accepted date: 28 August 2017
Please cite this article as: Samuele Gherardi, Matteo Bovolenta, Chiara Passarelli, Maria Sofia Falzarano, Paolo Pigini, Chiara Scotton, Marcella Neri, Annarita Armaroli, Hana Osman, Rita Selvatici, Francesca Gualandi, Alessandra Recchia, Marina Mora, Pia Bernasconi, Lorenzo Maggi, Lucia Morandi, Alessandra Ferlini, Giovanni Perini , Transcriptional and epigenetic analyses of the DMD locus reveal novel cis'acting DNA elements that govern muscle dystrophin expression, (2017), doi: 10.1016/ j.bbagrm.2017.08.010
This is a PDF file of an unedited manuscript that has been accepted for publication. As a service to our customers we are providing this early version of the manuscript. The manuscript will undergo copyediting, typesetting, and review of the resulting proof before it is published in its final form. Please note that during the production process errors may be discovered which could affect the content, and all legal disclaimers that apply to the journal pertain.
ACCEPTED MANUSCRIPT
TRANSCRIPTIONAL AND EPIGENETIC ANALYSES OF THE DMD LOCUS REVEAL
NOVEL CIS-ACTING DNA ELEMENTS THAT GOVERN MUSCLE DYSTROPHIN
EXPRESSION.
Samuele Gherardi1,2,3, Matteo Bovolenta1^, Chiara Passarelli1,4^, Maria Sofia Falzarano1^, Paolo
Pigini2, Chiara Scotton1, Marcella Neri1, Annarita Armaroli1, Hana Osman1, Rita Selvatici1,
Francesca Gualandi1, Alessandra Recchia5, Marina Mora6, Pia Bernasconi6, Lorenzo Maggi6, Lucia
Morandi6, Alessandra Ferlini1,7*§ & Giovanni Perini2,3*§
1) Unit of Medical Genetics, Department of Medical Sciences, University of Ferrara, Italy 2) Department of Pharmacy and Biotechnology, University of Bologna, Bologna, Italy 3) CIRI Health Sciences & Technologies (HST), Bologna, Italy
4) Paediatric Hospital Bambino Gesù, Laboratory of Medical Genetics, Rome, Italy 5) Department of Life Sciences, University of Modena & Reggio Emilia, Modena, Italy
6) Neuromuscular Disease and Immunology Unit, Fondazione IRCCS Istituto Neurologico “C. Besta”, Milan, Italy
7) Neuromuscular Unit, Great Ormond Street Hospital, University College London, UK
^co-second authors
* equally contributing to the manuscript
ACCEPTED MANUSCRIPT
Abstract
The dystrophin gene (DMD) is the largest gene in the human genome, mapping on the Xp21 chromosome locus. It spans 2.2Mb and accounts for approximately 0,1% of the entire human genome. Mutations in this gene cause Duchenne and Becker Muscular Dystrophy, X-linked Dilated Cardiomyopathy, and other milder muscle phenotypes. Beside the remarkable number of reports describing dystrophin gene expression and the pathogenic consequences of the gene mutations in dystrophinopathies, the full scenario of the DMD transcription dynamics remains however, poorly understood. Considering that the full transcription of the DMD gene requires about 16 hours, we have investigated the activity of RNA Polymerase II along the entire DMD locus within the context of specific chromatin modifications using a variety of chromatin-based techniques.
Our results unveil a surprisingly powerful processivity of the RNA polymerase II along the entire 2.2 Mb of the DMD locus with just one site of pausing around intron 52. We also discovered epigenetic marks highlighting the existence of four novel cis-DNA elements, two of which, located within intron 34 and exon 45, appear to govern the architecture of the DMD chromatin with implications on the expression levels of the muscle dystrophin mRNA.
Overall, our findings provide a global view on how the entire DMD locus is dynamically transcribed by the RNA pol II and shed light on the mechanisms involved in dystrophin gene expression control, which can positively impact on the optimization of the novel ongoing therapeutic strategies for dystrophinopathies.
KEY words: dystrophin; Duchenne Muscular Dystrophy (DMD); Becker Muscular Dystrophy (BMD); Transcriptional Regulation; Chromosome. Conformation Capture (3C); RNA Pol II Pausing.
ACCEPTED MANUSCRIPT
1. Introduction
Mutations in the dystrophin gene (DMD) cause Duchenne Muscular Dystrophy (OMIM *310200), an X-linked muscle disorder, characterized by the complete absence of the dystrophin protein. Milder allelic forms are both the Becker Muscular Dystrophy (BMD, OMIM *300376), presenting a disease course mitigated by the presence of a residual Dystrophin expression, and the X-linked dilated cardiomyopathy (XLDC, OMIM *302405) characterized by predominant heart involvement. Other allelic milder disorders such as quadriceps myopathy and isolated high CK can also occur. The DMD gene consists of 79 exons and 78 introns encoding for at least seven distinct isoforms, whom transcription is driven by seven different promoters. Moreover, such promoters have a tissue- and time-specific regulation [1]. Three of them drive the transcription of full-length isoforms that share 78 exons, but with one first exon that is unique to each isoform. The three full-length isoforms are named Dp427b, Dp427m and Dp427p, where b-brain, m-muscle and p-purkinje indicate the tissue specificity or prominent expression of their synthesis: brain (cerebral cortex and hyppocampus), striated muscle (including skeletal and cardiac muscle) and cerebellum Purkinje cells respectively. Nevertheless, Dp427b shows ectopic expression sites, and is present in some brain compartments as well as in the heart, the Dp427m is expressed in the muscle and heart, whereas the Dp427p is exclusively present in brain, depending on the developmental stage [1]. Furthermore, other four promoters have been recognized to drive short DMD isoforms. The promoters are localized within intron 29 (retinal isoforms or Dp260, R), intron 44 (Brain specific isoform or Dp140, B3), intron 55 (Schwann cells isoform or Dp116, S) and intron 62 (General isoform or Dp71, G) [2].
ACCEPTED MANUSCRIPT
The large genomic size of DMD is due to the presence of extremely large introns, which account for roughly 99% of DMD genomic locus [3].
For all these variegated reasons, the transcription of the DMD locus is known to be a very complex process, which remains however, poorly understood. This is somehow surprising considering that in the last years, novel therapies have emerged to treat DMD, acting on splicing modulation or translation modification [4, 5] and there is no doubt that these therapeutic protocols would tremendously benefit from a deeper understanding of the transcription and splicing regulatory mechanisms the DMD locus undergoes. Nonetheless, relatively few studies were published about
DMD transcription regulation. Among these, Tennyson et al. evaluated the time required to
complete DMD gene transcription, being 16 hours [6]. Studies carried out in mouse (in vivo) and human skeletal muscles (in vitro) identified one enhancer element, named Dystrophin muscle enhancer-1 (DME-1) [7, 8] which shows a specific tissue regulation, exerting its activity only on the Dp427m isoform expressed in skeletal muscle [9], through specific DNA sequences [10] and specific muscle transcription factors such as MyoD [11]. More recently, it has been shown that Dystrophin production is under the control of a variety of RNA molecules (miRNAs or lncRNAs). Among these, some miRNAs, named dystromirs, can regulate Dystrophin expression in trans, by acting via binding to the 3’UTR regions of the cognate transcript, and are increased in patients’ muscle and plasma, possibly representing prognostic biomarkers [12]. In addition to that, we have also recently identified five novel long non-coding RNAs, transcribed inside the DMD locus that downregulate the basal transcription status of dystrophin [13]. Even more recently, the dystrophin splicing has been finely studied and recursive multistep splicing occurs, as a further demonstration of the complex regulation of the processing of this extremely large gene [14].
The long DMD locus transcription timing (16 hours) suggests that mechanisms through which RNA polymerase II accomplishes this task might be very complex. For instance, it is not entirely known the set of cis and trans regulatory elements that control transcription from the many dystrophin promoters. Furthermore, it is not clear whether RNA pol II proceeds at a constant pace over the 2,2
ACCEPTED MANUSCRIPT
Mb region or instead pauses at specific sites and whether these pausing sites are functional to the proper maturation of the dystrophin transcripts as recently observed for genes in yeast [15].
Based on these premises, we have analyzed the activity of RNA pol II during the transcription of the dystrophin gene using a ChIP-chip approach. Moreover, the major modifications of the RNA pol II CTD (carboxyl-terminal domain) (phosphorylation on Serine 5 and/or Serine 2) suggestive of transcript elongation or pausing were monitored and correlated with the chromatin context.
Our findings unveil a surprisingly powerful processivity of the RNA pol II along the entire 2.2 Mb of the DMD locus with just one site of pausing in intron 52. More importantly they highlighted the existence of remarkable cis-DNA elements within the body of the DMD gene that govern the architecture of the DMD locus. Our report, for the first time, describes novel cis-acting regulatory elements required for dystrophin expression, with a potential repercussion on the optimization of novel therapies.
ACCEPTED MANUSCRIPT
2. Materials and Methods
2.1 Cell cultures and treatments: Human rhabdomyosarcoma SJCHR30 cells were cultured in
Dulbecco's modified Eagle's medium containing 10% fetal bovine serum (FBS) and 50 mg/ml gentamycin and grown at 37 ºC and 7% CO2. Human HeLa cells were cultured in Dulbecco's
modified Eagle's medium containing 10% heat-inactivated FBS and 50 mg/ml gentamycin and grown at 37 ºC and 5% CO2. 5,6-Dichlorobenzidazole 1-beta-D ribofuranoside (DRB) was
purchased from Sigma-Aldrich and cells were treated for 6h at 100mM before performing quantitative ChIP (qChIP). C2C12 cells were grown in Dulbecco's modified Eagle's medium containing 25 mM glucose 20% heat-inactivated FBS and 50 mg/ml gentamycin at 37 ºC, at 5% CO2.
2.2 qChIP: ChIP was performed as previously described [16]. The antibodies employed in this
study were: Anti-RNA polymerase II Abcam (ab76123), Anti-RNA polymerase II CTD repeat YSPTSPS (phospho S2) Abcam (ab5095), Anti-RNA polymerase II CTD repeat YSPTSPS (phospho S5) Abcam (ab5131), Anti-Acetyl Histone H3 Upstate (06-599), Anti-Dimethyl Histone H3 (Lys4) Upstate (07030), Anti-Trimethyl Histone H3 (Lys 36) Abcam (ab9050).
Specific pairs of primers used for qChIP are listed in Supp. Table 1. Dual ChIP assays were performed as described [17].
2.3 ChIP on chip: Design of the chip array. DMD-ChIP microarray design was performed using
the web based Agilent eArray database version 4.5 (Agilent Technologies, Santa Clara, CA). The high density of a CGH search function within eArray was used to turn the genomic region into a probe set by selecting the maximum number of 60mer oligonucleotide ChIP probes available in the database. This probe set included 28086 probes that were enriched with 12000 probes from the High density Agilent database covering the DMD locus and 2076 probes, replicated to fill the array, from the genes selected as controls (Myoglobin, neurotrophic tyrosine kinase receptor, protein
ACCEPTED MANUSCRIPT
kinase C substrate 80K-H isoform 1, Homo sapiens primary neuroblastoma cDNA and Creatine Kinase) to reach the array format of 4 × 44 K, creating four identical 44 K arrays on a single slide for simultaneous analysis of four different samples.
Immunoprecipitated DNA from ChIP was amplified with GenomePlex® Whole Genome
Amplification (WGA) Kit according to manufacturer's instructions. Labelling and hybridisation were performed following the protocols provided by Agilent (Agilent Oligonucleotide Array-Based CGH for Genomic DNA Analysis protocol v5.0). The array was analysed with the Agilent scanner and the Feature Extraction software (v9.1). A graphical overview and analysis of the data were obtained using the Agilent Genomic Workbench software (v7.0.4). Row data were statistically analysed by using Blank Subtraction and Variance stabilization algorithm (Agilent Technologies) for data normalization, Whitehead Per-Array Neighbourhood Model and Whitehead Error Model method algorithms for peak detection and statistical significance (Agilent Technogies).
The full microarray data has been deposited in the NCBI GEO as series GSE66571.
2.4 Cloning and Luciferase assay: The pGL3-basic and Renilla-TK vectors were obtained from
Promega. The promoter regions of the Dp427m isoform along with those corresponding to intron 52 or exon 62 were obtained using PCR and cloned into the pGL3-basic vector. Specific primer pairs are listed in S1 Tab. The activity of firefly or Renilla luciferase was measured with a dual luciferase assay kit (Promega) according to the instructions.
2.5 Chromosome Conformation Capture: 1 × 10⁷ cells were resuspended in 10 ml 1X PBS
supplemented with 10% FBS and incubated with 1% formaldehyde for 10 min at room temperature. To stop formaldehyde crosslinking reaction, 0,5ml of 2,5M Glycine were added and cells were incubated on ice for 10 min. Cells were spun at 225g for 8 min and pellet was incubated on ice for 20 min with 5 ml of Cell Lysis buffer (10mM Tris-HCl Ph8; 10mM NaCl; 5mM MgCl2; 0,1mM
ACCEPTED MANUSCRIPT
collected and resuspended in 0,6 ml of 1,13X NEB buffer 4+BSA. Nuclei were incubated with 0,3% SDS for 1h at 37 ºC while shaking at 900 rpm, than Triton X-100, they were added to a final concentration of 2% and nuclei were incubated for 1h at 37 ºC while shaking at 900 rpm. 800 U of XbaI restriction enzyme were added and the reaction was incubated overnight at 37 ºC at 900 rpm. The day after, digested nuclei were incubated 1,6% SDS at 65ºC for 25 min at 900 rpm. After SDS incubation, digested nuclei were re-suspended in 6 ml of 1X NEB T4 ligase buffer and incubated with 1% Triton X-100 for 1h at 37ºC with gently shaking. Then, nuclei were incubated with 300 U NEB T4 ligase for 6 hours at 16°C. After ligation, cross-linking was reversed by incubation with 130 mg Proteinase K (Roche) at 65ºC o/n. DNA was purified by Phenol/Chloroform/Isoamyl extraction, ethanol precipitated. As negative controls, non cross-linked cells were used. qPCR (TaqMan® Environmental Master Mix 2.0, Life-Technologies) with primer pairs and probes (Tab S1) specifically amplifying the looped product as well as the control product was performed according to manufacturer's instructions. Moreover, intra and extra chromosomal negative controls were used. For each amplicon, the qPCR reactions were terminated when the samples with lowest threshold cycle number were in the late exponential phase and loaded on agarose gels for relative quantification of specific amplicons.
2.6 Patients: A total of nine patients with Becker muscular dystrophy were selected from a cohort
using as inclusion criteria the presence of deletion mutations comprising exons 34, 45, 34–45 or none of these regions. In the BMD patient with a 13-34 deletion, the intron-34 breakpoint was distal to the DMI34 region, assessed by PCR analysis. A muscle from a healthy subject was used as a control. Skeletal muscle biopsies were obtained from the Telethon Biobank of the C. Besta Neurological Institute of Milan (Italy).
2.7 Protein analysis by Western Blotting: For Western blotting analysis, proteins were
ACCEPTED MANUSCRIPT
et al [18]. An amount of 40-60 g of total proteins was loaded onto a 6% polyacrylamide gel and transferred onto nitrocellulose membranes. Membranes were incubated overnight at 4°C with Dys2 (1:50, Leica) and sarcomeric alpha-actinin (as a loading control, 1:7500, Sigma) primary antibodies. After several washings, membranes were incubated for 1 hour with secondary antibodies: anti-mouse IR800 (for dystrophin detection, 1:15000, Licor) and anti-anti-mouse IR680 (for alpha-actinin detection, 1:15000, Licor). Membranes were imaged using a LiCor Odyssey scanner. For quantification, dystrophin intensity was normalized to alpha-actinin using ImageJ software and expressed as a percentage of control.
2.8 DMD Gene Micro Fluidic Card (FluiDMD) Analysis: Total RNA was isolated from muscle
samples using the RNeasy Kit (Qiagen, Valencia, CA). Before cDNA synthesis, RNA was pre-treated with DNAse I (Roche, Branford, CT) and checked for residual DNA contamination by a 55-cycle PCR. All transcripts originating from the DMD locus were explored using a slightly modified design of previously reported Micro-Fluidic Card [19]. Briefly, 250 ng of RNA from each sample were retrotranscribed using High-Capacity cDNA Reverse Transcription Kit (Applied Biosystem, Foster City,CA) in a volume of 20 μl, according to the manufacturer instructions To this quantity 100 ml of 2× Universal Master mix (Applied Biosystem) and 80 μl of sterile water were added. 100μl per port of the resulting mixture were loaded onto the fluidic cards, which were run on a Real-Time 7900HT appliance (Applied Biosystem). Evaluation of all transcripts originating from the DMD locus compared with ACTB, used as endogenous control, and relative quantification were performed by the comparative CT method (∆∆CT Method; Applied Biosystem User Bulletin #2). A variation in the representation of an exon junction was evaluated by subtracting the CT of each system from ACTB system in both the test and control samples. The total ∆CTs in the test sample thereby obtained were subtracted from the corresponding ∆CTs in the control sample. Thus, the amount of each exon junction was given by the ∆∆CTs of a single system elevated by 2–∆∆CT.
ACCEPTED MANUSCRIPT
2.9 Bioinformatics analysis of the DMI52 regionWe performed TF motif finding using LASAGNA (Length-Aware Site Alignment Guided by Nucleotide Association, http://biogrid-lasagna.engr.uconn.edu/lasagna_search) algorithm. We intentionally restricted the TF search to Vertebrate TRANSFACT matrices collection.
To sort for TFs expressed in human rhabdomyosarcoma SJCHR30 cells, we retrieved RNA-seq data available in the gene quantification tables from 2 biological replicates loaded in the processed data
section of the ENCODE project ENCSR568YRP
(https://www.encodeproject.org/experiments/ENCSR568YRP). To convert the ENSEMBL genes ID to HGNC symbol (HUGO Gene Nomenclature Committee), we employed BIOMART (www.ensembl.org/biomart/martview). We arbitrarily defined “expressed” a gene showing the FPKM (fragment per kilobase of exon per million fragment mapped) value >10. The list of 115 putative TFs was merged with the list of 7165 expressed genes in SJCHR30 cells by using Galaxy (https://usegalaxy.org). The merge retrieved 37 human TFs expressed in rhabdomyosarcoma SJCHR30 cells. Gene Set Enrichment Analysis was performed with GSEA software (http://www.broadinstitute.org/gsea/index.jsp) on expressed TFs. Gene set represented by expressed TFs gave raised to Reactome pathways derived from the Molecular Signatures Database (http://www.broadinstitute.org/gsea/msigdb/index.jsp). A gene interactions network among the expressed TFs was mapped using the web-available software STRING (http://string-db.org).
ACCEPTED MANUSCRIPT
3. Results
3.1 Mapping RNA Polymerase II activity along the DMD locus through a ChIP-chip approach
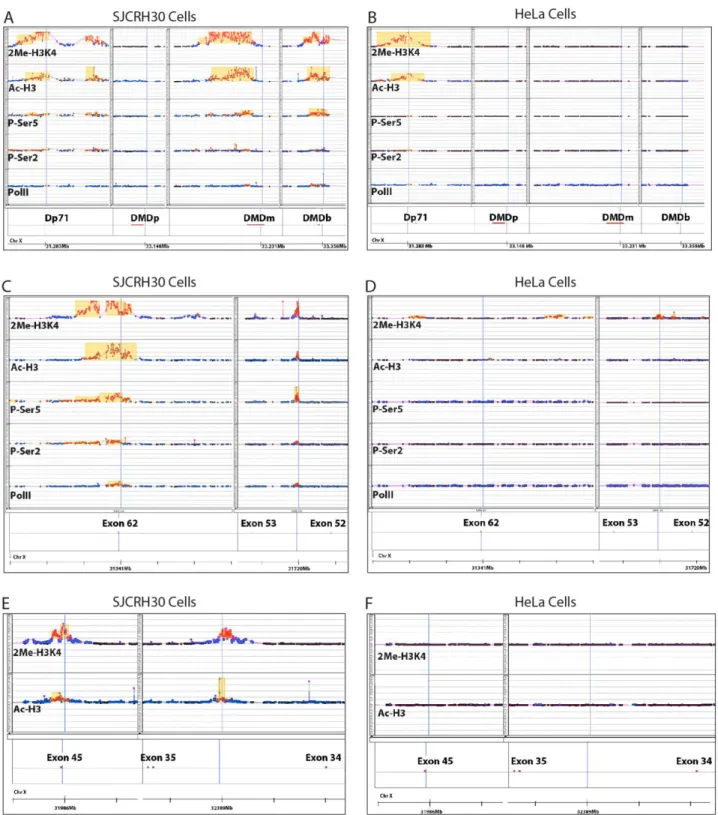
To understand the dynamics of how the RNA polymerase II (RNA-Pol II) transcribes the DMD locus we adopted a ChIP-chip approach. The RNA Pol II binding to DNA along its functional modifications in the Carboxyl-Terminal Domain (CTD) were correlated with histone marks such as Ac-H3, H3K4me2, which characterize the open chromatin of genes actively transcribed. As a cell system, we used SJCRH30, a human rhabdomyosarcoma cell line which derives from a male striated muscle tumor and maintains the several features of differentiated muscle cells, such as for instance expression of the muscle and brain dystrophin isoforms (Dp427b and Dp427m) [20] with levels comparable to that of GAPDH, an housekeeping metabolic gene whose expression is often used as a reference in mRNA quantitation assays (Fig. S1). As a negative control we used instead HeLa cells which, with the sole exception of the ubiquitous Dp71 mRNA, do not express any muscle/brain dystrophin transcripts (Fig. S1). The immune-precipitated DNA was, then, hybridized to a DMD locus specific custom-made chip array. ChIP on chip row data were statistically analysed as described in materials and methods. Results showed that RNA pol II was strongly associated with the promoter regions of Dp427b, Dp427m, and Dp71 isoforms in SJCRH30 cells, but, as expected, not with that of the Dp427p isoform, which is not expressed in this cell line (Fig. 1A and Fig. S2A). Consistently, RNA pol II was associated with the promoter of the Dp71 isoform in HeLa cells only (Fig. 1B and Fig. S2B). Furthermore, phospho-Ser2 and phospho-Ser5 of the RNA pol II CTD were enriched throughout the first exon of each isoform while the phospho-Ser2 mark increased at the distal regions downstream the transcription start site, to indicate that we could specifically detect both the initiating and elongating RNA pol II. As expected, the same regions bound by the RNA pol II were also characterized for strong presence of pan-H3ac and H3K4me2 histone modifications typical of the open chromatin of active promoters.
ACCEPTED MANUSCRIPT
Fig. 1. Distribution of RNA polymerase II and chromatin marks along the DMD locus. ChIP-on-chip analysis in SJCRH30 and HeLa cells with anti-PolII, anti-CTD-pSer2, anti-CTD-pSer5, anti-H3ac and Anti H3K4me2 on DMD locus. A-B) Graphical representation of ChIP-chip enrichments of promoter/first exon of Dp427b, Dp427m, Dp427p and Dp71 DMD isoforms aligned to their chromosomal position. C-D) Alignment of Intron 52 and Exon 62 of Dp427m to their chromosomal position. E-F) Graphical representation of ChIP-chip enrichment on Intron 34 and Exon 45 of Dp427m isoform. A more detailed definition of the chip probes that were significantly hybridized by the ChIP-DNA are described in Figure S2 (SJCRH30) and S3 (HeLa). Raw data were normalized by blank-subtraction and variance stabilization. Statistically significant enriched probes (red square) were identified by Whitehead Error Model. Whitehead neighbourhood model was used to detect peaks (yellow box).
ACCEPTED MANUSCRIPT
Aside from these observations, which were somehow expected, we also found additional four DNA regions inside the DMD locus that resulted positive for some of the markers analyzed. First, the RNA Pol II was strongly bound to two regions: one inside intron 52 (DMI52) and another one around exon 62 (DME62) (Fig. 1C and Fig. S2C). The fact that both regions were also marked for presence of RNA pol II p-Ser2, p-Ser5, H3ac, H3K4me2 suggested that these two regions might correspond to regulatory elements in proximity of putative transcription start sites. These two regions appear to function in muscle like cells only, for the markers were absent in HeLa cells (Fig.1D and Fig. S3A ). Furthermore, in SJCRH30, two additional DNA regions in intron 34 (DMI34) and in exon 45 (DME45) were also found for presence of pan-H3ac and H3K4me2 but not of the RNA Pol II (Fig. 1E and Fig. S3B), and again absent in HeLa cells (Fig 1F and supp. Fig 3C). This suggested that the latter two DNA regions may play some sort of muscle specific function which is independent from the RNA Pol II activity.
3.2 Function of DMI52 and DME62 regions
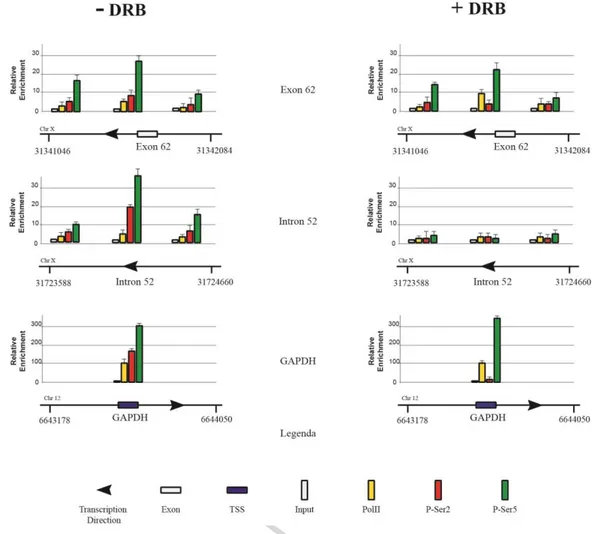
The fact that RNA pol II associates with DMI52 and DME62 suggested that these regions might correspond to either novel transcription start sites or pausing sites. To address this issue, we first validate ChIP on chip data by performing ChIP in SJCRH30 and analyzing the association and distribution of RNA pol II and related CTD modifications along the two DNA sites. Results in Fig. 2 (-DRB panel) show that, indeed these two regions were bound by RNA pol II. To discriminate whether the regions were involved in de novo transcription or pausing we performed ChIP on cells pretreated with 5,6-Dichlorobenzidazole 1-beta-D ribofuranoside (DRB), an RNA Polymerase II inhibitor, which prevents the polymerase to switching from the stalled to a processive conformation [21]. Indeed, following treatment, only the transcriptional start sites should be enriched by RNA Polymerase II, since a hypothetical pausing site would be depleted of a processive polymerase. As a corroborating control of that, the promoter region of the GAPDH gene that is actively and constitutively transcribed in these cells, was also analyzed.
ACCEPTED MANUSCRIPT
Fig. 2. DMI52 carries a genuine RNA pol II pausing site. Chromatin immunoprecipitation analysis of Exon 62 and Intron 52 of Dp427m was carried out before and after treatment with 100µM of 5,6-Dichlorobenzimidazole riboside (a RNA Polymerase II inhibitor) for 6h in SJCRH30 cells. Chromatin was immunoprecipitated using antibodies against PolII, CTD-pSer2 and CTD-pSer5. GAPDH first exon was used as a control. Error bars indicate S.E.
As shown in Fig. 2 (+ DRB panel), we observed depletion of RNA Pol II from the Intron 52. In order to rule out that the result depended on a reduced expression of Polymerase, as a consequence of the inhibitor treatment, we determined the RNA Pol II levels by Western blotting. Results show that the RNA pol II levels are not affected by DRB (Fig. S4), thereby confirming that this region may represent a genuine pausing site for the polymerase during the transcription of Dp427m or Dp427b mRNAs. In contrast, the RNA polymerase was still present on Exon 62. Particularly, the enrichment was observed for Pol II and CTD-P-Ser5-Pol II but not for CTD-P-Ser2-, indicating that the region may be associated with a novel transcription start site. Indeed, both bioinformatics assembly of annotated ESTs (Supp. Fig. 5) and RT-PCR (Supp. Fig. 6) revealed the existence of a novel mRNA, which starts from the inner region of exon 62 with the same orientation of the Dp427
ACCEPTED MANUSCRIPT
transcripts. Bioinformatics analyses suggest that this is a non-coding RNA since no ORFs of adequate size were predicted.
3.3 Bioinformatics analysis of the DMI52 region
The DMEI52 pausing site was analyzed for the presence of putative transcription factor binding sites (TFBS). LASAGNA webtool [22] scored 228 Vertebrate TRANSFAC matrices (Table S2) To sort for TFs expressed in human rhabdomyosarcoma SJCRH30 cell line [23] we merged the TFs with the RNA-seq gene expression data available in SJCRH30 cells (ENCODE project ENCSR568YRP). The search for transcription factors expressed in rhabdomyosarcoma SJCRH30 cell line gained a gained a list of 37 human TFs (Table S3).
GSEA (Gene Set Enrichment Analysis) analysis [23] on 37 expressed TFs scored 10 Reactome pathways containing transcription factors involved in myogenesis (as MYOD1, MEF2A, MYOG) and signaling proteins (ELK1, ATF2, JUN) (Table S4). This is consistent with the DMI52 function as pausing site in dystrophin gene, which is almost exclusively expressed in muscle (both striated and cardiac). Interestingly also circadian clock related proteins are represented in the Reactome pathways, reinforcing the link between muscle differentiation or regeneration and synchronization as already published. STRING analysis (http://string-db.org) [24-26] of network nodes involving the scored 37 human TFs identified experimentally determined interaction among the TFs supporting the bioinformatics analysis performed on DMI52 pausing site (Fig S7).
3.4 Function of DMI34 and DME45 regions.
Since in SJCRH30 cells, DMI34 and DME45 were strongly marked by H3K4me2, pan-acetylation and more precisely by acetylation of H3K27, a specific marker of enhancer elements (Fig. S8), we speculated that these regions might function as regulatory elements possibly with enhancer-like activities. To support this idea, the two DNA regions were separately cloned in both directions into a reporter vector downstream the luciferase reporter whose activity was driven by the upstream
ACCEPTED MANUSCRIPT
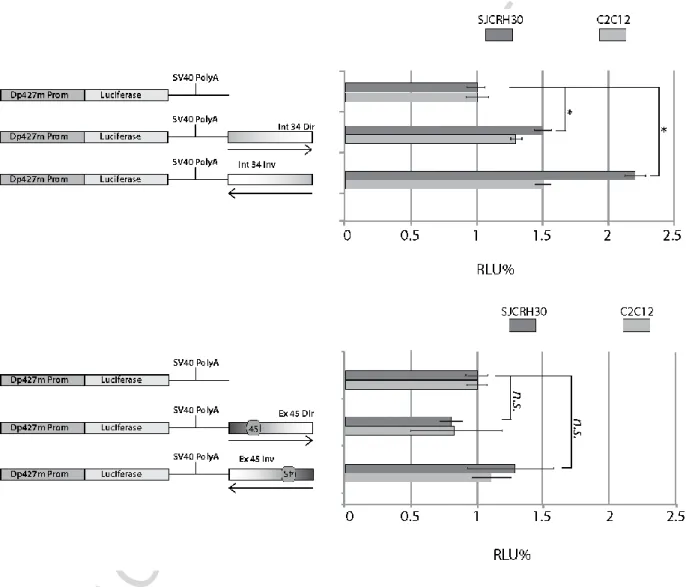
Dp427m promoter. Constructs were transiently transfected in SJCRH30 and murine C2C12 cells and luciferase activity was monitored at 24 hours from transfection. Results showed that DMI34 can stimulate the Dp427m promoter transcription when cloned in both directions and predominantly in the inverse one (Fig. 3A). In contrast, DME45 showed very low effect or at most had a negative impact on the transcription of the reporter particularly in the C2C12 cells (Fig. 3B).
Fig. 3. DMI34 displays an enhancer-like activity in a Luciferase reporter assay. Dp427m intron 34 and exon 45 were cloned into a reporter vector (luc-reporter) downstream the luciferase gene transcribed by Dp427m promoter. Constructs were tested in SJCRH30 and C2C12 cells 24h from transfection. A renilla reporter cotransfected with each Luc reporter was used to normalize luciferase activity. Results are the mean +/- SE of 3 independent transfections in triplicates. A t-student test was applied to determine statistically significant differences among tested conditions (* indicates p<0.05; n.s., non-significant)
Although the luciferase assay was informative, results could not take into account the chromosomal distances between the DMI34/DME45 regions and the Dp427m promoter; it is known that several transcriptional enhancers can work several tens or hundred thousands bps from their target sites
ACCEPTED MANUSCRIPT
[27]. To demonstrate in vivo physical association of the intron-34/exon-45 regions with the Dp427m promoter we applied a Chromosome Conformation Capture (3C) assay on SJCRH30 and HeLa cells. Schemes of the experimental design of the assay are described in Figs. 4A and 4D. Results show that DMI34 could generate a DNA PCR product specifically resulting from the natural juxtaposition of DMI34 with the Dp427m promoter (Fig. 4B). As expected no PCR product was observed in HeLa cells in which the Dp427m isoform is not expressed. (Fig. 4C). Furthermore, no PCR products were observed when DMI34 was tested for interaction with other in cis (chromosome Xq22 and Xp22) or in trans chromosomal domains (chromosome 21), supporting the view that DMI34 can specifically engage with the Dp427m promoter. Surprisingly, DME45 could not interact with Dp427m promoter (Figs. 4E and 4F).
ACCEPTED MANUSCRIPT
Fig. 4: DMI34 establishes physical contacts with the Dp427m promoter in vivo. Chromosome Conformation Capture (3C) was applied to detect physical interaction between Intron 34 and Dp427m promoter or Exon 45 and Dp427m Promoter. A) Experimental design of 3C between the dystrophin muscle promoter and Intron 34. XbaI restriction enzyme was used. 3C on Dp427m and intron 34 were carried out in SJCRH30 (B) and HeLa cells (C). D) Experimental design of 3C between the dystrophin muscle promoter and Exon 45. BglII restriction enzyme was used. 3C on Dp427m and Exon 45 was carried out in SJCRH30 (E) and HeLa cells (F). After ligation, DNA was purified and
ACCEPTED MANUSCRIPT
specific interactions were detected using specific Taqman probes. To estimate the frequency of random collision between digested fragments, two intra-chromosomal (ChX-p21 and ChX-q22) and one inter-chromosomal (Ch 21) interactions were analysed. As negative controls, not cross-linked cells were used. PCR products were then loaded on an agarose gel, each panel is representative of four independent experiments.
3.5 Consequences of intron 34 or exon 45 deletion in BMD patients.
To understand whether DMI34 and DME45 exert a critical role in the regulation of muscle dystrophin in patients affected by dystrophinopathies, we analyzed the amount of dystrophin protein and transcript in BMD. The dystrophin protein in these BMD patients is shorter, as consequence of in frame deletions and is therefore expressed in muscle preserving most of its normal functions [28]. Nine patients clinically diagnosed with BMD were selected and grouped according to deletions comprising exon 34/intron 34 (Model 34), exon 45 (Model 45), both exons 34/intron 34 and 45 (Model 34-45) or none of the two regions (control Becker group). We identified only one patient for Model 34-45, since these deletions are rare in BMD phenotype. All patients’ deletions were verified by microfluidic RealTime-PCR testing the exon-exon junctions of mature DMD mRNA. An example of that is shown in Fig. S9. Patients' phenotypes, and how they were grouped, are listed in Table 1.
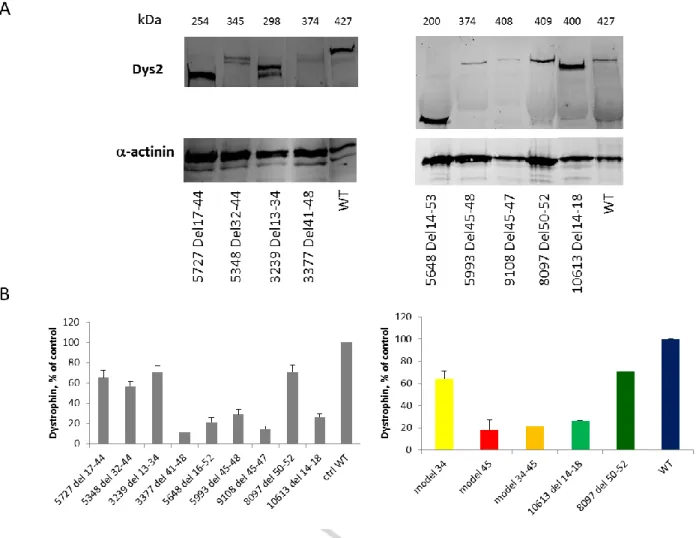
Next, dystrophin protein levels were assessed in all nine BMD patients and one healthy individual, used as a control by Western Blotting on Odyssey employing the Dys2 (last 17 C-terminal amino acids) antibody. Fragments of the dystrophin protein were detected in all patients at the expected molecular mass and consistently with the corresponding deletions (Fig. 5A). Semi-quantitative analysis in these patients revealed that Model 34 had a mean dystrophin expression of 64% (SD ± 7.1) of the control, while Model 45 and Model 34-45 patients had 18% (SD ± 9.3) and 21%, respectively. Protein levels in patients carrying deletions in other regions of the DMD gene were quite variable, ranging from 26% (deletion 14-18) to 71% (deletion 50-52) of control (Fig. 6B).
ACCEPTED MANUSCRIPT
Table 1: Description of deletions and patient features whose muscle samples were employed in this study.
Patient ID Deletion Age at last examination (years) Age at time of sample collection (years) Clinical Diagnosis Symptoms at last neurological evaluation Dilated cardiomyopathy Severity 1 5727 17-44 11 11 High creatine kinase asymptomatic no 2 5348 32-44 41 23 High creatine kinase 2 episodes of suspected myoglobinuria mild weakness shoulders girdle no Very mild 3 3239 13-34 6 6 Myopathy proximal muscle weakness no 4 3377 41-48 11 11 High creatine kinase ? no 5 5993 45-48 13 13 Myopathy ? no 6 9108 45-47 39 36 Dilated cardiomyopathy (FE24%) with ICD High creatine kinase Fatigue in running Mild weakness of hip girdle and
of lower limbs proximal muscles yes severe 7 5648 14-53 18 5 High creatine kinase Mild weakness of hip girdle, Achilles tendon retraction and scoliosis
yes (FE 48%) mild
8 8097 50-52 4 4 High creatine
kinase normal no asyptomatic
9 10613 14-18 (d.o.b. 29 01/1983) 28 High creatine kinase at 3 yrs; EMG: normal; Echocardiogram: normal: Under treatment with levetiracetam (epilepsy); Pain and stiffness
in the lower limbs; Family history of cardiomyopathy and BMD normal no asyptomatic
ACCEPTED MANUSCRIPT
Fig. 5. Western Blot analysis of dystrophin expression in patients with Becker Muscular Dystrophy. A) Western blot of total protein extracts from skeletal muscle biopsy of patients and control. Blots were probed with the Dys2 antibody for dystrophin and a sarcomeric alpha-actinin antibody as a loading control. B) Western blot semi-quantification using ImageJ software. Data were normalized to alpha-actinin and both individual and grouped patients were showed as per cent of control. Values for the grouped patients’ graph are expressed as means ± SD.
4 Discussion
4.1 A new DMD RNA pol II pausing site
In this study we have, for the first time, analyzed the dynamics by which the RNA pol II passes through the DMD locus in the context of specific histone marks. We identified a unique pausing site in intron 52 out of the 2,2 Mb encompassing the DMD locus, demonstrating that the RNA polymerase displays an extraordinary level of processivity in this huge locus, nevertheless recognizes the need to stop during its processivity. This is the first report of an internal pausing site in the dystrophin gene. Following transcription initiation, RNA pol II can enter into a paused or stalled status generally immediately downstream the transcription start site before starting a
ACCEPTED MANUSCRIPT
productive elongation. This is a widespread physiologically regulated phenomenon, though not completely understood, and RNA pol II reactivation occurs via a number of elongation complexes, [29].
RNA polymerase II pausing sites are indeed located just downstream of the promoter in a relevant proportion of human genes, and not in other regions. The DMI52 site is within an intron, positioned in the central part of the DMD gene. Although DMD has several promoters, DMI52 is not located in close proximity to any 3’ DMD promoter regions, since Dp114 is driven by a promoter in intron 44 with the ATG codon in exon 51, whereas Dp140 has promoter and unique first exon in intron 55. Regions annotated as RNA pol II pausing sites have some sequence characteristics as binding motifs for transcription factors, generally GC rich regions and presence of G4 (RNA G-quadruplexes) motifs, which are transcriptional and epigenetic regulatory targets of transcription factors. These last have been recently connected to human diseases as amyotrophic lateral sclerosis [30]. The RNA polymerase II pausing is tightly associated with pre-mRNA processing being both co-transcriptional processes [31]. Recently, a relevant role of RNA loops (R-loops) in facilitating RNA pol II pausing prior elongation has been pinpointed, and it is mediated by intense antisense transcription over the pausing elements [31]. The functional meaning of this DMD intron 52 pausing site is unknown, especially considering its unusual location. It might have a role in controlling the efficiency of transcription initiation and also in regulating alternative splicing. The DMD locus is alternatively spliced, and many lncRNAs are actively transcribed, especially around the region of the intron52 pausing site (from intron 45 to intro 55) [13]. Indeed, we describe here an additional new lncRNA within intron 62. We can hypothesize that this might be a crucial region for the dystrophin transcriptional dynamics regulation, requiring a pausing site and then restarting elongation downstream. Since R-loops also promote chromatin architecture shaping, which controls termination region, this region might also be implicated in gene transcription termination and polyadenylation regulation [32, 33]. Very recently ultra-deep transcript sequencing analyses have shown that dystrophin pre-mRNA undergoes multi-step non-sequential splicing thus suggesting a
ACCEPTED MANUSCRIPT
highly regulated process in which control of RNA pol II processivity may be critical [34]. These authors described in deep detail the intron removal dynamic of the DMD gene identifying non-consecutive intron removal and exon blocks, as result of 3 or more joined exons flanked by unspliced introns. Interestingly, the two blocks containing exons 50-52 and 53-57 are spliced non sequentially, with a recursive splicing occurring within intron 52. This may reinforce the regulatory role this intron 52 exerts in transcription dynamics.
4.2 A novel lncRNA.
The ChIP-on chip analyses also revealed the presence of a new promoter nearby exon 62 which drives trasncription of a lnc-RNA (lncRNA62int) expressed in rhabdomyosarcoma cells. We did not pick up lncRNA62int in our previous study [13], but it is possible that this new lncRNA might be more represented in rhabdomyosarcoma than in normal skeletal muscle, and therefore it can have escaped our previous analysis. Indeed, an alternatively spliced isoform of this lncRNA has been also annotated in a published chondrosarcoma RNA library suggesting that this type of lncRNA may be typically expressed in tumour tissues/cells. Again, this new lncRNA62int underlines the intense transcriptional activity, which occurs in this region of the DMD gene.
4.2 Intron 34 dystrophin enhancer (DMI34)
Our epigenetic analysis has identified two putative transcriptional cis-DNA elements that may contribute to the regulation of the DMD locus. More specifically, we have mapped two DNA sequences involved in the architectural organization of the locus. Intron 34 can establish a physical contact with the muscle specific promoter most likely through formation of a large loop resulting from bridging two regions that are about 800 Kbs apart as suggested by chromosome conformation capture data. The analyses of this region in the context of a Luciferase assay suggest that it can stimulate the expression of the Dp427m mRNA isoform. The fact that such transcriptional stimulation is driven by the sequence in both orientations and that it is marked by strong acetylation
ACCEPTED MANUSCRIPT
of H3K27 favors the idea that indeed the intron 34 region can function as a distal transcriptional enhancer. This finding is also supported by the observation that transcript levels of the DMD gene are lower in BMD patients carrying genomic deletions encompassing the intron 34 (Model 34). Conversely, in vitro assays did not support a transcriptional regulatory role for DME45. BMD patients deleted in this region have lower levels of dystrophin protein as compared to muscle samples with deletion of exon 34. Of course, this variability could be due to the different extent of the deletion in these two groups (many other exons are indeed missing). Therefore, we cannot conclude about the possible function DME45 has, and further studies are required to elucidate its eventual role.
Our results highlight a profound complexity in the DMD gene epigenetic structure and unveil new transcriptional dynamics. We showed for the first time a genuine RNA pol II pausing site, interestingly not located adjacent to the promoter region.
We identified the new DME34 enhancer, which is interesting also for therapeutic implications. Indeed, modulation of the DME34 may enhance DMD transcript production with beneficial effect in terms of protein amount production thereby also possible applicable to BMD patients, currently orphan of any specific treatment [7].
In conclusion, our findings have started to provide a global picture on how the entire DMD locus is epigenetically assembled and dynamically transcribed by the RNA pol II.
These findings are important for elucidating the basic mechanisms, the DMD gene follows when physiologically expressed, and may contribute to a better understanding of disease severity pathogenesis in both BMD and DMD patients.
ACCEPTED MANUSCRIPT
5. Acknowledgments
This study was supported by the FP7 EU BIO-NMD project n. 241665 (AF), by the Emilia Romagna Region RARER project (AF and AR), and by the University of Bologna (RFO2011-2013 to GP). The Biobank of the C. Besta Neurological Institute, member of EuroBioBank and Telethon Network of Genetic Biobanks (GTB12001F to MM) is gratefully acknowledged for providing biological samples.
The funders had no role in study design, data collection and analysis, decision to publish, or preparation of the manuscript.
ACCEPTED MANUSCRIPT
6. References
1. Muntoni F, Torelli S, Ferlini A. Dystrophin and mutations: one gene, several proteins, multiple phenotypes. Lancet Neurol. 2003;2(12):731-40.
2. Ferlini A, Neri M, Gualandi F. The medical genetics of dystrophinopathies: molecular genetic diagnosis and its impact on clinical practice. Neuromuscul Disord. 2013;23(1):4-14.
3. Pozzoli U, Elgar G, Cagliani R, Riva L, Comi GP, Bresolin N, et al. Comparative analysis of vertebrate dystrophin loci indicate intron gigantism as a common feature. Genome Res. 2003;13(5):764-72.
4. Arechavala-Gomeza V, Anthony K, Morgan J, Muntoni F. Antisense oligonucleotide-mediated exon skipping for Duchenne muscular dystrophy: progress and challenges. Curr Gene Ther. 2012;12(3):152-60.
5. Bushby K, Finkel R, Wong B, Barohn R, Campbell C, Comi GP, Connolly AM, Day JW, Flanigan KM, Goemans N, Jones KJ, Mercuri E, Quinlivan R, Renfroe JB, Russman B, Ryan MM, Tulinius M, Voit T, Moore SA, Lee Sweeney H, Abresch RT, Coleman KL, Eagle M, Florence J, Gappmaier E, Glanzman AM, Henricson E, Barth J, Elfring GL, Reha A, Spiegel RJ, O'donnell MW, Peltz SW, Mcdonald CM; PTC124-GD-007-DMD STUDY GROUP. Ataluren treatment of patients with nonsense mutation dystrophinopathy. Muscle Nerve. 2014 Oct;50(4):477-87
6. Tennyson CN, Klamut HJ, Worton RG. The human dystrophin gene requires 16 hours to be transcribed and is cotranscriptionally spliced. Nat Genet. 1995;9(2):184-90.
7. Bastianutto C, Bestard JA, Lahnakoski K, Broere D, De Visser M, Zaccolo M, et al. Dystrophin muscle enhancer 1 is implicated in the activation of non-muscle isoforms in the skeletal muscle of patients with X-linked dilated cardiomyopathy. Hum Mol Genet. 2001;10(23):2627-35. 8. Klamut HJ, Bosnoyan-Collins LO, Worton RG, Ray PN, Davis HL. Identification of a transcriptional enhancer within muscle intron 1 of the human dystrophin gene. Hum Mol Genet. 1996;5(10):1599-606.
ACCEPTED MANUSCRIPT
9. De Repentigny Y, Marshall P, Worton RG, Kothary R. The mouse dystrophin muscle enhancer-1 imparts skeletal muscle, but not cardiac muscle, expression onto the dystrophin Purkinje promoter in transgenic mice. Hum Mol Genet. 2004;13(22):2853-62.
10. Klamut HJ, Bosnoyan-Collins LO, Worton RG, Ray PN. A muscle-specific enhancer within intron 1 of the human dystrophin gene is functionally dependent on single 1/E box and MEF-2/AT-rich sequence motifs. Nucleic Acids Res. 1997;25(8):1618-25.
11. Marshall P, Chartrand N, Worton RG. The mouse dystrophin enhancer is regulated by MyoD, E-box-binding factors, and by the serum response factor. J Biol Chem. 2001;276(23):20719-26.
12. Cacchiarelli D, Legnini I, Martone J, Cazzella V, D'Amico A, Bertini E, et al. miRNAs as serum biomarkers for Duchenne muscular dystrophy. EMBO Mol Med. 2011;3(5):258-65.
13. Bovolenta M, Erriquez D, Valli E, Brioschi S, Scotton C, Neri M, et al. The DMD locus harbours multiple long non-coding RNAs which orchestrate and control transcription of muscle dystrophin mRNA isoforms. PLoS One. 2012;7(9):e45328.
14. Gazzoli I, Pulyakhina I, Verwey NE, Ariyurek Y, Laros JF, 't Hoen PA, Aartsma-Rus A. Non-sequential and multi-step splicing of the dystrophin transcript. RNA Biol. 2016;13(3):290-305. 15. Alexander RD, Innocente SA, Barrass JD, Beggs JD. Splicing-dependent RNA polymerase pausing in yeast. Mol Cell. 2010;40(4):582-93.
16. Weinmann AS, Farnham PJ. Identification of unknown target genes of human transcription factors using chromatin immunoprecipitation. Methods. 2002;26(1):37-47
17. Iraci N, Diolaiti D, Papa A, Porro A, Valli E, Gherardi S, et al. A SP1/MIZ1/MYCN repression complex recruits HDAC1 at the TRKA and p75NTR promoters and affects neuroblastoma malignancy by inhibiting the cell response to NGF. Cancer Res. 2011;71(2):404-12.
ACCEPTED MANUSCRIPT
18. Anthony K, Arechavala-Gomeza V, Ricotti V, Torelli S, Feng L, Janghra N, et al. Biochemical characterization of patients with in-frame or out-of-frame DMD deletions pertinent to exon 44 or 45 skipping. JAMA Neurol. 2014;71(1):32-40.
19. Bovolenta M, Scotton C, Falzarano MS, Gualandi F, Ferlini A. Rapid, comprehensive analysis of the dystrophin transcript by a custom micro-fluidic exome array. Hum Mutat. 2012;33(3):572-81.
20. Hinson AR, Jones R, Crose LE, Belyea BC, Barr FG, Linardic CM. Human rhabdomyosarcoma cell lines for rhabdomyosarcoma research: utility and pitfalls. Front Oncol. 2013, 3:183
21. Hensold JO, Barth D, Stratton CA. RNA polymerase II inhibitor, 5,6-dichloro-1-beta-D-ribofuranosylbenzimidazole (DRB) causes erythroleukemic differentiation and transcriptional activation of erythroid genes. J Cell Physiol. 1996;168(1):105-13.
22. Chih Lee and Chun-Hsi Huang. LASAGNA-Search 2.0: integrated transcription factor binding site search and visualization in a browser. BIOINFORMATICS Vol. 30 no. 13 2014, pages 1923–1925.
23. Subramanian A, Tamayo P, Mootha VK, Mukherjee S, Ebert BL, Gillette MA, Paulovich A, Pomeroy SL, Golub TR, Lander ES, Mesirov JP. Gene set enrichment analysis: a knowledge-based approach for interpreting genome-wide expression profiles.
Proc Natl Acad Sci U S A. 2005 Oct 25;102(43):15545-50.
24. Orlando B, Bragazzi N, Nicolini C. Bioinformatics and systems biology analysis of genes network involved in OLP (Oral Lichen Planus) pathogenesis. Arch Oral Biol. 2013;58:664–73 25. Agapov A1,2, Olina A1,3, Esyunina D1, Kulbachinskiy A1,2. Ribosomal protein S4 is a
transcription factor with properties remarkably similar to NusA, aprotein involved in both non-ribosomal and non-ribosomal RNA antitermination Gfh factors and NusA cooperate to stimulate transcriptional pausing and termination. FEBS Lett. 2017 Feb 25. doi: 10.1002/1873-3468.12609
ACCEPTED MANUSCRIPT
26. Martha Torres, Ciarán Condon, Joan-Miquel Balada, Craig Squires, Catherine L. Squires. Ribosomal protein S4 is a transcription factor with properties remarkably similar to NusA, a protein involved in both non-ribosomal and ribosomal RNA antitermination. EMBO J. 2001 Jul 16; 20(14): 3811–3820. doi: 10.1093/emboj/20.14.3811
27. Shlyueva D, Stampfel G, Stark A. Transcriptional enhancers: from properties to genome-wide predictions. Nat Rev Genet. 2014;15(4):272-86.
28. Anthony K, Cirak S, Torelli S, Tasca G, Feng L, Arechavala-Gomeza V, et al. Dystrophin quantification and clinical correlations in Becker muscular dystrophy: implications for clinical trials. Brain. 2011;134(Pt 12):3547-59.
29. Mayer A, Landry HM, Churchman LS. Pause & go: from the discovery of RNA polymerase pausing to its functional implications. Curr Opin Cell Biol. 2017 Mar 28;46:72-80). 30. Maizels N. G4-associated human diseases. EMBO Rep. 2015 Aug;16(8):910-22.
31. Skourti-Stathaki K, Kamieniarz-Gdula K, Proudfoot NJ. R-loops induce repressive chromatin marks over mammalian gene terminators.
Nature. 2014 Dec 18;516(7531)
32. Glover-Cutter K, Kim S, Espinosa J, Bentley DL. RNA polymerase II pauses and associates with pre-mRNA processing factors at both ends of genes.
Nat Struct Mol Biol. 2008 Jan;15(1):71-8
33. Danko CG, Hah N, Luo X, Martins AL, Core L, Lis JT, Siepel A, Kraus WL. Signaling pathways differentially affect RNA polymerase II initiation, pausing, and elongation rate in cells. Mol Cell. 2013 Apr 25;50(2):212-22
34. Gazzoli I, Pulyakhina I, Verwey NE, Ariyurek Y, Laros JF, 't Hoen PA, Aartsma-Rus A. Non-sequential and multi-step splicing of the dystrophin transcript. RNA Biol. 2016;13(3):290-305.