Alessandro Carbonari
He works as an Assistant Professor in the Department of Civil, Building Engineering and Architecture (DICEA) at the Università Politecnica delle Marche (Ancona, Italy). Since 2012 is a member of the Board of Directors of IAARC (International Association for Automation and Robotics in Construction).
Advanced technologies for supporting health and safety in
construc-tion management
Tecnologie innovative a supporto della gestione della sicurezza nei
cantieri
Decisions made during project planning strongly infl uence the level of safety which can be reached on site. However, some hazards are generated by the concurrence of several unpredictable risk factors. So the use of tracking systems might become decisive.
In this paper we will present three example of advanced monitoring systems: one proactive safety management system to prevent overhead hazards; one infrastructureless real-time monitoring system to avoid hazardous interferences among the several teams operating on site; one real-time control system of fi ne particle concentration in construction sites. They all take advantage of the use of advanced technologies and implement some intelligent logics to evaluate the corresponding hazard level. ICT based technologies are shown to positively infl uence health and safety in construction site.
Il conseguimento di elevati livelli di sicurezza in cantiere è infl uenzato dalle decisioni assunte in fase di programmazione. Permangono tuttavia i pericoli generati dalla concomitanza di fattori impredicibili, che possono essere mitigati dall’adozione di sistemi di monitoraggio automatico.
Questo contributo presenterà tre sistemi: un sistema proattivo adatto a prevenire rischi di caduta di materiali dall’alto; un sistema di monitoraggio in tempo reale a bassa infrastrutturazione per segnalare interferenze pericolose tra le squadre; un sistema di controllo in tempo reale della concentrazione di particolato fi ne. Tutti questi sistemi adottano tecnologie avanzate e implementano logiche per valutare il livello di rischio contingente. Si mostra perciò come l’impiego di tecnologie ICT può supportare la gestione della sicurezza.
Keywords: health and safety; construction sites; real-time monitoring; pervasive systems
He works as a Full Professor in the Department of Civil, Building Engineering and Architecture (DICEA) at the Università Politecnica delle Marche (Ancona, Italy). His expertise range from management of construction sites to automation in construction. He is co-founder of several spin-off companies.
1. INTRODUCTION
Accidents on construction sites are a scourge throughout the world [1]. The European construction sector has registered that falls from heights cause the highest number of fatalities, accounting for 52% of all accidents. Second on the list is the number of fatal accidents due to objects falling from overhead accounting for 36% of all accidents occurring on construction sites [2].
Clauses included in safety plans and traditional health and safety practices like rewards, training or feedback communication have been shown to be only partially effective for construction sites, as these are non-structured working places and each site has its own peculiarities. For that reason, accident occurrences can hardly ever be predicted at the design stage. Furthermore, coordinators for health and safety matters cannot always and ubiquitously oversee ongoing construction works. Consequently, in many cases the practical application of the regulations in a site’s safety plan is left up to the workers, which often results in an insuffi cient application of mitigation measures.
Therefore, some research has been focused on the development of intelligent control systems, adopting advanced communication technologies and intelligent algorithms as the means for developing new automated control systems. These are expected to be capable of providing real-time support for H&S tasks in various circumstances.
Also, past research has shown that predicting potential risk situations calls for real-time intelligent site monitoring and the ability to react when the level of risk increases. This approach requires not only the collection of large amounts of data recorded by a monitoring system, but also the development of intelligent models for interpreting and forecasting the expected behaviors of workforce [3], the use of advanced communication equipment, vast sensor deployment and considerably high computational resources.
From the safety perspective, one of the benefi ts from smart work places is that they could act in a preemptive way against accident risks, which usually become more likely when work is at an advanced stage, because of the increasing amount of interaction between resources, such as the greater number of pieces of equipment used concurrently. In this context automated controls, such as collision avoidance, would play a critical role [4,5].
Hence, this paper will show three technologies for advanced semi-automated safety management, which rely on the approach mentioned above.
The fi rst case study refers to the development of a prototype for proactive safety management and real-time signaling of potential overhead hazards based on an ultra wide band (UWB) tracking technology.
The second example is relative to an automatic control of fi ne particle emissions from demolition and construction activities, which are recognised as signifi cant causes of pollution and health problems [6]. They are known as PM10, and can cause health hazards both to workers on the site and to people living and working outside the site boundary in the local neighbourhood. For this reason national legislation and regulations specify both admissible concentration values in the outdoor environment (i.e. concerning any person) and admissible concentration values in workplaces (i.e. concerning only the workers involved). The National Ambient Air Quality Standards (NAAQS) specify dust admissible in the outdoor air as a twenty-four hour average PM10.
Such legislation is also present in other countries: e.g. ambient air quality in Italy is ruled by Legislative Decree no. 52/2006 and is based on similar prescriptions. On the other hand, regulations relating to occupational exposure defi ne limit values in terms of an 8 hr Time Weighted Average (TWA) of total inhalable dust, whose thresholds differ slightly depending on the country.
In the construction fi eld, PM10 is originated by several concurrent factors, determined on the one hand by the site layout and organisation and, on the other, by the type of demolition or construction activities in progress. A number of fabrication processes are major sources of airborne particles, among which we cite operations such as cutting, grinding, sand-blasting, drilling and disk cutting.
Recommended control measures are those which reduce dust generated at its source [6]. Pre-project risk assessment is able to identify risks and mitigation actions, but cannot quantify their real effectiveness, which is strongly dependent on operational approaches, unless monitoring techniques are used. So in this paper the feasibility of a measurement system for pervasive and continuous monitoring of PM10 in construction sites will be shown, through the development and testing of a fi rst prototype. By means of an advanced and non-invasive wireless sensor network the system is able to provide pervasive and continuous monitoring of the presence of dust on site. Thus, once cheap, easy to deploy and pervasive sensor networks are available, they should determine several benefi ts, such as:
- triggering of warnings, when dust values exceed pre-determined thresholds;
- reduction in the number of environmental offences and hence in prosecutions by local authorities; - reduction in the site engineer’s workload;
- reduction in the health damage to the workers.
Finally, and as a third case study, a system that can be employed for real-time alerting when unauthorized interference occurs will be shown.
In fact, the real work schedule in the execution phase often undergoes consistent deviations from the plan. Updated releases of the H&S plan, which are edited as the work progresses, collect evidence during regular inspections, but they are implemented with a certain time lag and are therefore not in line with the fast evolving context on construction sites. This means that the H&S plan is not promptly updated according to the real work progress and to the new risks that could reasonably arise, thereby outdating all the practices and safety policies initially discerned.
Such a process will be manageable through human intervention only if several inspectors are continuously present on the site. As this is not economically convenient, in practice the adoption of automated communication and localization technologies seems to be the only way to tackle the problem. With the term “unauthorized interference” we mean such a situation where two or more teams share the same working area (e.g. they walk through the same paths or share some equipment), but it is not compliant with the schedule programmed in the H&S plan.
2.STATE OF THE ART
Tracking technologies, once interfaced with software modules implementing algorithms for risk identifi cation and alert, constitute the core of proactive safety systems for construction sites, as they allow the real-time monitoring of the position of workers and assets [7]. To date, several tracking technologies have been tested, and among the most promising candidates we cite Radio Frequency Identifi cation Device (RFId), Global Positioning System (GPS), Wireless Local Area Networks (WLAN), Ultra-Wide Band (UWB) and Indoor GPS, for their ability to cover a wide range of accuracy values and yard areas [8, 9]. Fieldwork tracking based on UWB has also been tested in a steel bearing structure, demonstrating position accuracy signifi cantly better than 1 m indoors and the ability to locate accurately when deployed across the site where the steel structure was being erected [10]. In particular, the performance of an UltraWide-Band (UWB) tracking system has been measured both in static and dynamic operations [11,12]. Its adoption has been successfully tested in real construction settings, demonstrating the benefi ts of applying location tracking in order to provide better documentation, analysis, understanding, and correction of best safety practices, as executed in the fi eld [13, 14]. In the two cited cases, it is claimed that computing the distance between two dynamic construction resources (worker and crane hook) prevented the too-close proximity of resources.
Besides mere resource tracking, monitoring systems may be integrated with intelligent algorithms for the purpose of identifying the contextual information [15]. This has been shown to be critical in several fi elds, such as project data retrieval during quality inspections and for work progress
estimations within the execution phase management.
A great deal of attention has also been paid to fall hazards: on one hand a mobile sensing device (i.e. transmitter sets and repeaters for sending information to a receiver) which is able to detect any worker approaching fl oor openings has been proposed [16]; on the other hand, an automated procedure that identifi es dangerous activities in the project schedule at the design stage has been set up.
Thanks to past research, two pre-conditions have been recognized as critical for the success of ICT applied to safety: tracking systems must be low-intrusive and they must also be able to gather information in real-time, overcoming the limitations connected with manual information retrieval and handling, which is a potential cause of delays and errors. For that reason a UWB wireless and untethered network system for mobile asset tracking on a dynamic construction site was tested [17, 18]. Its untethered nature favored the easy relocation of sensor nodes, which is frequently needed as the work progresses. A great effort in this direction comes from the ZigBee alliance, too [19]: ZigBee is built using the Institute of Electrical and Electronic Engineers (IEEE) 802.15.4 standard and follows strict IEEE guidelines to ensure long-term sustainability and reliable operation. ZigBee allows a general-purpose, cheap, self-organizing mesh network to be built for low bandwidth applications. The research presented in this paper is aimed at analyzing fi rstly the feasibility of automating safety control logics for overhead hazards, secondly the feasibility of non invasive intelligent systems for dust tracking and avoiding unauthorized interferences.
3.PROACTIVE SYSTEM FOR OVERHEAD HAZARDS SIGNALING
The proposed system aims at implementing a safety policy which triggers warning alerts in order to prevent workers from standing in hazardous positions or from accessing areas where there is a high likelihood of objects falling from overhead. The safety policy was implemented to act as a virtual fencing technology, which was interfaced with a real-time localization system and aimed at alerting resources approaching and/or accessing danger zones. Such a risk mitigation policy meant preventing workers from accessing predefi ned danger areas.
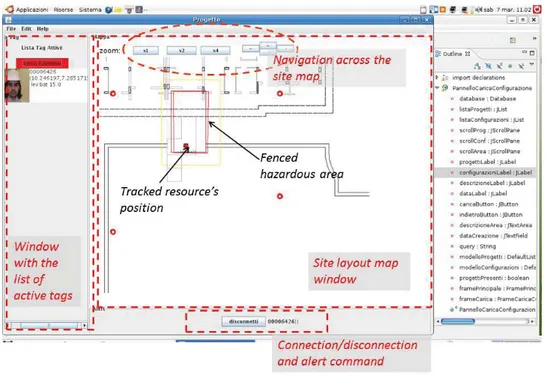
This prototype’s software was developed in Java™ Development Environment. The lowest layer of that architecture implements sensor, localization, communication and basic data management logics. The middle layer implements task oriented functionalities, such as virtual fencing logic or computational geometry. The highest application layer implements the graphical user interface (Fig. 1), that allows input of the list of resources and the site layout plan, selection of the fenced areas on the site layout, real-time visualization of the tracked resources in the monitoring window, signaling of upcoming potential hazards to the site manager or any other dedicated client station, and eventually to the workers involved.
According to the control algorithm proposed in Fig. 2-a, once a tracked object enters the warning strip, its trajectory starts to be monitored in order to establish whether it is approaching the edge of the danger area, or leaving the warning strip or moving inside the area. The algorithm fi rst checks whether an operator has already entered the hazardous area: if so, a red alarm is sent; otherwise none is sent and, subsequently, the algorithm checks whether the operator has entered the surrounding boundary zone. If this is true, then a second real position is retrieved and compared with the previous one (recorded in the previous time step) and a warning alarm is sent if, in the second iteration, the worker has further approached the border line. Otherwise, the entire procedure is repeated. Once a worker has been warned he is marked as alerted and no further warning messages are sent unless he leaves the warning zone and then enters it again. This avoids multiple alerts being sent to workers.
Point in polygon testing is at the core of the proposed algorithm. Among the computational geometry algorithms available, we chose to implement the Jordan Curve Theorem for 2D polygons because
of its reliability and effi ciency [20] (Fig. 2-b).
UWB was chosen as the position tracking technology [21]. The UWB system used in this study consisted in four “mid-gain” type receivers, one central processing hub, one reference tag and several 0.3 or 1W active tags for asset tracking, working at 1 Hz, all manufactured by Multispectral™ Inc. . Monitoring a 500 m2 outdoor construction area was made possible using just four receivers and equipping the tracked resource with a 1W tag.
Fig. 1 Software’s graphic user interface.
Fig. 2. Overall algorithm logic (a) and Jordan Curve Theorem representation (b). The Jordan Curve method works by casting a ray from the point to be tested following a random direction and therefore intersecting the solid several times (or none). The result of the test depends on the intersections count: a point is inside a 2D closed polygon if and only if the number of crossings from the ray emanating from the point in an arbitrary direction and the edges of the polygon is odd.
The whole system was fi nally tested on a real construction site near Ancona (Italy), relative to a reinforced concrete frame building (Fig. 3-a). Fig. 3-b shows a close-up view of the position of the hazardous area beneath the platform for loading and unloading material on the fi rst level of the building scaffolding, and the four receivers installed. The danger area was set in the GUI interface as a rectangular shaped zone, 1.5 m wider than the platform footprint on the ground fl oor, according to Italian safety legislation and safe work practices; subsequently the automatic control was intended to be performed only during loading and unloading operations.
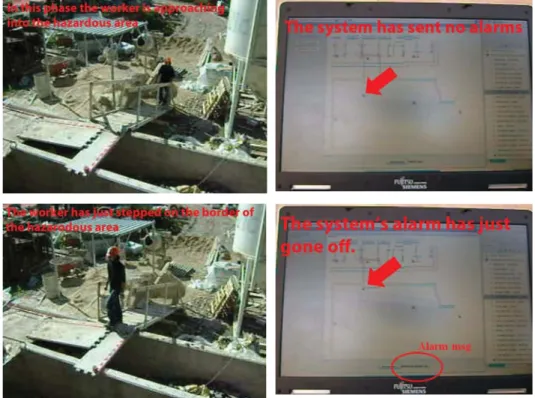
Snapshots in Fig. 4-a and Fig. 4-b show the worker approaching the area and the position tracked by the system; the photo in Fig. 4-c is referred to the precise time step when the alarm signal was sent, which corresponds to the time moment immediately before the worker enters the hazardous area (Fig. 4-d). The signals also arrived in advance as expected, for all the trials performed.
Fig. 3. View of the construction site with one of the receivers (a); close-up view of the platform with localization of the hazardous area (b).
Fig. 4. Time frames referring to the time moment when the worker approaches the hazardous area (a) with the corre-sponding GUI monitoring (b) and when the system sent an alert (d), given that the worker is about to enter the area (c).
4.CONTROL OF PM10 CONCENTRATION
This system is made up of a communication sub-system and end-devices for dust concentration’s measurement.
The wireless communication network is based on the SmartNetwork Platform, an ultra-low power wireless technology (manufactured by Smart Space Solutions srl). It is capable of tracking large areas with a wireless mesh network architecture, made up of battery operated devices. The SmartNetwork includes three levels of devices: one or more coordinators, routers and end devices or sensors [22]. A nephelometer sensor, whose features are listed in Table 1, manufactured by Sharp Inc. was embedded in the end devices (sensor code: GP2Y1010AU0F).
This sensor works based on the optical principle, and it does not affect the power consumption of the whole device, because the maximum current request does not exceed 20mA. Technically, a light beam is emitted into a measurement chamber; when dust is present, the light is refracted by the particles and the amount of scattered light is detected [23]. The new system was calibrated against the measurements of a highly accurate sensor, which was used as a benchmark. A dust ventilation duct was set up in order to place the sensors and control the physical variables during testing (Fig. 5). The duct was made of a 10m long by 0.7 m wide by 0.7 m high insulated aluminium coated casing (AC), connected to a vertical substructure (VS) with a grid (at the intersection between the two) for homogenising the inlet generation.
Sea salt dust generation (DG) was provided by means of an ultrasonic fog generator placed at the inlet of the dust ventilation duct.
Generation was protected by an envelope (EV) to avoid ambient disturbances. A fi lter (FL) along the duct guaranteed diffusion of the generated dust. The dust sensors (DS) were placed downstream inside the duct and the coordinator (not shown in Fig. 5) inside the laboratory was connected to a laptop. In between, two routers (RO) transferred the acquired data. Three active techniques were used for comparison. The fi rst involved one IOM inhalable dust sampler (IS) suctioning a 2 l/min constant volume fl ow through a small pipe whose loose end was placed close to the dust sensors. The second used an optical particle counter Grimm 1.108, which is a portable laser photometer (LP) with a constant volume fl ow of 0.6 l/min and a digital display for real-time measurement. Finally, a removable 47 mm PTFE fi lter was incorporated inside the instrument in order to collect all the measured dust, so that, at any later time, an appropriate density verifi cation/correction would be possible. The air fl ow rate inside the dust ventilation duct was generated by the rotating fan (RF) and its amount estimated by means of an anemometer type “Testo-Model445” (AT), equipped with a hot bulb NTC probe whose range is from 0 to 5 m/s and whose accuracy is 0.01 m/s.
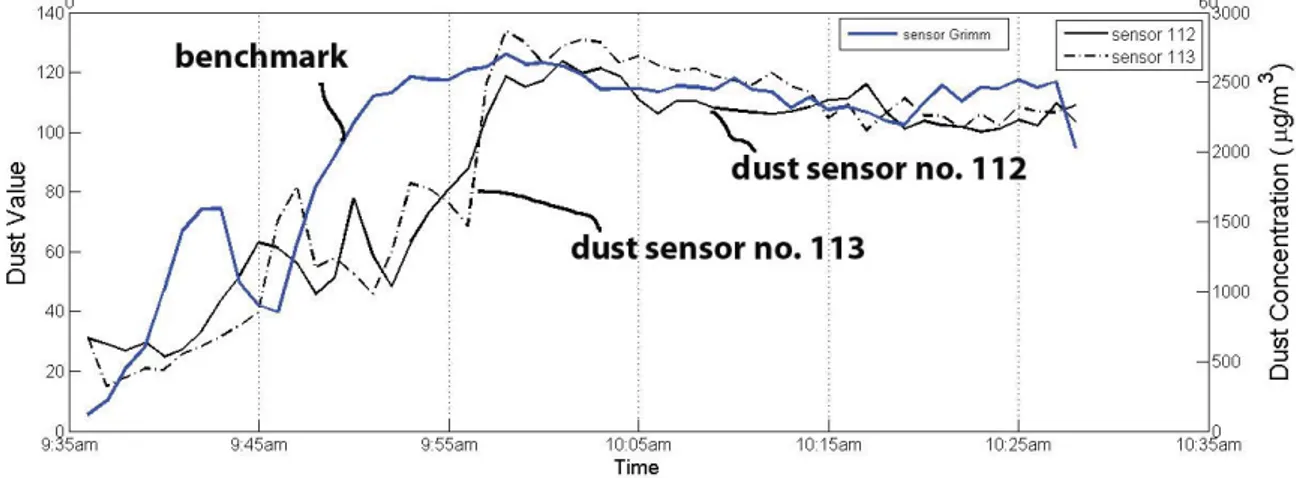
Calibration lasted 53 minutes, and during that time fi ne particle dust, whose diameter ranged between 0.23 and 10 μm, was generated. The air speed was kept constant at 0.45 m/s. The benchmark recorded one measurement every minute, while the two passive samplers recorded one measurement every 10 s according to eqs. (1) and (2). Subsequently, post-processing worked out the average values per minute, in order to be able to compare the two datasets, as in Fig. 6.
This fi gure shows a good agreement between the two passive samplers and the benchmark (i.e. Grimm). The average dust concentration experienced during this trial (worked out by IOM) was 2.077∙103 μg/m3, although the increasing trend at the beginning was determined by the time needed for the generated dust to spread across the dust ventilation duct.
Firstly and from the qualitative point of view, the plots of all the passive sensors always match that of the benchmark, if they are placed side by side. Moreover, the two passive sensors appear to be very reliable, as they behaved in a consistent way.
Fig. 5. Location of the measuring instruments and other devices in the ventilation duct.
Fig. 6. Plots of the dust concentration measured by the benchmark and the values estimated by the non- invasive passive sensors.
This means that the passive sensors are well capable of signalling when the PM10 is above the recommended threshold in workplaces, which is always in the order of a few mg/m3. The two series of conversion factors computed after the three trials are shown in Table 2.
5. REAL-TIME INTERFERENCE CONTROL
This system consists of a real-time tracking module to be deployed on site and of a control tool for automated alerting of interference risks.
The software module has been organized with an input section, where the inspector is able to list authorized interferences, according to the H&S plan and to the work schedule. Once these data have been provided, the system automatically monitors and checks whether any unauthorized interference takes place, signaling it in real-time. The software tool also acts as a repository for storing all the information collected during monitoring and can be used by inspectors to review and check deviations from plans, thereby allowing for prompt action.
We conceive the hardware/software platform to be installed on construction sites as a comprehensive system made up of a low level and non-intrusive monitoring system deployed on fi eld, communicating via Radio Frequency (RF) with the main Service Application (running on the local server), where high level control logics are implemented and made available within the internet. A software interface for end users (running on the client machine) is provided to supervise and manage the system anywhere in the world.
For the purpose of our experimental campaign, a prototype of a wireless communication sensor network, which is the property of the Italian company Smart Space Solutions srl, was tested. It exploits hardware and software components based on the IEEE 802.15.4 standard medium access and ZigBee stack communication protocol. It offers two important benefi ts: fi rstly its sensors are battery operated and small, and are therefore easy to deploy on construction sites; secondly, the wireless sensor networks make up a mesh communication tree which is self-reconfi gurable when routers are added, taken away or moved about, hence easily reconfi gurable according to work progress and the dynamic schedule typical of these places. The packet error ratio (that is the ratio of missed packets on total number of packets) is always lower than 2/100 with varying distance and WiFi interference, and accuracy is always within 3.5 m even if obstacles are interposed.
The low power features of the network are guaranteed thanks to a reduced router duty cycle operating in the asynchronous mode. The main innovation introduced by the technology developed here consists in an extension of the ZigBee standard, which is also able to provide ultra-low power consumption for routers. The feature resides in the introduction of an always active asynchronous communication system that requires a very small amount of energy and instantly enables real data transmission when required. Each router remains in sleep mode so as to reduce power consumption until it has to route a message or reply to a request. In these cases an asynchronous radio signal at 868 MHz wakes it up and allows it to work without waiting for a sync.
Localization is performed through the application of the Weighted Centroid Localization (WCL) approach [24]. The ZigBee routing strategy itself offers the possibility to use the RSSI value in order to estimate the distance between two communicating devices. According to the transmission equation
in free space [25], which takes into account the transmission power PTX and the respective gains of the receiver and the transmitter antennas (GRX and GTX) as well as the carrier wavelength λ, the power PRX of the detected signal decreases with the square of the distance d from the transmitter:
The RSSI value is defi ned as the received power level in dBm relative to the reference power PRef= 1 mW:
The middle layer of the system was programmed so that the whole area of the site being tested was monitored as a set of sub-areas, defi ned through the input of geographical coordinates. A list of authorized workers was assigned to each sub-area, associated to the corresponding time windows in which they are authorized to operate. An iterative control was then carried out for each data record, in order to verify whether any worker accessed an unauthorized sub-area; should this be positive an alert would be sent.
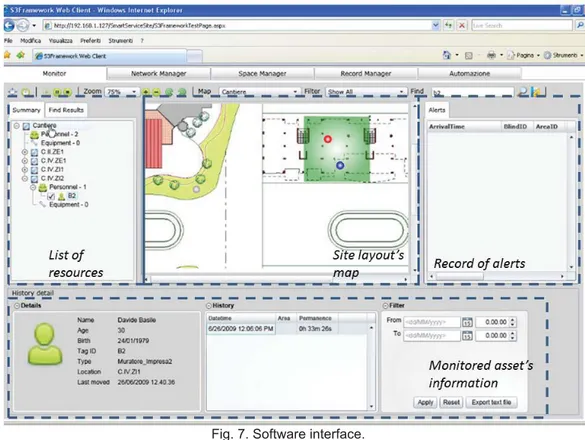
A user-friendly web-based user interface was designed to provide the following features (Fig. 7): • real-time monitoring of the assets on site;
• classifi cation of the resources according to predefi ned categories and to the inputted sub-areas; • on screen selection of the visualized tags to list their related features (ID, position, type of resource,
local coordinates and history); • alert management.
It is assumed that the fi rst edition of the H&S plan includes a work plan with the list of tasks
and work teams to be employed. Therefore given a list of the teams present on site during each work phase, the H&S coordinator imports all the relevant data and selects the areas which each team is allowed to operate in or pass through. Interference avoidance is then accomplished by means of the following logic: if two or more teams are found to operate in the same work area without being explicitly authorized on the basis of the input provided by the H&S coordinator, a warning message is generated.
The experimental campaign was conducted on a construction site in the Italian town of Fano (PU) where seven blocks of fl ats are being built and several work teams are employed at the same time. A parallel work organization was chosen, whereby the project was divided into independent parts (or sub-areas), each to be carried out independently. In such conditions the expected area of operation for the employed resources is known. The whole commitment was divided into fi ve sub-areas, and managing health and safety against unauthorized interferences was considered a key challenge by the health and safety coordinator.
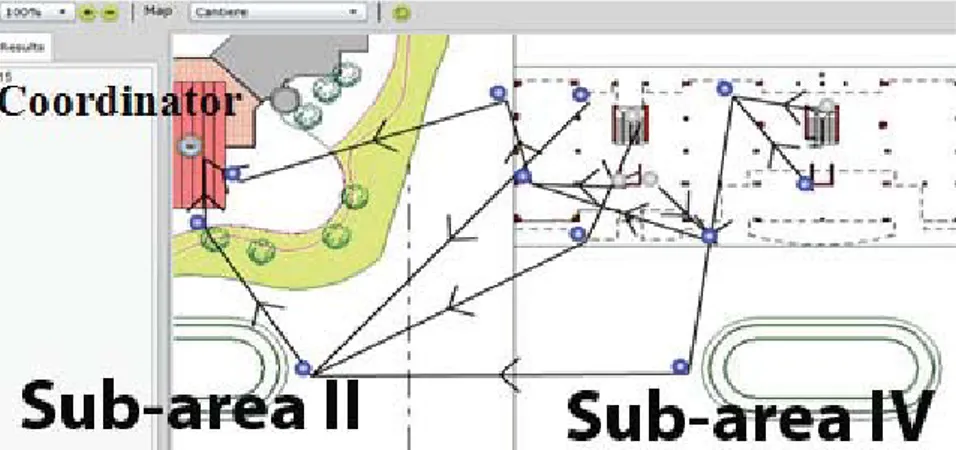
In the entire residential area two types of block will be built, including an overall number of 120 fl ats, having a reinforced concrete bearing structure, with concrete slab fl oors and masonry type walls. The network was installed in the areas shown in Figs. 8 and 9-a, partially overlapping parts II and IV and touching part III. This choice was made in order to realistically simulate the case of workers crossing from one sub-area to another and to check whether the system is able to detect unauthorized accesses.
The routers of the network were installed on the site as shown in Fig. 8. It should be noticed that, thanks to the use of wireless and untethered devices, their installation is easy and non-invasive. In fact, the routers are hard-packed inside water tight, relatively small (0.08 m×0.1 m×0.05 m) plastic boxes, which can be easily fastened to walls, concrete surfaces, scaffold’s columns and so on, using nails, glue or thin wires. The exact GCS coordinates (Geographic Coordinate System) of all the routers can be worked out through the GPS measurement of the position of one of the routers and the measurement of the relative coordinates of the others. One coordinator and the PC running the Server Application were located in sub-area II, where work was at a more advanced stage, and three tags were given to the same number of team members performing the experimental tests.
The positions of the 15 installed routers (blue and gray circles in the fi gure) and the coordinator (depicted as the biggest circle inside sub-area II) are shown in Fig. 8.
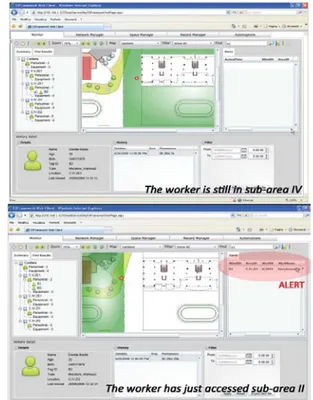
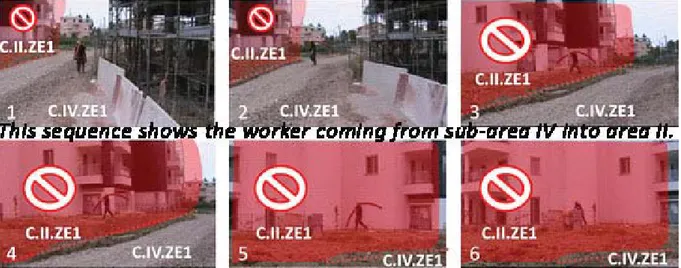
In order to validate the software capability to promptly signal unauthorized access, in this case the occurrence of such an event was planned to take place from sub-area IV into sub-area II. A person was equipped with one tag hanging from the belt, and then dressed like a worker and asked to move from the initial point to the destination depicted in Fig. 9-a. Another operator fi lmed in real-time the screenshots of the software interface, in order to capture the time when the unauthorized entrance was signaled and verify its delay with respect to the time instant of crossing from sub-area II to sub-area IV. In this case the tag polling frequency was set at 5 s and the alert shown in the second screenshot of Fig. 9-b was sent 5–6 s after the unauthorized access took place across the border line between areas II and IV. The shot sequence in Fig. 10 shows images regarding the trial performed and the operator path.
In both cases the system correctly matched the operator’s area and in the second phase it was able to send warnings as required. In particular, the network deployment was not affected by obstructions caused by reinforced concrete walls and by metal scaffolding, nor was it disadvantaged by the low density deployment. The software interface proved to be a very powerful tool for site management. It worked well for checking which resources were present on site at any time, and also sent alerts to the Health and Safety coordinator when any worker did not behave as expected.
6. CONCLUSIONS
The development of a prototype system for proactive safety management and real-time alerting against potential overhead hazards, based on a UWB real-time tracking technology, has been presented. It implements a control logic exploiting localization data to test in real time whether a worker is about to access predefi ned potentially dangerous areas such as those where tools, materials and other objects could fall from above.
Also, this paper highlights that pervasiveness calls for low invasiveness and ease of deployment, otherwise monitoring technologies would dangerously interfere with ongoing activities and would increase the initial costs of site setup. For that reason, the potential of an infrastructureless monitoring system has been reported: it is based on the IEEE 802.15.4 standard medium access and the ZigBee stack wireless communication protocol. It needs no cabling, being battery powered thanks
Fig. 9. Path followed by the worker during the second phase of the trial (a) and two of the screenshots recorded during the same (b) trial.
to its ultra-low power features, and it proved to be reliable, self-healing, easy to deploy and low cost. Similarly, PM10 tracking was performed by means of a ZigbeeTM based communication protocol, which mounted a cheap Sharp dust monitoring sensor. The laboratory tests showed that this system is sensitive enough to signal any occurrence of intense dust generation.
Our fi ndings provide evidence that state-of-the-art sensing and communication technologies, properly coupled with intelligent logics, can be reliably used for the implementation of proactive safety management policies and can be used in support of safety inspectors. These can be warned by the system when hazards connected to pre-determined potential risk are occurring. As a consequence, better safety management of construction sites would be had.
Fig. 10. Path followed by the worker from sub-area IV to sub-area II during the second phase of the trial.
REFERENCES
[1] Navon, R., Asce, M., Kolton, O. (2006), Model for automated Monitoring of Fall Hazards in Build-ing Construction, in Journal of Construction EngineerBuild-ing and Management, 132 (7).
[2] European Commission, Directorate-General for Employment: Social Affairs and Equal Opportuni-ties (2008), Causes and circumstances of accidents a twork in the EU, Offi ce for Offi cial Publications of the European Communities, Luxembourg, ISBN: 978-92-79-11806-7.
[3] Wang, A.P., Chen, J.C., Hsu, P.L. (2004), Intelligent CAN-based Automotive Collision Avoidance warning system, in Proceedings of the 2004 IEEE International Conference on Networking, Sensing & Control, March 21–23, Taipei, Taiwan.
[4] Tantisevi, K., Akinci, B. (2007), Automated generation of workspace requirements of mobile crane operations to support confl ict detection, in Automation in Construction, 16 (3) pp. 262–276.
[5] Oloufa, A. A., Masaaki, I., Hiroshi, O. (2003), Situational awareness of construction equipment using GPS, wireless and web technologies, in Automation in Construction, 12 (6) pp. 737–748. [6] Kukadia, V., Upton, S., Hall, D. (2003), Control of dust from construction and demolition activities, BRE Bookshop eds., ISBN: 1860816126.
[7] Navon, R., Asce, M., Kolton, O. (2007), Algorithms for Automated Monitoring and Control of Fall Hazards, in Journal of Computing in Civil Engineering, 21 (1).
[8] Fontana, R.J., Gunderson, S.J. (2002), Ultra-wideband precision asset location system, in Pro-ceedings of 2002 IEEE Conference on Ultra Wideband Systems and Technologies, May, Baltimore, MD.
[9] Khoury, H.M., Kamat, V.R. (2009), Evaluation of position tracking technologies for user localiza-tion in indoor construclocaliza-tion environments, in Automalocaliza-tion in Construclocaliza-tion, 18 pp. 444–457.
[10] Teizer, J., Lao, D., Sofer, M. (2007), Rapid automated monitoring of construction site activities using Ultra-WideBand, in Proceedings of the 24th International Symposium on Automation and Ro-botics in Construction – ISARC 2007, September 19– 21, Kochi, India.
[11] Saidi, K.S., Teizer, J., Franaszek, M., Lytle, A.M. (2011), Static and dynamic performance evalu-ation of a commercially-available ultrawideband tracking system, in Automevalu-ation in Construction, 20 (5) pp. 519–530.
[12] Zhang, C., Hammad, A., Rodriguez, S. (2012), Crane pose estimation using uwb real-time loca-tion system, in Journal of Computing in Civil Engineering, 26(5), p. 625–637.
[13] Cheng, T., Venugopal, M., Teizer, J., Vela, P. (2011), Performance evaluation of ultra wideband technology for construction resource location tracking in harsh environments, in Automation in Con-struction, 20 (8) p. 1173–1184.
[14] Giretti, A., Carbonari, A., Naticchia, B., DeGrassi, M. (2009), Design and fi rst development of an automated real-time safety management system for construction sites, in Journal of Civil Engineer-ing and Management, 15 (4) p. 325–336.
[15] Khoury, H.M., Kamat, V.R. (2009), High-precision identifi cation of contextual information in loca-tion-aware engineering applications, in Advanced Engineering Informatics Journal, 23 (4) p 483–496. [16] Lee, U.K., Kim, J.-H., Cho, H., Kang, K.-I. (2009), Development of a mobile safety monitoring system for construction sites, in Automation in Construction, 18 (3) p. 258–264.
[17] Cho, Y.K., Youn, J.H., Martinez, D. (2010), Error modeling for an untethered ultra-wideband sys-tem for construction indoor asset tracking, in Automation in Construction, 19 (1) p. 43–54.
[18] Jang, W., Skibniewski, M.(2008), A wireless network system for automated tracking of construc-tion materials on project sites, in Journal of Civil Engineering and Management, 14 (1) p. 11–19. [19] ZigBee Alliance (2007), Zigbee and wireless radio frequency coexistence, Document 075026r02. May 2007.
[20] O’Rourke, J. (1994), Computational Geometry in C, Cambridge University Press edition. [21] Teizer, J., Mantripragada, U., Venugopal, M. (2008), Analyzing the travel patterns of construc-tion workers, in Proceedings of the 25th Internaconstruc-tional Symposium on Automaconstruc-tion and Robotics in Construction – ISARC 2008, June 26–29, Vilnius, Lithuane.
[22] Carbonari, A., Biscotti, A., Naticchia, B., Robuffo, F., De Grassi, M. (2009), A management sys-tem against major risk accidents in large construction sites, in 2010 Proceedings of the 27th ISARC, Bratislava, Slovakia.
[23] Budde, M., Busse, M., Beigl, M. (2012), Investigating the use of commodity dust sensors for the embedded measurement of particulate matter, in Proceedings of 9th International Conference on Networked Sensing Systems (INSS), Antwerp, Belgium, June.
[24] Blumenthal, J., Grossmann, R., Golatowski, F., Timmermann, D. (2007), Weighted centroid localization in ZigBee-based sensor networks, in Intelligent Signal Processing, WISP 2007. IEEE International Symposium on, IEEE, pp. 1–6.
[25] Friis, H. (1946), A note on a simple transmission formula, in Proceedings of the IRE 34 (5), p. 254–256.