UNIVERSITÀ DEGLI STUDI DELLA TUSCIA DI VITERBO
DIPARTIMENTO DI ONCOLOGIA SPERIMENTALE, ISTITUTO REGINA ELENA
Corso di Dottorato di Ricerca in
Genetica e Biologia Cellulare- XXVII Ciclo.
“HIPK2 deficiency causes chromosomal
instability by cytokinesis failure and
increases tumorigenicity”
s.s.d. BIO/11Tesi di dottorato di: Dott. Davide Valente
Coordinatore del corso Tutore
Prof. Giorgio Prantera Dott.ssa Cinzia Rinaldo
1
INDEX
INDEX 1
ABSTRACT 2
INTRODUCTION 3
Homeodomain interacting protein 2 (HIPK2) 3
Tetraploidy and cancer 9
Pancreatic ductal adenocarcinoma 15
AIM 18
RESULTS 19
Hipk2 absence cause aneuploidy and CIN but do not promote transformation 19
E1A/Ras-transformed Hipk2-/- MEFs show high rates of cytokinesis failure 23
Cytokinesis failure of E1A/Ras Hipk2-/- MEFs leads to aneuploidy and CIN 26
E1A/Ras Hipk2-/- MEFs are markedly more tumorigenice than E1A/Ras Hipk2+/+
and generate highly aneuploid tumors in vivo 29
Reduced HIPK2 expression correlates with high tumor and nuclear grade in
pancreatic adenocarcinoma 34
CONCLUSION 36
FUTURE PERSPECTIVES 39
METHODS 40
2
ABSTRACT
Homeodomain Interacting Protein 2 (HIPK2), a cell fate decision kinase inactivated in several human cancers, is thought to exert its oncosuppressing activity through its p53-dependent and -inp53-dependent apoptotic function. However, a HIPK2 role in cell proliferation has also been described. In particular, HIPK2 is required to complete cytokinesis, the last step of cell division, and impaired HIPK2 expression results in cytokinesis failure and tetraploidization. Since tetraploidy may yield to aneuploidy and chromosomal instability (CIN), we asked whether the unscheduled tetraploidy caused by loss of HIPK2 might contribute to tumorigenicity generating aneuploidy and CIN. Here, we show that, compared to Hipk2+/+ mouse embryo fibroblasts (MEFs), Hipk2-null MEFs accumulate subtetraploid karyotypes and develop CIN. At the functional level, accumulation of these defects inhibits proliferation and spontaneous immortalization of primary MEFs whereas it associates with increased tumorigenicity when MEFs are transformed by the E1A and Harvey-Ras oncogenes. Upon mouse injection, E1A/Ras-transformed Hipk2-null MEFs, but not their Hipk2+/+ counterparts, generate near-tetraploidy tumors. Thus, we evaluated HIPK2 expression in a human cancer derived by initial tetraploidization event, such as pancreatic adenocarcinoma. We analyzed HIPK2 protein levels by immunohistochemistry in tissue microarrays including different stages of pancreatic malignant progression. Of relevance, we found a significant correlation among reduced HIPK2 expression, increased grade of malignancy, and higher nuclear size of tumor cells, a marker of increased ploidy and CIN. Overall, these results indicate that HIPK2 acts as a caretaker gene, whose inactivation causes CIN by cytokinesis failure and increased tumorigenicity.
3
INTRODUCTION
Homeodomain Interacting Protein 2 (HIPK2)
The HIPKs family is composed by four serine/threonine kinase (HIPK1-4) that are extremely evolutionarily conserved in vertebrates and derive by yeast kinase Yak1 (Kim et al., 1998).
HIPK1, HIPK2 and HIPK3 have a similar protein structures with a 90% of homology in the kinase domain, that is the enzymatic domain, and 70% for the homeobox interacting domain (HID), that is the region of interaction with homeodomain protein and other molecules (Kim et al., 1998; Figure 1).
HIPK4 has been discovered through in silico analysis on human kinome and it is the only member that miss the HID; for this reason it likely exerts different biological functions respect to the other HIPKs (Schmitz et al., 2014).
Even if these kinases are very similar each other, HIPK2 seems to have a higher biological relevance. Indeed HIPK2 is detected much more frequently than its sister kinases in unbiased screens or in yeast two-hybrid screens. For this reason HIPK2 is the most characterized and studied HIPKs member. (Schmitz et al., 2014)
Figure 1. Schematic representation of HIPK2 structural domains. N-ter: N-terminal domain; HID: Homeobox Interactive Domain; PEST: region containing a sequence rich in P, E, S and T, that is important for HIPK2 regulation and interaction with other protein; AID: Auto-Inhibitory Domain; YH: Y and H rich domain. (Adapted from Siepi et al, 2013)
HIPK2 has been originally identified as a corepressor for the homeodomain transcription factor NKx1.2, but, during the last years a plethora of new HIPK2 interactors and substrates has been found and HIPK2 has been involved in a lot of different signal transduction pathway and cellular processes, such as cell proliferation, transcriptional regulation, DNA damage response, differentiation, angiogenesis and antiviral responses. (Rinaldo et al., 2007)
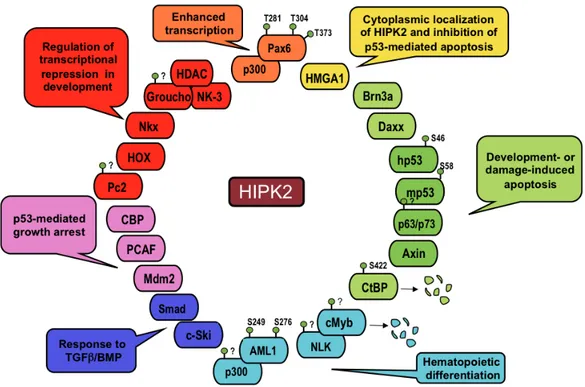
4 Figure 2. HIPK2 targets. Schematic representation of HIPK2 targets with indicated biological activity and phosphorilation site/s (Adapted from Rinaldo et al., 2007)
HIPK2 plays a role in DNA damage response pathway by binding and phosphorylating several transcription factors and coregulators. One of the main substrate through which HIPK2 exerts this role is the tumor suppressor p53. HIPK2 and p53 colocalize at PML-Nuclear bodies and HIPK2 interacts with the C-terminus of p53 regulating its localization, phosphorylation, acetylation, and transcriptional activity (D’Orazi et al., 2002; Hofmann et al., 2002). Normally, the activation of HIPK2, in proliferating unstressed cells, is finely controlled by a protein degradation mechanism. Several E3 ubiquitin ligase (e.g. Siah-1, Siah-2, WD40 repeat/SOCS, MDM2) are able to polyubiquitinate HIPK2 leading to its degradation and blocking its functions (Rinaldo et al., 2007b; Choi et al., 2008; Calzado et al., 2009; Kim et al., 2009). Upon severe DNA damage by UV irradiation or antineoplastic treatments, such as doxorubicin or cisplatin, the HIPK2 degradation is blocked. To escape the proteasome dependent degradation HIPK2 requires the kinases ATM and ATR, that phosphorylate the ubiquitin ligase Siah-1 leading to its degradation and to HIPK2 stabilization (Winter et al., 2008). Once accumulated, HIPK2 phosphorylates human p53 at Ser46 (or mouse p53 at Ser58) driving to apoptosis by p53-mediated transcriptional activation of pro-apoptotic factor, such as BAX and NOXA, and repression of anti-apoptotic factors, such as Galectin-3 (D’Orazi et al., 2002; Hofmann et al., 2002; Di
! 6!
Figure 1. Schematic representation of HIPK2 targets
The protein that were shown to interact with HIPK2 are reported together with their respective biological activities. The known sites of HIPK2-induced phophorylation are indicated.
The structure of HIPK2 (1189 aa) is characterized by an N-terminal region containing a sumoylation site and a kinase domain (KD) followed by a homeobox-interacting domain (HID), a PEST-sequence containing region (rich in Proline, Glutamic acid, Serine and Threonine) and a C-terminal region that includes a speckle-retention signal (SRS), a putative autoinhibitory domain (AID), and an ubiquitylation site (Figure 2).
5 Stefano et al., 2004; Cecchinelli et al., 2006).
HIPK2 regulation is critical to control the p53 activity and to balance the cell fate of DNA damaged cells between growth arrest and apoptosis. On one hand, when damage is severe and irreparable, HIPK2 is accumulated, p53 is then phosphorilated on Ser46 and its pro-apoptotic functions lead to cell death; on the other hand when damage is repairable, a crosstalk between MDM2 and HIPK2 determines HIPK2 degradation, p53 is not phophorilated and its growth arrest functions are preferred to attempt DNA damages reparation (Rinaldo et al., 2007b; Shmueli and Oren, 2007; Figure 3).
This HIPK2 regulation mediated by MDM2 addresses the different outcome of p53 reactivating coumpond treatments, Reactivation of p53 and Induction of Tumor cell Apoptosis (RITA) and Nutlin3. Nutlin-3 induces mitotic arrest of in vivo tumor xenograft cells (Vassilev et al., 2004) while RITA induces the apoptosis of the same cells (Issaeva et al., 2004). The different outcomes are due to the mechanisms of action of the two coumpounds. Nutlin3 is able to bind MDM2 in its p53 pocket inhibiting p53 degradation (Vassilev et al., 2004), but preserving the enzymatic activity of MDM2. Thus Nutlin-3 allows MDM2-mediated HIPK2 degradation. On the other side, RITA acts directly on p53 preventing the p53-MDM2 binding, which causes p53 accumulation, and downregulating MDM2 levels, which causes HIPK2 stabilization and consequent p53 HIPK2-mediated phosphorylation on Ser46 (Rinaldo et al., 2009).
6 Figure 3. HIPK2-mediated p53 Ser46 phosphorylation (p53 Ser46P) affects cell fate decision. Upon mild DNA damage, p53 induces overexpression of Mdm2, which determines HIPK2 degradation by ubiquitination and prevents the p53 phosphorilation on Ser46 favoring growth arrest. Conversely after severe DNA damage MDM2 levels are low, HIPK2 is stabilized and can phosphorilates p53 on Ser46. p53 Ser46P selectively transactivates proapoptotic genes and subsequent cell death. Low levels of Mdm2 may also promote translocation of monoubiquitinated p53 to the mitochondria, where it further augments apoptosis. (adapted from Shmueli and Oren, 2007)
HIPK2 can also promote apoptosis by targeting factors other than p53, such as promoting the CtBP transcriptional apoptotic co-repressor degradation by a specific phosphorilation at Ser422 (Zhang et al., 2003), or by modulating the activity of other proteins, directly or indirectly related to apoptosis, such as the p53 family members p73 and p63 (Kim et al., 2002; Lazzari et al., 2011) and the p53 inhibitor MDM2 (Wang et al., 2001; Di Stefano et al., 2004).
Reduction of HIPK2 expression by RNA-specific interference (RNAi) was shown to impair apoptosis and induce resistance to different chemotherapeutics (Krieghoff-Henning and Hofmann, 2008; Puca et al., 2010), suggesting that HIPK2, like other genotoxic stress
7 responders or apoptosis activators, is a tumor suppressor on its own. Indeed, a few mechanisms of HIPK2 inactivation have been identified in human cancers, such as HIPK2 forced cytoplasmic relocalization in leukemogenesis and in breast carcinomas (Wee et al., 2008; Pierantoni, personal comunications), HIPK2 mutations in acute myeloid leukemia (Li et al., 2007), and allele-specific loss of heterozygosity in thyroid cancers (Lavra et al., 2011). Recently, a screening for genetic alterations in radiation-induced thymic lymphomas demonstrated that Hipk2 is a haploinsufficient tumor suppressor gene in vivo, showing loss of one Hipk2 allele in 30% of the tumors and increased susceptibility of Hipk2+/- mice to radiation-induced thymic lymphoma (Mao et al., 2011).
During development, impaired proliferation, rather than apoptosis defects, has been observed. Hipk2-/- mice born at a reduced mendelian rate; they can survive and be fertile but they are significantly smaller than their wild-type littermates throughout adulthood (Isono et al., 2006) and proliferation defects have been observed in sensory neurons (Wiggins et al., 2004) and in MEFs (A. Fusco, personal comunication). Hipk1/Hipk2 double knockout embryos die between 9.5 and 12.5 days post-coitus with proliferation defects (Isono et al., 2006), confirming a role in cell proliferation and suggesting redundancy between the two members of the HIPK family. Moreover, induction of HIPK2 expression was observed upon cell cycle reactivation of quiescent cells, including G0 peripheral blood mononuclear cells (Iacovelli et al., 2009).
Recently, a novel role of HIPK2 in cell division has been demonstrated by Rinaldo and coworkers (Rinaldo et al., 2012). Particularly, they identified in the histone H2B a new unexpected interactor of HIPK2. HIPK2 and the histone H2B localize at midbody, the organelle-like bridge formed between the two daughter cells during cytokinesis. Furthermore, they found that HIPK2 phosphorilates H2B at Ser14. The localization of HIPK2 at midbody and its H2B specific phosporilation (H2B-Ser14P) are critical for a successful cytokinesis. Indeed, HIPK2 depletion or HIPK2 kinase dead mutant overexpression lead to the absence of H2B-Ser14P at midbody, causing failure of cytokinesis and binucleation. Of relevance, the overexpression of phospho-mimetic mutant H2B-Ser14D rescues cytokinesis failure in Hipk2 null cells, clearly demonstrating that HIPK2-mediated phosphorilation of H2B at Ser14 is required for a successful cytokinesis. Since HIPK2 and H2B-Ser14P are also associated to nuclear functions related to DDR (Pérez-Cadahia et al., 2010), one hypothesis to explain their localization at midbody could be the involvement in DDR pathway and the presence of chromosomal bridge in
8 cytokinesis. Nonethless, the authours showed that H2B-Ser14P and HIPK2 localization at midbody occurs independently from the presence of DNA at cleavage plane, demonstrating novel intriguing HIPK2/H2B crosstalk in cytokinesis independent from DNA damage (Rinaldo et al., 2012; Figure 4).
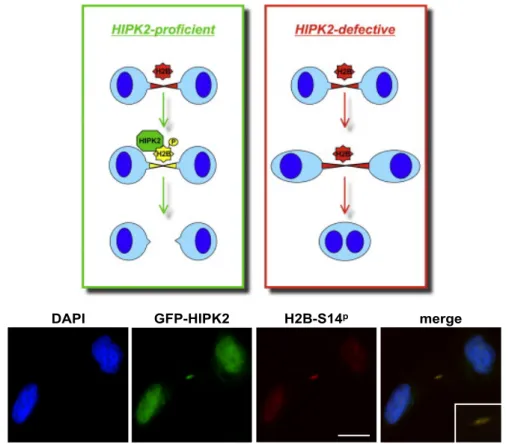
Figure 4. Graphical abstract of cytokinesis in HIPK2 proficient or defective cells. Lacks of H2B-Ser14P localization at midbody in HIPK2 defective, results in cytokinesis defects and binucleation. The immunofluorescence images show HIPK2 and H2B-Ser14P localization during cytokinesis in HeLa cell. (adapted from Rinaldo et al., 2012)
This fascinating new role of HIPK2 could unveil an important mechanism in tumor formation/progression and could represent another HIPK2 oncosuppressive function besides the already demostrated function in DDR. Indeed, the proliferation of binucleated tetraploid cells could lead to aneuploidy, one of the hallmark of cancer, promoting chromosomal instability, cell transformation and cancer progression.
! 23!
Surprisingly, in non-irradiated control cells, a clear localization of both EGFP-HIPK2 and H2B-S14P was observed within the intercellular bridges at the midbody, in all the telophases analyzed (n=100, Figure 10).
Figure 10. Localization of EGFP-HIPK2 and H2B-S14P in Control Cells
Control, untreated HeLa cells from the experiment reported above show a midbody localization of both EGFP-HIPK2 and H2B-S14P. Representative images obtained by anti-p-Histone H2B-S14 Ab are reported. Here and in the following figures, enlarged midbody region of the merge is shown in the box.
The consistency of this peculiar distribution prompted us to investigate it; we first confirmed the midbody localization of HIPK2 and H2B-S14P in different human and mouse cells by employing HIPK2 with a different tag (FLAG at the N-terminus) (Figure 11). Next, we verified the specificity of the H2B-S14P staining at the midbody by peptide competition and challenged the identification of endogenous H2B at the midbody by IF with anti-H2B Abs that recognize this histone independently of its posttranslational modifications (Figures 11, Table S1).
GFP-HIPK2 H2B-S14p merge DAPI u n tr ea te d
9 Tetraploidy and cancer
Genome integrity is essential for a correct functionality of cells and tissues. The diploidy state maintainance in mammalian somatic cells is assured at least by three main control mechanisms: regulation of DNA replication, DDR pathway and spindle assembly checkpoint. These mechanisms act on cell cycle to prevent the proliferation of cells with abnormal DNA contents (Davoli and De Lange al, 2011).
The DNA replication is blocked in G1 phase through the formation of pre-replication complex (pre-RC) to avoid early replicating events. Cdt1 is an essential factor of pre-RC complex; its degradation via proteasome during the early S phase and the expression of Cdt1-inhibitor geminin, during S and G2 phases, prevent premature re-formation of pre-RC complex and allow correct and complete replication. In the next G1 geminin is degradated by APC/C-Cdh1 ubiquitin ligase and Cdt1 can form the pre-RC complex and stop the replication until next S phase occurs (Remus and Diffley, 2009).
The DDR controls the integrity of genome and prevent the replication of damaged DNA. When genotoxic stresses produce single or double strand breaks in G1, the kinases ATM and ATR phosphorilate the downstream effector, Chk1 and Chk2, starting a phosphorilation cascade that lead to cell cycle arrest through: i) inactivation of Cdc25A phosphatase, required for activation of Cdk2, ii) activation of p21, a Cdk2 inhibitor; iii) activation of p16, that prevents phosphorylation of Rb (Ciccia and Elledge, 2010).
The correct chromosome segregation during mitosis is regulated by a kinetochore-microtubule attachments control called Spindle Assembly Checkpoint (SAC). When a chromosome is unattached to microtubule during metaphase or is not correctly oriented, the SAC is activated and stops the mitosis at anaphase. Only once chromosomes are correctly bi-oriented, the SAC is deactivated and allow the ubiquitin ligase APC/C to degradate the securin. Without securin, separase is free to cleave the cohesins, that maintain joined the sister chromatids, and the mitosis can go ahead (Musacchio and Salomon, 2007).
Dysfunctions in the checkpoint systems can lead to aneuploidy, a condition in which cells gain or loss one or more chromosomes, that is dangerous for the integrity of the genome and omeostasis of the tissues. Indeed, the genetic imbalance derived from this condition is thougth to be potentially oncogenic and most solid human tumors are characterized by aneuploidy (Holland and Cleveland 2009).
10 Another kind of chromosomal number aberration is polyploidy, that is a condition in which cells contain a multiple integer of normal diploid set of chromosomes, in particular tetraploid cells contain double DNA content, i.e. four set of chromosomes. Many species of plants, insects, fish, amphibians are characterized by a tetraploid DNA content, nonetheless mammals are all diploids and do not tolerate germline polyploidization (Otto, 2007). The only exception could be represented by red vizcacha rat, but its tetraploidy status is controversial (Svartman et al., 2004). Thus, tetraploid mammals embryo caused by meiotic or mitotic error undergo spontaneous abortion or resorption (Kaufman, 1991; Davoli and De Lange, 2011).
Although diploidy characterize nearly all the normal human cells, there are some cells that permit a physiological polyploidization through different mechanisms:
• Trophoblast giant cells, that can skip mitosis because reduced amounts of geminin, provoking S and G phase alternation;
• Megakariocytes and Hepatocytes, that undergo endomitosis, a particular mitosis in which cytokinesis fails;
• Muscle cells and osteoclasts, in which occur cell fusion.
If and how polyploidization confers benefits to these cells is not fully understood. Probably the decreased surface/volume ratio minimizes membrane requirements and increase the metabolic capacity confering advantageous energetic conditions for involved tissues. (Davoli and De Lange 2011; Comai 2005). Furthermore, tetraploid cells are shown to be more resistant to stress and polyploidization has been proposed as stress response mechanism in liver (Celton-morizur and Desdouets, 2010; Pandit 2013).
Except for the cases described above, proliferation of polyploid cells is not allowed and it is potentially dangerous. Indeed, a well-established hypothesis on tumorigenesis, recently confirmed in mice by Fujiwara et al 2005, is that tetraploid cells can act as genetically unstable intermediate, facilitating the formation of aneuploidy and the transformation of cells (Ganem et al., 2007; Nigg et al, 2002; Storchova and Pellman, 2004). (Figure 5)
11
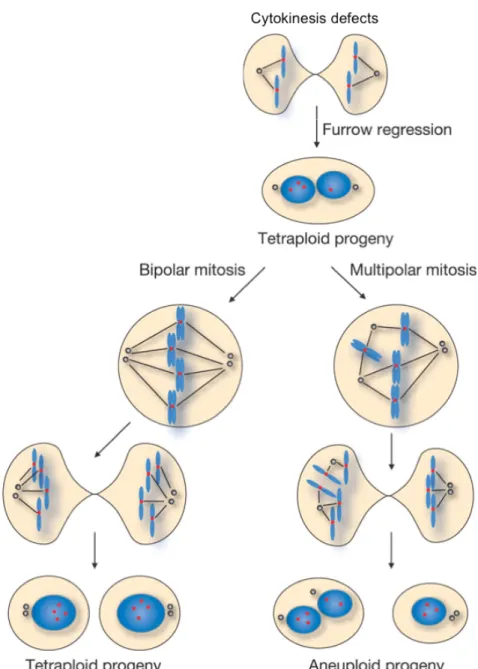
Figure 5. Proposed model of aneuploidy generating from tetraploidy. Cytokinesis defects cause cleavage furrow regression and binucleated tetraploid cells formation. The presence of extracentrosomes can lead to bipolar or multipolar mitosis during tetraploid unscheduled proliferation. Bipolar mitosis generates two tetraploid cells with the same amount of chromosomes, while, if multipolar mitosis occurs, chrosomomes will be missegregated giving rise to aneuploid cells (modified from Shi and King, 2005)
Since Boveri time, more than 100 years ago, it has been observed that aneuploid cells show multiple centrosomes and multipolar mitoses and it has been reported that many aneuploid tumors contain cells with multiple centrosomes (Holland and Cleveland, 2009). Tetraploidy could be one of the causes of the presence of multiple centrosomes. Further recent studies show the presence of tetraploid cells in premalignant condition, such as the Barret oesophagus, a metaplasia of the normal stratified squamous epithelium (Galipeau et al., 1996; Reid et al., 2010).
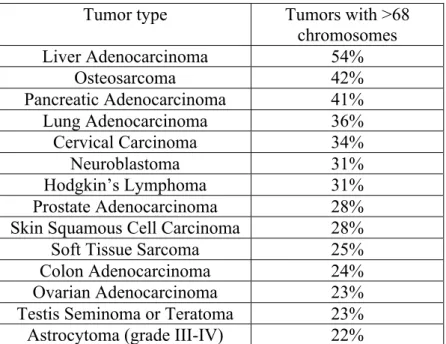
12 Moreover for many aneuploid cancers, characterized by hypertriploid/near tetraploid karyotypes, an early/intermediate tetraploidization event has been hypothesized (see table 1). These abnormal karyotypes cannot be explained by a diploid cell chromosomal instability. In fact, it has been calculated that, to form a hypertriploid karyotype, a diploid cell would required more than 150 population doublings, while a single tetraploidization event can double the DNA content in only one cell division. (Davoli and De Lange, 2011)
Tumor type Tumors with >68
chromosomes Liver Adenocarcinoma 54% Osteosarcoma 42% Pancreatic Adenocarcinoma 41% Lung Adenocarcinoma 36% Cervical Carcinoma 34% Neuroblastoma 31% Hodgkin’s Lymphoma 31% Prostate Adenocarcinoma 28%
Skin Squamous Cell Carcinoma 28%
Soft Tissue Sarcoma 25%
Colon Adenocarcinoma 24%
Ovarian Adenocarcinoma 23%
Testis Seminoma or Teratoma 23%
Astrocytoma (grade III-IV) 22%
Table 1. List of tumors with a chromosome number >68. Data derived from Mitelman database are used to calculate the percentage of tumors with >68 chromosomes. In the list are reported the tumor types with a percentage higher than 20%. (Adapted from Davoli and De Lange, 2011)
Since deleterious mutations could be easily masked by the presence of extra copies, the presence of four set of each chromosome could offer a simply method to allow mutation load with a higher ratio than diploid cells, facilitating the evolutionary stabilization of mutations and combination with other mutations. The presence of multiple centrosomes could also lead to multipolar spindle generating errors in chromosomal segregation and then favoring the formation of aneuploidy (Shi and King, 2005; Pellman, 2007). In mice, tetraploids, generated by transient cytokinesis failure in p53-null mouse mammary epithelial cells (MMECs), have an increased frequency of whole-chromosome missegregation and chromosomal rearrangements. MMECs p53-null tetraploids are more prone to transformation after exposure to carcinogen and, when transplanted into nude mice, form malignant mammary epithelial cancers more easily than their diploid p53-null control (Fujiwara et al., 2005). Thus, tetraploidy has been proposed as an intermediate that
13 facilitates structural changes and brings to disruption of cell growth checkpoint (Storchova and Pellman, 2004; Otto, 2007).
The proliferation of tetraploid cells is generally inhibited (Vitale et al., 2011). It has been demostrated that, when cytokinesis is inhibited by cytochalasin B, the derived binucleated cells stop proliferating, through a mechanism that involve the oncosoppressor key factors p53 and Rb, and undergo apoptosis (Andreassen et al., 2001; Margolis et al., 2003; Castedo et al., 2006). Binucleated cells generated by cell to cell fusion can proliferate only in absence of p53 or transformed by SV40 virus, that inhibits p53 and Rb functions (Duelli et al., 2007; Vitale et al., 2011). These observations led to hypothesize a mechanism in which p53 and Rb control the tetraploid proliferation and survival, the so called “tetraploidy checkpoint”. This checkpoint has been called into question for a long time because it was not clear if G1 arrest and p53 activation would be determined by DNA damage due to prolonged mitosis and/or by the pharmacological treatment used to induce binucleation, rather than the tetraploidy on its own (Uetake et al., 2004).
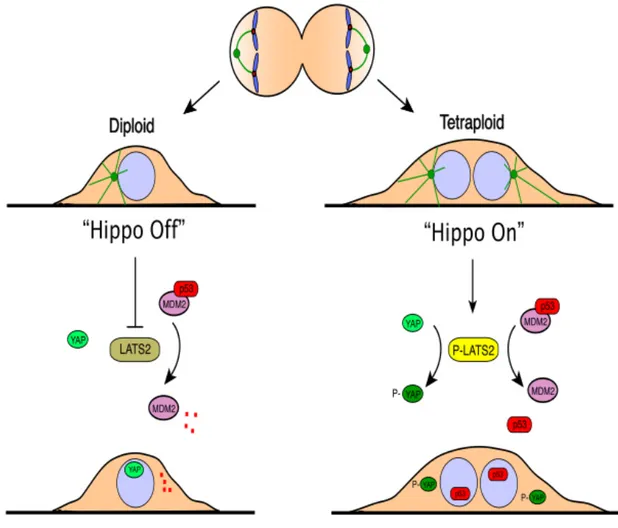
Ganem and coworkers has recently published an elegant study in which identify the pathway responsible for tetraploid cells growth blockage (Ganem et al., 2014). They compared the results of large-scale RNAi screening with two different approaches. With the first approach they monitored in which case tetraploid retinal pigment epithelial human non-trasformed cells (tetraploid RPE-1) generated by different mechanisms and blocked in G1, rescue proliferation; in the second case they showed in which case proliferation is rescued by RNAi in diploid RPE-1 treated with low dosage of doxorubicin to induce low cytostatic DNA damage. A list of three different classes of proteins involved in the tetraploidy response was created by comparison of this two screenings: proteins involved in G1 cell cycle arrest of diploid DNA damaged cells, proteins that allow to enter in S phase both tetraploids and DNA damaged diploid cells, and proteins that allow to enter S phase only tetraploid cells. In this way they identify proteins with a specific role in activation and maintenance of tetraploid G1 arrest. The strongest hit founded, specific for tetraploidy, was the kinase LATS2, previously described as p53 activator by inhibition of MDM2 (Aylon et al., 2006). LATS2 is part of HIPPO tumor suppressor pathway. They demonstrated that when cells become tetraploid, the activation of LATS2 led to YAP/TAZ-dependent transcription inactivation and p53 stabilization. Furthermore, they showed that reduced contractility and multiple centrosomes presence of tetraploid cells can induce the HIPPO pathway (Ganem et al., 2014; Zhao et al., 2014; Figure 6).
14
Figure 6. Proposed model of Hippo pathway and Tetraploidy-Induced Cell Cycle Arrest.
Most tetraploid cells have abnormal cytoskeleton and extra centrosomes, which lead to genomic instability. In this model extra centrosomes initiate G1 arrest via LATS2-YAP pathway. (Adapted from Ganem et al., 2014)
15 Pancreatic Ductal Adenocarcinoma
Pancreatic ductal adenocarcinoma (PDA) is the most lethal common cancer. The median age at diagnosis is 71 years and the worldwide incidence ranges from 1-10 cases per 100000 people/year. It is one of the ten leading cause of death from cancer. The prognosis is poor with an estimated average life expectancy after diagnosis of approximately 3-6 months.
The poor prognosis is mainly due to the lack of effective therapy and of screening tool to diagnose asymptomatic premalignant and early malignant tumors. Thus, most of the times, PDA is diagnosticated at advanced stages when it is not possible a surgical resection, that is currently the only curative therapy possible. Chemoradioterapy and systemic therapy are in use only as adjuvant therapy to reduce risk of metastates and locoregional failure, but they are hardly efficient. For all these reasons the cumulative PDA 5 year survival rate is approximately <5%. (Ryan et al., 2014)
New treatments and screening tools are needed to improve the dramatic prognosis of the disease.
The precursors of PDA are a series of preinvasive neoplasias, histologically and genetically subdivided in three different grade of malignancies, called pancreatic intraepithelial neoplasias (PanINs). Many studies have been performed at molecular level and many aspects of the genetic pathways have been elucidated in the last decades. In 90% of PanINs an oncogenic mutation in KRas is reported (Kanda et al., 2012). Mutation in KRas is thought to be an early event of PDA, indeed has been often founded in absence of other genetic alterations, and it is required also to substain the progression to PDA (Aguirre et al., 2003). Everyway, tumor suppressor genes inactivation is necessary to step forward to a higher grade of malignance. The main mutations in tumor suppressors include p53, CDKN2A, that is involved in G1 cell cycle arrest pathway, and SMAD4, involved in TGF-β response pathway (Ryan et al., 2014; Hustinx et al., 2005; Figure 7)
Failure of cytokinesis is considered as a major mechanism underlying tetraploidization and centrosome amplification in this type of cancer (Sato et al., 1999). Indeed, cytokinesis failure and the tendency of tetraploid cells to evade the tetraploidy checkpoint are frequently observed in an acinarductal transdifferentiating culture model of pancreatic carcinogenesis, predisposing pleiotropic mitotic defects (Sphyris and Harrison, 2005). In the last decades many studies have identified molecular alterations that occur in PanIN as
16 they progress to invasive ductal adenocarcinoma (Tanaka et al., 1984; Hruban et al., 2007; Maitra and Hruban, 2008). However, the molecular mechanisms and genes involved in the cytokinesis failure are still unknown
Figure 7. Frequencies of mutations in Pancreatic Ductal Adenocarcinoma. Approximate frenquencies of the main mutations in patients with PDA. (Adapted from Ryan et al., 2014)
In the last decade engineered mouse models provide an useful tool to dissect these mutations and the outcome deriving by combinations of different mutations. One example is the KRasG12D mouse model that expresses only in pancreas the G12D mutation of KRas and develops PDA with histological features and progression that resemble human PDA (Hingorani et al., 2003; Hingorani et al., 2005)
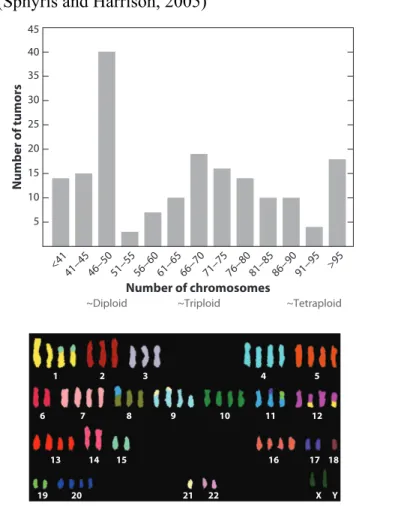
In addition to mutational events, a large scale chromosomal changes and whole-genome duplication are found in pancreatic adenocarcinoma. It was calculated that approximately 41% of pancreatic adenocarcinomas are characterized by tetraploidization event (Davoli and de Lange, 2011; Figure 8). Cytokinesis defects, MDM2 overexpression and ploidy
Pancreatic Adenocarcinoma
n engl j med 371;11 nejm.org september 11, 2014 1041
the metastatic phenotype into distinct genetic subsets.
As the most common oncogenic mutation in pancreatic adenocarcinoma, KRAS activation has been investigated in depth for its contributions to the tumorigenic growth of established cancers. Several studies have shown that the KRAS muta-tion is a marker of a poor prognosis in both patients with resectable tumors and those with unresectable tumors.28 Functional studies have shown that KRAS is critical for the sustained growth of advanced pancreatic adenocarcinoma.
In genetically engineered mouse models in which a mutant KRAS allele can be switched off at any time during tumorigenesis, loss of KRAS expres-sion results in massive cell death and arrested proliferation, leading to rapid tumor regression.29 Similarly, most human pancreatic adenocarcino-ma cell lines are highly sensitized to cell death, arrested proliferation, or both on knockdown of mutant KRAS with the use of RNA interference.30 Therefore, the targeting of KRAS is the subject of many ongoing preclinical and clinical investiga-tions. In addition, the epidermal growth factor
Intraductal Papillary Mucinous Neoplasms Pancreatic Ductal Adenocarcinomas
KRAS (mitogenic signaling) >90% ARID1A ARID1B SMARCA1 (nucleosome remodeling) 10–15% ATM BRCA2 (DNA damage response) 10% MLL2 MLL3 KDM6A (histone methylation) 5–10% TGF-βR1 SMAD4 TGF-βR2 (TGF-β pathway) 50% CDKN2A (G1 cell cycle arrest pathway) >50% p53 (p53 pathway) 60–70% RNF43 (Wnt pathway) >50% GNAS (GPCR signaling) 40–80% KRAS (mitogenic signaling) 40–65% Key Tumor-suppressor gene Oncogene Relative frequency of mutation 1 Longo 8/21/14
AUTHOR PLEASE NOTE: Figure has been redrawn and type has been reset
Please check carefully
Author Fig # Title ME DE Artist Issue date COLOR FIGURE Draft 4 Ryan N Koscal 9/11/2014 Update on Pancreatic Adenocarcinoma
Figure 1. Approximate Frequencies of Mutations in Patients with Pancreatic Ductal Adenocarcinomas and Intraductal Papillary Mucinous Neoplasms.
The two major precursors of pancreatic adenocarcinoma are pancreatic intraepithelial neoplasia and intraductal papillary mucinous neo-plasms. They have a distinct set of mutational events. Red circles indicate commonly mutated oncogenes, and green circles indicate tumor suppressors. ARID1A denotes AT-rich interactive domain 1A; ARID1B AT-rich interactive domain 1B; ATM ataxia telangiectasia–mutated;
CDKN2A cyclin-dependent kinase inhibitor 2A; GNAS guanine nucleotide binding protein, alpha stimulating; GPCR G-protein–coupled receptor; KDM6A lysine (K)-specific demethylase 6A; KRAS Kirsten rat sarcoma viral oncogene homologue; MLL2 mixed-lineage leuke-mia 2; MLL3 mixed-lineage leukeleuke-mia 3; RNF43 ring-finger protein 43; SMAD4 SMAD family member 4; SMARCA1 SWI/SNF-related, matrix-associated, actin-dependent regulator of chromatin, subfamily a, member 1; TGF-β transforming growth factor β; TGF-βR1 TGF-β recep-tor 1; and TGF-βR2 TGF-β receprecep-tor 2.
The New England Journal of Medicine
Downloaded from nejm.org at UW-Madison on September 10, 2014. For personal use only. No other uses without permission. Copyright © 2014 Massachusetts Medical Society. All rights reserved.
17 changes are reported in pancreatic acinar cells that undergo acinar-ductal transdifferentiation. (Sphyris and Harrison, 2005)
Figure 8. Tetraplodization in Pancreatic Adenocarcinoma. Upper panel, Distibution of chromosome numbers in Pancreatic Adenocarcinomas. Lower panel, a representative karyotype of a pancreatic cancer is reported. (Adapted from Davoli and de Lange, 2011)
CB27CH23-deLange ARI 5 September 2011 12:18
two unprotected chromosome ends can form a dicentric chromosome, which tends to un-dergo nondisjunction and/or break in mitosis. A unique feature of this source of chromosome instability is that it is episodic, ultimately re-sulting in aneuploid cancer genomes that sta-bilize once telomerase has restored telomere function. In this regard, it will be of interest to understand which cancers show ongoing CIN and which have a stable aneuploid chromosome complement.
EVIDENCE FOR
TETRAPLOIDIZATION IN HUMAN CANCER
The CIN type of chromosome missegrega-tion does not, however, explain cancers with a triploid or near-tetraploid chromosome num-ber (Figure 3; Table 1). At the missegregation rate of approximately one per five cell divisions observed in colorectal cancer cell lines, more than 150 population doublings (PD) would be required to generate a clone with close to
5 10 15 20 25 30 35 Number of chromosomes Number of tumors a Pancreatic carcinoma c b Osteosarcoma d Number of chromosomes <41 41−4546−5051−5556−6061−6566−7071−7576−8081−8586−90 >90 5 10 15 20 25 30 45 45 40 40 35 Number of tumors <41 41−4546−5051−5556−6061−6566−7071−7576−8081−8586−9091−95 >95 1 2 3 4 5 6 7 8 9 10 11 12 13 14 15 16 17 18 19 20 21 22 X Y 1 2 3 4 5 6 7 8 9 10 11 12 13 14 15 16 17 18 19 20 21 22 X Y
~Diploid ~Triploid ~Tetraploid ~Diploid ~Triploid ~Tetraploid
Figure 3
Evidence for tetraploidization in cancer. The bar graphs show the distribution of chromosome numbers in (a) pancreatic carcinoma and (b) osteosarcoma. The data were derived from the Mitelman database (http://cgap.nci.nih.gov/Chromosomes/Mitelman). The karyotypes of all the pancreatic carcinoma and osteosarcoma tumors in the database were retrieved and used to create the frequency distribution shown. For monoclonal tumors, the average number of chromosomes is given (e.g., a tumor with 47–53 chromosomes was scored as having 50 chromosomes). For multiclonal tumors, if the difference between the chromosome numbers of the clones was less than 10, the average is given. Otherwise, the two distinct clones were considered as two different karyotypes. (c) Representative karyotype of pancreatic cancer fromhttp://www.path.cam.ac.uk/∼pawefish/index.html(Capan-2 cell line). (d ) Representative karyotype of an osteosarcoma tumor from Scheel et al. (2001). Abbreviations: Cdk, cyclin-dependent kinase; Cyc, cyclin.
592 Davoli
·
de LangeAnnu. Rev. Cell Dev. Biol. 2011.27:585-610. Downloaded from www.annualreviews.org
Access provided by Universita degli Studi di Roma La Sapienza on 03/12/15. For personal use only.
CB27CH23-deLange ARI 5 September 2011 12:18
two unprotected chromosome ends can form a dicentric chromosome, which tends to un-dergo nondisjunction and/or break in mitosis. A unique feature of this source of chromosome instability is that it is episodic, ultimately re-sulting in aneuploid cancer genomes that sta-bilize once telomerase has restored telomere function. In this regard, it will be of interest to understand which cancers show ongoing CIN and which have a stable aneuploid chromosome complement.
EVIDENCE FOR
TETRAPLOIDIZATION IN HUMAN CANCER
The CIN type of chromosome missegrega-tion does not, however, explain cancers with a triploid or near-tetraploid chromosome num-ber (Figure 3; Table 1). At the missegregation rate of approximately one per five cell divisions observed in colorectal cancer cell lines, more than 150 population doublings (PD) would be required to generate a clone with close to
5 10 15 20 25 30 35 Number of chromosomes Number of tumors a Pancreatic carcinoma c b Osteosarcoma d Number of chromosomes <41 41−4546−5051−5556−6061−6566−7071−7576−8081−8586−90 >90 5 10 15 20 25 30 45 45 40 40 35 Number of tumors <41 41−4546−5051−5556−6061−6566−7071−7576−8081−8586−9091−95 >95 1 2 3 4 5 6 7 8 9 10 11 12 13 14 15 16 17 18 19 20 21 22 X Y 1 2 3 4 5 6 7 8 9 10 11 12 13 14 15 16 17 18 19 20 21 22 X Y
~Diploid ~Triploid ~Tetraploid ~Diploid ~Triploid ~Tetraploid
Figure 3
Evidence for tetraploidization in cancer. The bar graphs show the distribution of chromosome numbers in (a) pancreatic carcinoma and (b) osteosarcoma. The data were derived from the Mitelman database (http://cgap.nci.nih.gov/Chromosomes/Mitelman). The karyotypes of all the pancreatic carcinoma and osteosarcoma tumors in the database were retrieved and used to create the frequency distribution shown. For monoclonal tumors, the average number of chromosomes is given (e.g., a tumor with 47–53 chromosomes was scored as having 50 chromosomes). For multiclonal tumors, if the difference between the chromosome numbers of the clones was less than 10, the average is given. Otherwise, the two distinct clones were considered as two different karyotypes. (c) Representative karyotype of pancreatic cancer fromhttp://www.path.cam.ac.uk/∼pawefish/index.html(Capan-2 cell line). (d ) Representative karyotype of an osteosarcoma tumor from Scheel et al. (2001). Abbreviations: Cdk, cyclin-dependent kinase; Cyc, cyclin.
592 Davoli
·
de LangeAnnu. Rev. Cell Dev. Biol. 2011.27:585-610. Downloaded from www.annualreviews.org
18
AIM
HIPK2 has been proposed as oncosuppressor for its proapoptotic functions in response to genotoxic stress (D’orazi et al., 2012). Recently a new role of HIPK2 in cytokinesis has been proposed. In particular it has been demostrated that Hipk2-null or interferred cells fail abscission, the last phase of cytokinesis, generating binucleated tetraploid cells (Rinaldo et al., 2012).
Since tetraploidy may lead to aneuploidy and chromosomal instability we asked whether the consequences of cytokinesis defects derived by HIPK2 absence could affect tumor formation and/or progression. To answer this question, we evaluated chromosomal instability and tumorigenicity of littermate-paired MEFs, derived by Hipk2+/+ and -/- mice, both in normal primary context and E1A/Ras transformed context. We performed in vitro and in vivo experiments, such as metaphase spread karyotyping to assess chromosomal instability, population doublings and BrdU assay to assess proliferation, and tumorigenicity assay in soft agar and in nude mice.
To further investigate on HIPK2 oncosuppressive functions, we analyzed a human tumor in which cytokinesis defects and tetraploidy-mediated CIN are considered key events in its formation/progression, such as the pancreatic ductal adenocarcinoma. In particular, we obtained tissue microarrays containing normal tissues and different stages of pancreatic ductal adenocarcinoma, and we evaluated HIPK2 levels and ploidy status by immunohistochemestry.
The purpose of this thesis is to show a new oncosuppressive function of HIPK2 and strenghten the concept of tetraploidization as unstable intermediate state in tumorigenicity. In that case HIPK2 could assure the genome integrity both activating its proapoptotic functions after DNA damage, and partecipating in cell division to determine the correct ploidy of daugther cells.
19
RESULTS
Hipk2 absence cause aneuploidy and CIN but do not promote transformation
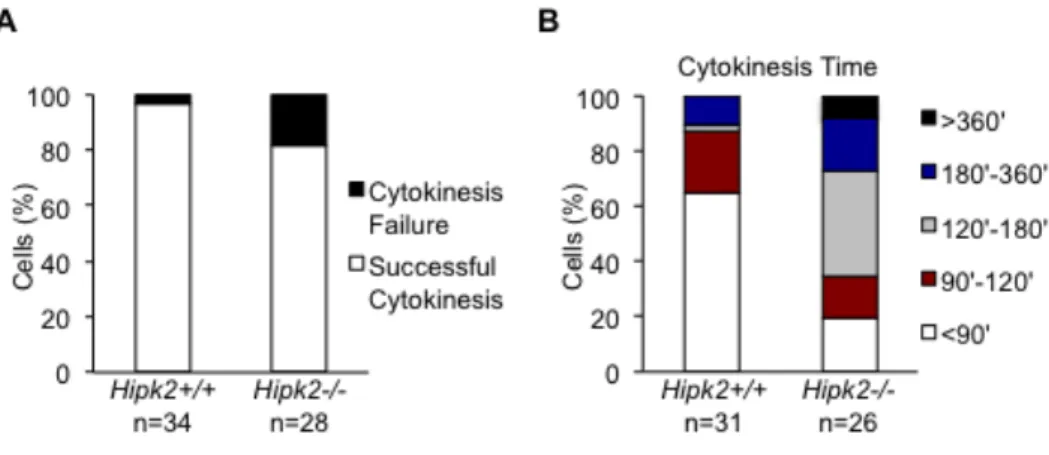
Rinaldo and coworkers have demonstrated that HIPK2 absence causes cytokinesis failure and tetraploidization in human and mouse cells (Rinaldo et al., 2012). We observed that primary Hipk2-/- MEFs have significant longer cytokinesis time and higher percentage of cytokinesis failure compared to primary Hipk2+/+ MEFs by live-cell imaging, showing that cytokinesis failure occurs in the absence of Hipk2 in these cells (Figure 9).
Figure 9. Primary Hipk2-/- MEFs show cytokinesis failure and longer cytokinesis time than primary Hipk2+/+ MEFs. A-B, Asynchronous primary MEFs were analyzed by phase microscopy live-cell imaging at passage 4 after explantation. The percentage of mononucleated cells with the indicated outcome is reported in A. The length of cytokinesis calculated from cleavage furrow ingression is reported in B.
Based on these observations, we asked whether the cytokinesis failure lead to CIN in these primary MEFs. Thus, we performed chromosomal counts of colcemid-arrested metaphase spreads of these cells at different passages in culture. As expected, primary Hipk2+/+ MEFs showed a very stable diploid karyotype (<1% tetraploid cells at p3) with the appearance of a few tetraploid cells at later passages (!7% tetraploid cells at p6) (Figure 10A). In contrast, Hipk2-/- MEFs showed a high percentage of cells with tetraploid and near-tetraploid karyotype from the early passages (!25% tetraploid/near-tetraploid cells at p3) that further increased at later passages (!45% tetraploid/near-tetraploid cells at p6) (Figure 10A).
Next, we evaluated whether aneuploidy and CIN are sufficient to induce transformation in primary MEFs. We first compared population doublings and spontaneous immortalization
20 in primary Hipk2+/+ and -/- MEFs by routinely passaging the cells by the 3T3 protocol. As expected, Hipk2+/+ MEFs proliferate and, after a crisis, resume proliferation (Figures 10C-D), becoming immortal. In contrast, primary Hipk2-/- MEFs, after the first passages in which accumulate karyotype defects (Figure 10A), stop proliferating and do not spontaneously immortalize (Figures 10C-D). This different behavior was reproducibly seen in littermate-paired MEFs derived from three independent litters and was confirmed by bromodeoxyuridine (BrdU) incorporation analyses (Figure 10E).
To evaluate whether the Hipk2-/- MEFs stop proliferating because of a tetraploid G1 arrest induced by tumor suppressive mechanism such as p53 activation (Thompson et al., 2010), we analyzed the effect of hipk2 absence in p53-null background. We observed that Hipk2-/- Tp53-Hipk2-/- MEFs, despite the presence of CIN, proliferate and spontaneously immortalize, as well as Hipk2+/+ Tp53-/- MEFs, suggesting that p53 inactivation leads to the acquisition of tolerance to the CIN induced by hipk2 absence (Figures 10B-D).
Overall, these observations indicate that hipk2 absence leads to tetraploidy associated with aneuploidy and CIN in primary MEFs and suggest that these events, despite an initial proliferation of tetraploid/near-tetraploid cells, inhibit rather than facilitate tumor promotion.
21 Figure 10. CIN and proliferation in primary MEFs. A.The percentage of metaphases with the indicated chromosome number is shown. B, p53 and Hipk2 mRNA levels of indicated MEFs were analyzed by quantitative real time RT-PCR as control. Relative fold-enrichments were determined by the 2-∆∆Ct method, using Actin as normalizer, and data are represented as mean ± Standard Deviation (SD). C, Doublings of indicated MEFs were scored and a representative curve is shown. Data are presented as mean ± SD. D, Representative bright-fields of indicated MEFs are shown, scale bar, 50 µm. E, MEFs proliferative activity was evaluated as the percentage of BrdU incorporation. BrdU positivity was measured at the indicated p and data presented as mean ± SD; (* P= 0.037 at p7 and P= 0,012 at p8, Student t test) NS, not significant.
22 In agreement with these findings, we observed that hipk2 absence is not sufficient to trigger transformation of primary MEFs by expressing a single oncogene, such as Ras or E1A (Figure 11).
Figure 11. Some E1A- or Ras-expressing colonies were obtained by stably transfecting E1A- or Ras- expressing vectors, however these colonies could not be fully established. Primary Hipk2+/+ and -/- MEFs, at passage 3 after explantation, were stably transfected with the indicated vectors. Number of colonies obtained after 10 days of selection were counted. No colonies were obtained by transfecting empty control vectors. The experiments were performed in triplicate and data are represented as mean ± SD (left); No significant differences between Hipk2+/+ and -/- populations were observed. Representative crystal-violet stained plates are shown, right. E1A- and Ras-expressing single cell-derived clones or stable polyclonal populations could not be established. Primary MEFs require the presence of two cooperating oncogenes such as adenoviral E1A along with Ras for transformation (Land et al., 1983). The expression of a single oncogene is not sufficient for Hipk2 null MEFs transformation.
Furthermore we observed that Hipk2-/- Tp53-/- MEFs, such as Hipk2+/+ Tp53-/- MEFs, do not show anchorage-independent growth capability, suggesting that hipk2 absence is not sufficient to induce transformation even in primary MEFs lacking p53 (data not shown).
23 E1A/Ras-transformed Hipk2-/- MEFs show higher rates of cytokinesis failure than E1A/Ras Hipk2+/+ MEFs
Next, to evaluate the consequence derived by cytokinesis failure and tetraploidization due to hipk2 absence in a carcinogenic context, we transformed early-passage primary Hipk2+/+ and -/- MEFs, by stably expressing the E1A and Harvey-Ras oncogenes. The expression levels of the two oncogenes and the Hipk2 mRNA levels were assessed on single-cell clones (Figure 12A) and polyclonal populations (Figure 12B) stably expressing E1A and Ras (E1A/Ras MEFs).
Figure 12. E1A/Ras stable trasfection in Hipk2+/+ and -/- MEFs. A-B, Total Cell Extracts (TCE) from stable E1A/Ras expressing clones (A) and polyclonal populations (B) were analyzed by WB and by real-time RT-pcr. Representative WB for indicated proteins are shown (A-B, upper panels). Hipk2 mRNA relative fold-enrichments were determined by the 2-∆∆Ct method, using Actin as normalizer, and representative graphs are shown (A-B lower panels); data are represented as mean ± SD. Und, undeterminable since no specific Hipk2 mRNA amplification occurs, as expected in hipk2 null cells.
An initial characterization of these cells showed that, relative to their transfection efficiency, that was consistently 11% for the Hipk2+/+ and 8% for the Hipk2-/- MEFs, the Hipk2-/- MEFs yield a reproducible higher number of E1A/Ras-expressing colonies compared with the Hipk2+/+ counterparts (Figure 13), suggesting that hipk2 absence might facilitate transformation, at least in these conditions. To note, Hipk2+/+ MEFs do not show significative difference in HIPK2 transcriptional level after E1A and Ras oncogenes induction (Figure 12B, lower panel).
24 Figure 13. Hipk2+/+ and Hipk2-/- colonies after E1A and Ras trasfection. Colonies number obtained after selection were counted. The experiments were performed in quadruplicate and data relative to transfection efficiency are represented as mean ± SD, left; (* P<0.05, Student t test). Representative plates are shown, right.
Next, we verified whether Hipk2 absence leads to cytokinesis failure in the transformed MEFs, as we previously observed in other conditions (Rinaldo et al., 2012). Polyclonal populations of E1A/Ras Hipk2+/+ and -/- MEFs were followed during their progression through cell division by live-cell imaging. The cells were monitored by phase microscopy and the length of cytokinesis was calculated from cleavage furrow ingression. E1A/Ras Hipk2+/+ MEFs underwent an apparently normal cytokinesis in 78.3 ± 36.5 min (n=55), whereas E1A/Ras Hipk2-/- MEFs took significantly longer to complete this process (133.7 ± 101.8 min; n=49). In contrast, the time that cells spent in mitosis before anaphase and anaphase duration were not remarkably different between E1A/Ras Hipk2+/+ and -/- MEFs (data not shown). Besides the increased lenght in cytokinesis, E1A/Ras Hipk2-/- MEFs displayed marked difficulties in completing cell division, with cells remaining interconnected by intracellular bridges for a long time and with a high percentage of cells that fail cytokinesis (Figures 14A-B). Strikingly, 31% of E1A/Ras Hipk2-/- MEFs failed cytokinesis ending up as binucleated cells (Figure 14A). Furthermore, we observed that these binucleated cells might enter an unhindered mitosis and produce vital progeny (n=8; Figure 14E).
25 Figure 14. E1A/Ras Hipk2/ MEFs show cytokinesis defects. AE, Asynchronous E1A/Ras Hipk2+/+ and -/- MEFs time lapse video analysis. A, The percentage of cells with the indicated outcome is reported. B, Cytokinesis time was evaluated for each cell successfully completing the cell division and the percentage of cells with the indicated cytokinesis time is reported. C-E, Representative still images of time lapse videos are shown with indicated time after cleavage furrow ingression in C, D, and E, respectively. Scale bar, 10µm.
26 Cytokinesis failure of E1A/Ras Hipk2-/- MEFs leads to aneuploidy and CIN
To investigate the occurrence of CIN after HIPK2-dependent cytokinesis failure, we measured the frequency of binucleated cells that accumulate during the passages of asynchronously growing MEFs. The morphological evaluation of adherent MEFs was assessed after tubulin immunostaining (Figure 15A). A higher frequency of binucleated cells was observed in the E1A/Ras Hipk2-/- MEFs compared with the Hipk2+/+ counterparts at early passage after stable transfections. The fraction of binucleated cells increased with passages only in E1A/Ras Hipk2-/- MEFs, suggesting that a process of CIN was present after cytokinesis failure due to the hipk2 absence (Figure 15A). At late passages after stable transfection, we also analyzed DNA content of the E1A/Ras MEFs by cytofluorimetric analysis. A strong reduction of the diploid population with a shift towards cells with a double DNA content and a broad population of cells with DNA content >4N, rather than the appearance of a distinct peak of 8N cells, suggest the occurrence of near-tetraploid cells in the E1A/Ras Hipk2-/- MEFs (Figure 15B).
To confirm that E1A/Ras MEFs become aneuploid rather than remain tetraploid, we analyzed their karyotypes by chromosomal counts of colcemid-arrested metaphase spreads (Figures 15C-D). E1A and Ras oncogenes are able to induce CIN (Woo et al., 2004) and in agreement, we detected the presence of tetraploid and near-tetraploid karyotypes (80 ± few chromosomes) in both E1A/Ras Hipk2+/+ and -/- MEFs. However, early passage E1A/Ras Hipk2-/- MEFs showed a significant larger accumulation of tetraploid/near tetraploid karyotypes than the Hipk2+/+ counterparts (Figure 15C). At later passages, the majority of mitoses in the E1A/Ras Hipk2-/- MEFs were near tetraploid and a wide distribution of chromosome numbers in the 4N-8N interval was observed, indicative of an ongoing CIN process (Figure 15C). These findings demonstrate the occurrence of CIN by hipk2 deficiency and clearly indicate that oncogene-induced CIN is strongly exacerbated by hipk2 absence. Comparable results were obtained by examining the karyotype of five single-cell clones and three independent polyclonal populations of Hipk2+/+ and -/- MEFs stably-expressing E1A/Ras, indicating that CIN is a specific effect due to HIPK2 status and not to any potential effect deriving from differential E1A/Ras expression in the analyzed populations (data not shown). Further signs of increased karyotype defects in the E1A/Ras Hipk2-/- MEFs were obtained by analyzing the percentage of micronucleated cells (5 ± 0.8% in Hipk2-/- MEFs versus 1 ± 0.9% in Hipk2+/+ MEFs), a sign of CIN
27 (Nicholson et al., 2012) and by measuring the size of nuclear areas (Figure 15E), a parameter that correlate with ploidy (Senovilla et al., 2012)
Figure 15. CIN and aneuploidy in E1A/Ras MEFs. A, Cells were fixed at indicated passages (p) after stable transfection, stained with Hoechst and anti-Tubulin to identify the nuclei and the cytoplasm, respectively. About 1,000 cells per sample were scored for the presence of one or two nuclei/cell and the data are represented as mean ± SD (*P <0.05, Student t test). B, DNA content analysis. Dashed lines outline 2N and 4N DNA content. C, The percentage of metaphases with the indicated chromosome number is shown; at least 65 metaphases were analyzed for each sample. D, Representative images of Hoechst-stained metaphase spreads of indicated MEFs are shown; scale bar, 10 µm. E, Nuclear area of indicated cells stained with anti-beta-Tubulin-Cy3 (red) and Hoechst (blue) was measured and reported as mean ± SD; for each case 400 nuclei were measured and P value for the Student t test is shown (left). Representative immunostainings of indicated MEFs are shown (right); scale bar, 10µm.
28 Moreover, we analyzed also the karyotype of human tumor HeLa cells undergoing cytokinesis failure after HIPK2 transient depletion. Accordingly to near-tetraploidization observed in Hipk2-/- MEFs, we observed an increase of the metaphases with near-double chromosome number also in human HeLa HIPK2-depleted cells compared to control cells (Figure 16A-C).
Altogether, these data show that Hipk2 absence leads to accumulation of aneuploidy and CIN.
Figure 16. Cytokinesis defects and aneuploidy in Hipk2-interfered HeLa cells. A-C, HeLa cells were transfected with 40nM of HIPK2 specific stealth siRNA mix (HIPK2i) or universal negative control stealth siRNA mix (CTRi) and analyzed 5 days after transfection. HIPK2 protein levels by WB are shown in A, cytokinesis outcome was monitored by time lapse microscopy and reported in B. The percentage of metaphases with the indicated chromosome number range is shown in C.
29 E1A/Ras Hipk2-/- MEFs are markedly more tumorigenic than E1A/Ras Hipk2+/+ MEFs and generate highly aneuploid tumors in vivo
To further characterize the phenotype produced by hipk2 absence, we evaluated the tumorigenicity of E1A/Ras Hipk2+/+ and -/- MEFs in vitro and in vivo. First, we examined the anchorage-independent growth capability by soft agar colony formation assay. We observed that E1A/Ras Hipk2-/- MEFs formed more colonies than E1A/Ras Hipk2+/+ MEFs and that these colonies were characterized by larger dimensions (Figure 17A).
Next, we compared the in vivo tumorigenicity of E1A/Ras MEFs by testing their ability in forming tumors in immunocompromised mice. When injected subcutaneously into nude mice (n=5), E1A/Ras Hipk2-/- MEFs (2x10⁶) produced rapid and aggressive tumors in all animals within 5 days (Figure 17B and Table 2). In contrast, the same number of E1A/Ras Hipk2+/+ MEFs was not able to produce detectable tumors during five months of observation. In order to determine the tumorigenic potential of E1A/Ras MEFs more accurately, serial dilution injections were performed. As shown in Table 2, as little as 1x10⁴ E1A/Ras Hipk2-/- MEFs were still able to induce tumors in 1 out of 3 mice in a short period of time (13 days). In contrast, at least 2x10⁷ E1A/Ras Hipk2+/+ MEFs were required to induce tumors in mice after subcutaneous injection. These findings clearly indicate that E1A/Ras Hipk2-/- MEFs are markedly more tumorigenic than their hipk2 proficient counterpart.
Figure 17. E1A/Ras MEFs tumorigenicity. A, Anchorage-independent growth of indicated MEFs was analyzed. The number of colonies obtained by seeding 3 × 10⁴ cells at p2 after stable transfection are presented as mean ± SD. (*P <0.05, Student t test). Representative bright-fields of 10 days colonies are shown, right; scale bar, 200 µm. B, Kaplan-Meier tumor free curve is reported for indicated cells concentration. n= mouse number.
30
E1A/Ras Hipk2+/+ E1A/Ras Hipk2-/-
Injected cell
number 2x10
6 5x10⁶ 1x10⁷ 2x10⁷ 1x10³ 1x10⁴ 5x10⁵ 2x10⁶
Tumor incidence 0/5 0/5 0/5 3/3 0/3 1/3 3/5 5/5
Tumor
appearance n.a. n.a. n.a. 7 n.a. 13 5 5
Table 2. Tumorigenic potential of indicated MEFs in vivo. Tumor incidence is reported as tumor bearing mice/ number of injected mice. Tumor appearance is reported as days post injection. n.a., not applicable. Impairment of HIPK2 provokes resistance to UV- or doxorubicin-induced cell death and this phenotype is believed to contribute to tumorigenicity (Rinaldo et al., 2007; Lazzari et al., 2011) Indeed, our E1A/Ras Hipk2-/- MEFs are more resistant than their Hipk2+/+ counterpart to doxorubicin-induced cell death (Figure 18).
Figure 18. E1A/Ras MEFs Hipk2-/- show higher resistance to doxorubicin treatment. A-B, Indicated MEFs were treated with 1 µM doxorubicin (Sigma). Cell viability was assessed by using ADAM-MC automatic cell counting system (Bio Digital) in A and by trypan blue exclusion in B 24h after treatment. CTR, control untreated cells; DOX, doxorubicin-treated cells. P values for the Student t test are shown.
Thus, in order to assess whether the aneuploidy and CIN we observed in the E1A/Ras Hipk2-/- MEFs also contribute to the high tumorigenicity of these cells, we made use of two different experimental approaches.
First, we took advantage of a phosphomimetic histone H2B-S14D mutant that, at variance from wild-type H2B, can rescue the cytokinesis failure, in the HIPK2-defective cells
31 (Rinaldo et al., 2012). Thus, Hipk2-/- primary MEFs were stably transfected with the E1A and Ras oncogenes in combination with wild-type H2B or H2B-S14D (Figure 19A). As expected, only the phosphomimetic H2B-S14D mutant was able to rescue the cytokinesis defects (Figure 19B-C) When analyzed for the anchorage-independent growth capability, the E1A/Ras Hipk2-/- MEFs expressing H2B-S14D showed a strong significant reduction of colony formation compared to E1A/Ras Hipk2-/- MEFs expressing wild-type H2B (Figure 19D), supporting the idea that cytokinesis failure contribute, at least in part, to the tumorigenicity of the E1A/Ras Hipk2-/- MEFs.
Figure 19. Phosphomimetic H2BS14D expression rescue cytokinesis failure and reduce in vitro tumorigenicity of E1A/Ras Hipk2-/- cells. A-D, primary Hipk2-/- MEFs were stably transfected at passage 3 after explantation with E1A and Ras expression vectors in combination with a vector expressing GFP-H2B or GFP-H2B-S14D. A, TCEs from stable polyclonal populations were analyzed by WB to verify expression levels of exogenous proteins by using indicated Abs. ACTIN expression was used as loading control. B-C, Asynchronous polyclonal populations were analyzed at passage 2 after stable transfection by live-cell imaging as in the Figure 1 D-E. The percentage of mononucleated cells with the indicated outcome is reported in B. Cytokinesis time was evaluated for each mononucleated cell successfully completing the cell division and the percentage of cells with the indicated cytokinesis time is reported in C. D, Anchorage-independent growth was analyzed. The soft-agar colony number obtained by seeding 3 × 10⁴ cells at passage 2 after stable transfection are presented as mean ± SD (*P <0.05, Student t test).
32 Since only 31% of the E1A/Ras Hipk2-/- MEFs undergo cytokinesis failure (Figure 14A), we reasoned that if aneuploidy and CIN do not significantly contribute to the tumorigenicity of these MEFs, the karyotype-defective cells would have been counter selected in favor of the cells that succeed in faithful cytokinesis. To experimentally assess this idea, we examined the tumors formed by E1A/Ras Hipk2+/+ and -/- MEFs in vivo. Mice were sacrificed and the explanted tumors were processed for histochemical analyses and in vitro cell culture. Morphological evaluation of Hematoxylin Eosine (HE)-stained tumor slides showed that both E1A/Ras Hipk2+/+ and -/- MEF-derived tumors were highly malignant sarcomas (Figure 20A). However, when the size of nuclear areas was quantified on a subset of randomly selected tumor regions by using morphometric software, we found that the mean nuclear area of mononucleated Hipk2-/- tumor cells was significantly higher than that of Hipk2+/+ tumor cells (Figure 20B-C). Comparable results were obtained by measuring the mean nuclear area and the mean length of the major nuclear axis by using the Image J software. Together, these data suggest that Hipk2-/- tumor cells have a higher DNA content than the Hipk2+/+ counterpart, supporting the occurrence of an increased ploidy in the absence of hipk2.
To further measure the degree of aneuploidy of the E1A/Ras Hipk2+/+ and -/- MEF-derived tumors, we generated cell lines from the tumors morphometrically analyzed above. Chromosome counts of metaphase spreads showed a clear prevalence of near-tetraploid karyotypes in the E1A/Ras Hipk2-/- tumors at opposite with Hipk2+/+ tumor cells, that were mostly in the diploid range (Figure 20D), suggesting that aneuploid cells are not counter-selected in vivo, during tumor formation. Indeed, by comparing the percentages of near-tetraploid metaphases of the E1A/Ras Hipk2-/- MEFs before and after in vivo passage (compare results in Figures 15C and 20D), an increase of cells with altered karyotype is detectable upon in vivo tumor growth, indicating a pro-tumorigenic role for these alterations.
Altogether, these findings demonstrate that hipk2 absence strongly increases tumorigenicity of E1A/Ras-transformed MEFs and support the idea that aneuploidy and CIN contribute to aggressiveness of HIPK2 defective tumors.
33 Figure 20. A, Representative HE staining of indicated tumors; scale bar, 60 µm. B, Morphometrical evaluation of HE-stained sections from three different Hipk2+/+ and -/- tumors was performed. Nuclear area size distribution is reported in box plot graph (*P<0.001, Kruskal-Wallis non-parametric test) and the percentage of cells with the indicated nuclear area range is reported in C. Data are presented as mean ± SD (* P<0.05, Student t test). D, Metaphase karyotype distribution of indicated tumor-derived cells is shown; at least 90 metaphases were analyzed for each tumor.
34 Reduced HIPK2 expression correlates with high tumor and nuclear grade in pancreatic adenocarcinoma
To verify whether the relationship between hipk2 absence and CIN defined in MEFs can occur in human cancers, we evaluated the HIPK2 expression in tissue microarrays (TMAs) of pancreatic cancers in which tetraploidization due to cytokinesis failure precedes an aneuploid state characterized by high incidence of near-tetraploid karyotypes (Sato et al., 1999; Tanaka et al., 1984; Hruban et al., 2007; Maitra and Hruban 2008).
Immunohistochemical analyses were performed by using anti-HIPK2 specific antibody (Ab) (previously used in Iacovelli et al., 2009) in TMAs that included normal pancreatic tissue, PanIN-3, and invasive ductal adenocarcinomas (Piscuoglio et al., 2012). As shown in Figures 21A and 21B, we found that the percentage of HIPK2 positive cells, irrespective of the intensity of the staining, was significantly reduced in PanIN-3 and in pancreatic adenocarcinoma compared to normal tissue. It is worthy to note that we also observed a general decrease in the intensity of HIPK2 staining by comparing samples of normal versus PanIN-3 and PanIN-3 versus adenocarcinoma (Figure 19A and data not shown). A further analysis of the latter finding in the PanIN-3 samples highlighted a relationship between HIPK2 intensity and the shape and the size of nuclei. In particular, to quantify this aspect, cells were divided into high and low HIPK2 expressing cells and nuclei were analyzed by measuring the area and the length of the major axis. Binucleated cells were not considered for these analyses. We found a highly significant correlation between low expressing cells and ample, pleomorphic, nuclei and between high HIPK2-expressing cells and small, regularly shaped nuclei (Figure 21C and data not shown). A representative PanIN-3 image in which the black arrows indicate low HIPK2 expressing cells and the white arrows indicate high HIPK2 expressing cells is reported and 5X magnification of indicated cells is shown.
These results show, in pancreatic cancer, an association between HIPK2 reduction, and high tumor and nuclear grades. Although this association needs to be further investigated, it opens up to the possibility that HIPK2 reduction/inactivation might contribute to tetraploidization and CIN in this type of cancer.
35 Figure 21. HIPK2 expression during pancreatic malignant progression. A, Representative images of HIPK2 immunostaining in normal pancreas, PanIN-3, and adenocarcinoma samples. B, The percentage of HIPK2 positive cells observed in each indicated subset of samples is reported and P values for the Wilcoxon test are shown. C, Nuclear area size distribution of low and high HIPK2-expressing cells in PanIN-3 samples (n=12) was evaluated and reported; for each case 400 tumor nuclei were measured and P value for the Student t test is shown. Low and high HIPK2-expressing cells show 2.3 fold of difference in the intensity of the staining. A representative PanIN-3 image in which the black arrows indicate low HIPK2 expressing cells and the white arrows indicate high HIPK2 expressing cells is reported and 5X magnification of indicated cells is shown.
36 CONCLUSION
Unscheduled tetraploid cell proliferation can lead to CIN and ultimately to cancer (Fujiwara et al., 2005; Ganem et al., 2007; Ganem et al., 2009). The aim of this thesis was to investigate on the consequences of cytokinesis failure and tetraploidization caused by HIPK2 absence. We show that hipk2-null cell tetraploidy evolves rapidly in high levels of aneuploidy and CIN. As a consequence, we observed that accumulation of these defects antagonizes cell proliferation and spontaneous immortalization of primary MEFs whereas it associates with increased tumorigenicity in E1A/Ras transformed MEFs. (Figure 22)
Figure 22. Schematic representation of different outcome of Hipk2 absence in primary or transformed MEFs. The absence of Hipk2 determines cytokinesis failure and formation of binucleated tetraploid cells. Tetraploidization leads to growth arrest in a primary context, while in a trasformed context, i.e. E1A/Ras overexpressing MEFs, generates highly tumorigenic near-tetraploid cells.
Hipk2-null MEFs proliferation and immortalization can occur in the background of non functional p53 tumor suppressor protein, according to data showing that tetraploids expressing wild-type p53 fail to propagate (Fujiwara et al., 2005; Figure 8C). However, hipk2 absence does not induce transformation in a p53-null context in our experimental