1
Università Sapienza Di Roma
Department of Astronautics, Electrical and Energy engineering
Doctor of philosophy in
Energy and Environment XXX cycle
Life cycle assessment of energy generation from agricultural
biomass via innovative energy conversion systems
Ph.D. thesis
Sara Rajabi Hamedani
Tutor: Prof. Vincenzo aso, Prof. Enrico Bocci
Ph.D. coordinator: Prof. Massimo Corcione
3
Abstract
The fundamental role that energy plays in all activities makes sustainability a crucial goal for the energy sector. Biomass is one of the most important parts of the energy sustainability sector due to the inevitability of biomass existence (linked to the existence of life), the interactions with other sectors (such as food, material, and human health), and the complexity of this source, which can be processed in many ways into different energy intermediates and final uses (heat, electricity, and transport fuels). Biomass can even help reduce oil dependency and global warming. However, it also has some undesirable impacts on ecosystems and the price of food commodities under direct and indirect land use change policies. One way to help minimize these impacts is to extend the range of feedstocks that can be used, particularly agricultural and forestry residues. However, a long-term successful bioenergy strategy must also take all sustainability issues into consideration.
Unlike all other renewable energy resources, biomass needs conversion steps to transform raw biomass into a variety of marketable intermediate chemical and energy products as solids, liquids, and gases. The diversity of biomass nature and conversion steps creates the need for specific technologies to be developed for each case.
Gasification and pyrolysis appear to be the most promising biomass conversion technologies, due to the fact that they, as highly versatile processes, can convert almost any biomass feedstock into syngas, bio-oil, and biochar with a very high carbon conversion and thermal efficiency. Furthermore, syngas and bio-oil are intermediate products that offer a large range of possible secondary conversion and final energy uses. Pyrolysis-based biochar application to the soil on a stable and carbon-rich substance can have substantial advantages from social, economic, and environmental points of view, leading to such outcomes as soil improvement, climate change mitigation, and bioenergy production, in addition to biochar production. Hydrogen from biomass is an attractive product, due to multiple applications in industrial market (chemical, refineries, metal processing, etc.), stationary power generation, and particularly in transport due to growing demand for zero-emission fuels and the implementation of fuel cell systems.
Although the environmental benefits of these products in the application have been substantiated, the sustainability of the entire chain, from the production to the end uses, remains unclear. In fact, it is still to be determined whether the production of hydrogen and biochar is economical and environmentally and socially feasible considering costs linked to environmental impacts of its production process. Furthermore, no link has yet been made between the environmental performance of these products from the above-mentioned processes and the achieved economic performance.
This study plans to assess the environmental burdens of the various stages of life cycle of hydrogen and biochar using life cycle assessment (LCA), a well-known technique for assessing the potential impacts associated with a product. In addition, the economic concept of shadow prices is applied to assign relative weights of socio-economic importance to the estimated life cycle impacts. This
4
novel integration of approaches complements the assessment of considered bioenergy systems with the inclusion of long-term global environmental impacts and the investigation of trade-offs between different environmental impacts through a single monetary unit.
This study also addresses the risk related to economies of scale for bio-hydrogen from small-scale gasification. With the exception of technologies for heating applications, most commercially available technologies generally suffer from poor economics at small scale. This is a particular problem because of the difficulty in supplying mainly lignocellulosic feedstocks to large plants due to insufficient resource availability, distribution, density, and logistics. Therefore, a techno-economic analysis was conducted on small-scale (100 kWth) system to identify system costs and find options to reduce production cost to the competitive rate in the market. The plant is mainly composed of a gasifier (double-bubbling fluidized bed reactor) coupled with a portable purification system (PPS: catalytic filter candles, water gas shift, and pressure swing absorption). The results show that hydrogen production cost is a function of hydrogen production efficiency and a PPS, which is a vital and high-cost unit in the system to provide purified hydrogen. Distributed hydrogen can be supplied at a competitive cost if the PPS unit cost falls by 50 percent and if the efficiency can rise by 50 percent (for example, increasing the steam-to-biomass ratio up to 1.5).
Regarding the environmental impacts, this plant has a significant advantage over conventional hydrogen production technology (steam methane reforming) in global warming impact -0.213 kg CO2eq vs. 0.1 kg CO2 eq – and a relatively high score of hydrogen renewability (75 percent). In particular, the application of byproduct to generate electricity considerably affects environmental performance and has positive impacts per 1 MJ H2 produced on global warming (kg CO2 eq), marine aquatic ecotoxicity (1.4-DB eq), and cumulative energy demand (MJ). On the contrary, the significant negative impact on abiotic depletion (MJ) and acidification kg SO2 eq comes from fertilizer application and consumption in the biomass production phase.
Weighing the impact assessment into the single monetary unit using three valuation methods indicates that the societal costs of biohydrogen production are higher than the societal benefits, with biomass cultivation being mostly responsible for these costs. This implies that modification in agri-food production management such as substituting chemical fertilizers with green fertilizer and policies to improve biomass supply chain can decrease environmental burdens, not only in its sector, but also in linked bioenergy systems.
The LCA has also been applied to a set of 50 vineyards. The results showed that the application and production of fertilizers are mainly responsible for all impact categories. After optimizing inputs by DEA, the on-orchard emissions had the greatest potential to reduce the environmental consequences in vineyards, which are connected to drops in manure and N fertilizer consumption. Furthermore, similar to the hydrogen production cycle, byproduct utilization (vineyard waste) by the installation of gasifiers could play a considerable role in improving the environmental performance of crops produced.
In biochar production and application in the soil, expected savings in CO2 emissions can be explained by the substituted amount of heat and electricity production from (bio-oil and syngas) and reduced fertilizer production, amongst other things, but the highest share in total CO2 savings is attributable to the application of biochar in soils. The difference in savings of CO2 emissions
5
can be explained by the different stable carbon content of the produced biochar. The biochar produced from willow can reduce GHG emissions more than pig manure biochar (2.2 t CO2 vs 0.98 t CO2 t-1 of biochar) because the stable carbon content of willow biochar is higher than the pig manure biochar.
The results of a monetary valuation of environmental impacts for biochar production from willow and pig manure reveal that biochar application in soil significantly increases environmental revenue related to global warming impact due to C sequestration and reduction in fertilizer consumption. Therefore, biochar production from willow is more environmentally favorable based on all valuation methods.
7
Contents
Chapter 1: Introduction to the study ... 11
1.1 Energy context ... 12
1-2 Technologies for a sustainable energy system ... 14
1-2-1 Types of biomass ... 14
1-2-2 Biomass conversion technologies ... 15
1.3 Gasification: technology and uses ... 16
1-3-1 Chemistry of the Process ... 16
1-3-2 Types of gasifiers ... 17
1-3-3 Cleaning synthesis gas... 21
1-3-4 Uses of synthesis gas ... 22
1.4 Pyrolysis: technology and uses ... 23
1.4.1 Chemistry of the process ... 23
1.4.2 Products of pyrolysis ... 24
1-4-3 Types of pyrolyser ... 25
Chapter 2: Objectives ... 27
Chapter 3: Methodology ... 30
3.1 Sustainable development... 31
3.2 Sustainability measurement tools... 32
3.2.1 Life cycle assessment ... 33
3.4.3 Shadow price for monetary weighting ... 39
3.3. Data Envelopment Analysis ... 41
Chapter 4: Application of methods for case studies... 42
4.1. Environmental techno-economic analysis of hydrogen production using biomass gasification -A small scale power plant study ... 43
4.1.1. Summary ... 43
4.1.2. Techno-economic analysis ... 43
4.1.3. Life Cycle Assessment ... 59
4.1.4 Conclusion ... 74
4.2. Societal techno-economic assessment of biochar production ... 75
4.2.1 Summary ... 75
4.2.2 Biochar Sustainability ... 75
8
4.2.3. Life cycle assessment ... 77
4.3.5 Conclusion ... 90
4.3. Eco-efficiency assessment of vineyards ... 92
4.3.2 Life cycle assessment ... 92
Chapter 5: General conclusions ... 114
9
Figure 1. Global primary energy consumption per energy source (adapted from [1]). ... 13
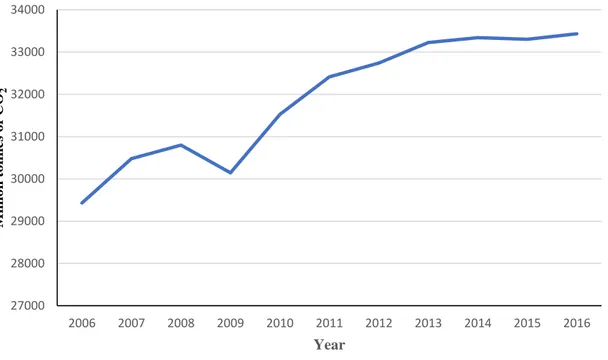
Figure 2. Global CO2 emission ... 13
Figure 3. Biomass conversion technologies ... 16
Figure 4. Fixed bed gasifier updraft (a), Fixed bed gasifier downdraft (b) ... 18
Figure 5. Bubbling fluidized bed gasifier (a), Circulating fluidized bed gasifier (b)... 19
Figure 6. Indirect Gas Gasifier. ... 20
Figure 7. Indirect fluidized bed gasifier ... 21
Figure 8. The three pillars of sustainability. ... 32
Figure 9. The phases of LCA ... 33
Figure 10. Flow diagram for life cycle inventory ... 35
Figure 11. Main steps in a DEA study ... 41
Figure 12. Flow sheet of the plant ... 45
Figure 13. Exploded view of the PPS showing main components ... 46
Figure 14. 100 kWth reactor ... 46
Figure 15. Picture of the 1 MWth plant realized in Trisaia . ... 47
Figure 16. Total cost distribution ... 56
Figure 17. The cost distribution under scenario B ... 57
Fig. 18. Life cycle boundaries for hydrogen production system. ... 59
Figure 19. Percent characterization of hydrogen production by environmental impact category (CML2 baseline). (system expansion) ... 67
Figure 20. Normalization of Hydrogen production by environmental impact category (CML2 baseline). (system expansion) ... 68
Figure 21. Hydrogen renewability for each technology ... 69
Figure 22. System boundaries for LCA of biochar(-based bioenergy production) production. ... 78
Figure 23. Normalized impact categories in each case. ... 83
Figure 24. Process contribution to the damage categories ... 85
Figure 25. Environmental benefits and costs of two biochar production systems ... 90
Figure 26. System boundaries for each vineyard in LCA + DEA. ... 93
Figure 27. Percent characterization of grape production by environmental impact category (CML2 baseline). ... 103
Figure 28. Normalization of environmental impact categories for grape production (CML2 baseline). .. 104
Figure 29. ChemCAD flowchart of the gasification system. ... 105
Figure 30. Percentage of reduction potential in agricultural inputs in ineffiecient farms s for 1 ton grape production. ... 108
Figure 31. Contribution of each phase of production to total impact factor ... 109
Figure 32. Contribution of each type of off-and on-orchard emissions to the environmental impact reductions ... 110
10
Table 1. Shadow prices used in different monetary valuation methods [76] ... 40
Table 2. Operating conditions of gasifier under two different S/B ... 48
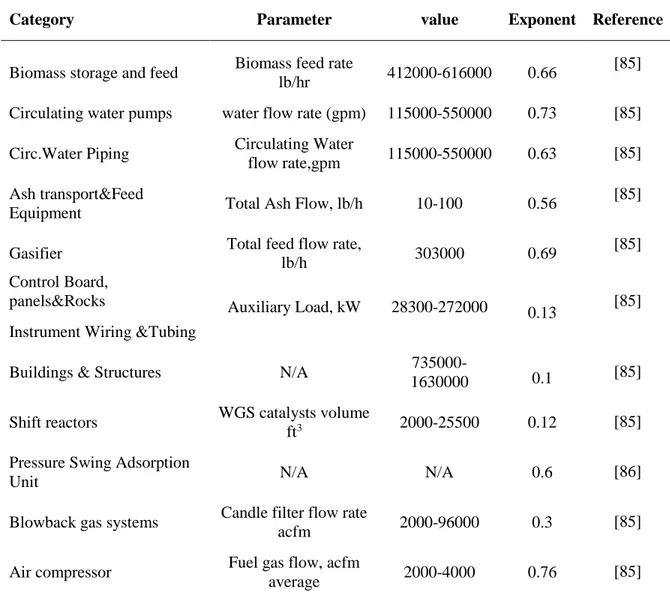
Table 3. Exponents employed for estimation ... 50
Table 4. PPS equipment cost ... 51
Table 4. PPS equipment cost based on scaling factor ... 51
Table 6. 1 MWth gasifier equipment cost ... 52
Table 7. 100 kWth gasifier equipment cost ... 53
Table 8. Costs factors for indirect costs ... 53
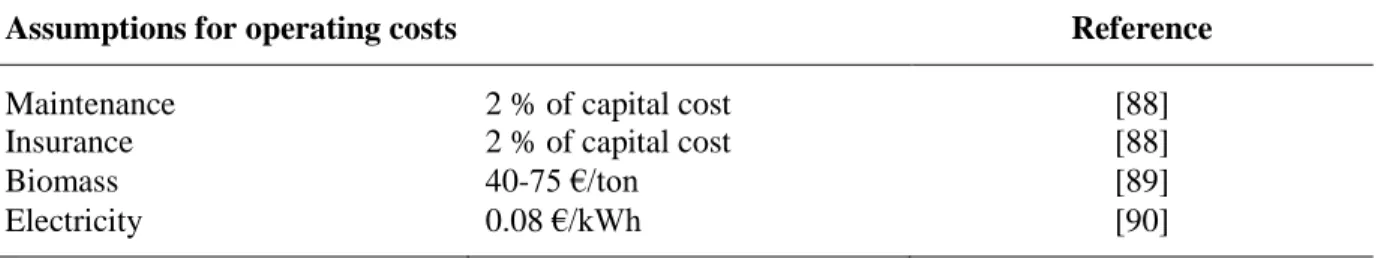
Table 9. Operating cost ... 54
Table 10. Total cost of plant ... 55
Table 10. Cost changes under scenario A, B ... 57
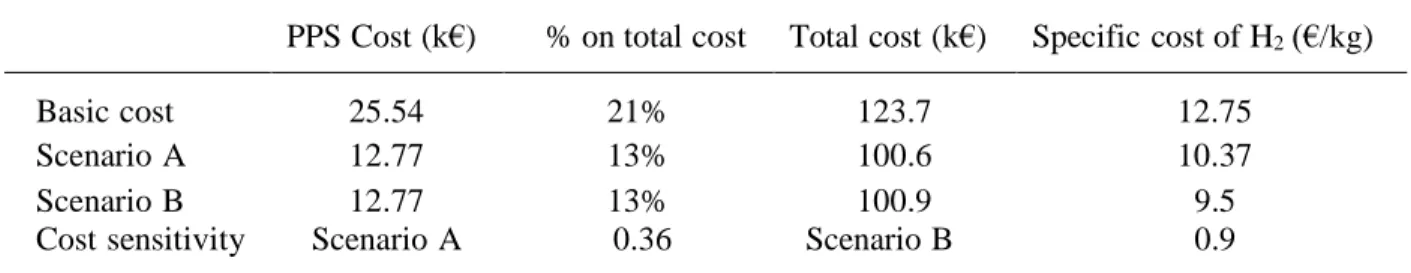
Table 12. Costs and cost sensitivity under scenario A and B ... 58
Table 13. Material and energy employed for catalysts production (100 KWth) ... 61
Table 14. Global inventory data (per 1 MJH2) for Subsystem 1 ... 63
Table 15. Main inventory data for hydrogen production via Almond shell gasification per FU ... 64
Table 16. Characterization results corresponding to the production of 1 MJH2. ... 66
Table 17. Sensitive analysis results for increase in hydrogen production environmnetal efficiency... 70
Table 18. Environmental valuation per 1 MJ H2 ... 72
Table 19. The inventory data for 1 ton biochar via willow pyrolysis ... 80
Table 20. The inventory data for 1 ton biochar via pig manure pyrolysis ... 81
Table 21. IMPACT2002+ mid-point results (per ton of biochar) ... 82
Table 22. IMPACT 2002+ endpoint results (per ton of biochar) ... 85
Table 23. CML characterization results (per ton of biochar) ... 86
Table 24. Environmental valuation per 1 ton biochar produced from Willow ... 88
Table 25. Environmental valuation per 1 ton biochar produced from Pig manure ... 89
Table 26. Coefficients for calculating the on-farm emissions related to application of inputs in grape production. ... 95
Table 27 . The inventory data for 1 ton grape produced ... 97
Table 28. DEA matrix for 50 vineyards. ... 99
Table 29. Characterization of grape production referred to the FU (1 ton of Grape) ... 103
Table 30. Operating conditions of gasifier ... 106
Table 31. Current and optimum ecoprofile indicators for grape production ... 109
11
12 1.1 Energy context
Since the Industrial Revolution, global demand for energy has been steadily increasing due to economic and social development. In fact, in the last twenty years, the global energy consumption has increased more than 50% [1]. Figure 1 shows the increase in primary energy consumption in recent years, and it can be seen that the majority consumption comes from fossil fuels (oil, coal and natural gas). Despite the growth of non-fossil energy sources such as nuclear energy and renewables, the contribution of these fuels to global energy demand has remained virtually constant over the last 40 years. In 2016, fossil fuels accounted for 85% of the world's primary energy consumption [1].
At present, there has been a significant increase in greenhouse gas (GHG) levels in the atmosphere, mainly CO2, in recent years Figure 2. In fact, in 2016 the CO2 concentration was approximately 88% higher than in the last decade [1]. Among human activities that generate GHG, approximately 90% of the emissions come from the energy sector due to the combustion of fossil fuels [2]. This situation has given rise to a growing interest in the study and development of new technologies for the production of energy that is sustainable from an environmental, economic and social point of view. In this regard, it is expected that renewable energy sources will play a major role in the future [3]. The frontlines for additional emissions reductions are in the power sector, via accelerated deployment of renewables and a robust clean energy research and development effort by governments and companies. In fact, nearly 60% of all new power generation capacity to 2040 comes from renewables and, by 2040, the majority of renewables-based generation is competitive without any subsidies.
13
Figure 1. Global primary energy consumption per energy source (adapted from [1]).
Figure 2. Global CO2 emission 27000 28000 29000 30000 31000 32000 33000 34000 2006 2007 2008 2009 2010 2011 2012 2013 2014 2015 2016 M illi o n to nn es o f CO 2 Year MTOE YEAR
14 1-2 Technologies for a sustainable energy system
Due to the environmental, economic and social issues discussed in the previous section, the use of renewable energies has grown considerably in recent years. In fact, there has been a steady increase in hydropower generation and a rapid expansion of wind and solar energy, which has made renewable energy an important part of the global energy system. A critical factor for the rapid increase of renewable energies is to achieve a significant reduction in technological costs, as they are currently not competitive with those associated with conventional systems [3]. This has been achieved, for example, in the case of photovoltaic panels. Moreover, there is a need for further technological innovation leading to more efficient and cleaner conversion of a more diverse range of feedstocks.
Among the different renewable resources, biomass is gaining great interest because it is the only renewable source of carbon that can be used for the production of fuels (liquid and gaseous) and chemicals [4]. In addition, it is considered a neutral carbon source because the CO2 emissions in the biomass transformation processes are partially offset by the CO2 previously fixed by the plants [4].
1-2-1 Types of biomass
According to ISO 16559: 2014, biomass is defined as any material of biological origin. Except those that have undergone mineralization processes such as those originating from oil, coal and natural gas [5]. The Biomass can be classified according to its composition in the following types [6,7]:
Sucorose biomass: It groups those materials with a high content of soluble sugars, both monosaccharides (glucose and fructose) and disaccharides (sucrose). Sugar cane and sugar beet are examples of this type of biomass.
Amylaceous biomass: This type of biomass has a high content of starch or inulin. Examples of this type of biomass are cereal grain and potato.
Oleaginous biomass: This kind of biomass has a high content of lipids, such as sunflower or rapeseed.
Lignocellulosic biomass: In this type of biomass the structural components of plants predominate. ie cellulose, hemicellulose and lignin. The cereal straw, forestry and agricultural residues and some energy crops, such as poplar and willow are examples of this type of biomass.
Depending on its origin, biomass can be classified as natural biomass (spontaneously generated in nature, without human intervention) and anthropogenic generated by human activities. The latter can be classified in the following sub-types:
Residual biomass: it includes forest residues from the forest and timber industry, agricultural residues (straw, pruning waste, etc). Livestock residues and the organic fraction of municipal waste and municipal waste water.
Energy crops: These are crops intended to produce biomass for energy rather than food purposes. These crops can be classified into oilseeds, alcohol and lignocellulosic.
15
In recent years, there has been a great interest in short rotation crops (poplar, willow, etc.) and residual biomass because they do not compete in the food market and can grow in small areas with low maintenance [8]. In addition, such crops can reduce external energy dependence. On top of all, residual biomass would significantly decline the potential pressure on land use, improve greenhouse gas emission reductions when compared to energy crops, and result in lower environmental and social risk [9].
1-2-2 Biomass conversion technologies
Biomass can be transformed into a wide variety of energy products of interest by means of thermochemical, biochemical or chemical conversion routes [10]. Figure 3 shows the main conversion processes, as well as the products obtained in each of them.
The thermochemical route can be considered one of the most interesting from the point of view of the great variety of products that can be obtained. In addition, by using lignocellulosic biomass, it avoids the problem of competition in the food market. This route is based on the decomposition of biomass at high temperature in order to obtain products of greater interest (electricity, heat, fuels and chemical compounds). It can be carried out through the following processes:
- Combustion is the most known thermochemical process. It is based on the exothermic chemical reaction produced between a fuel (in this case biomass) and oxygen (combustion agent) to give rise to gaseous products, called fumes or flue gases, and solid products that are formed by ash and unburned. The main objective of this process is the generation of heat or the generation of electricity through a Rankine cycle [11].
- Pyrolysis consists of the decomposition of the biomass by the action of heat and in the absence of an oxidizing medium. This process produces gases, liquid (bio-oil) and a carbonaceous substance (biochar). The generated quantities of each of these products depend on the operating conditions (heating rate, temperature, etc.) and the type of biomass used. Currently, the main interest of this process is the obtaining of bio-oils that can be used for the production of fuels with properties similar to those of gasoline and diesel [12]. In recent years, biochar based bioenergy production has absorbed a great interest due to its influence on carbon sequestration in soil. - Gasification is a process in which a carbonaceous substrate, in this case the biomass, is transformed into a combustible gas (synthesis gas) by controlled heating at high temperature in the presence of a gasifying agent (air, oxygen and / or steam ) [13]. The synthesis gas obtained presents a wide variety of energy applications, among which we can highlight the production of electricity / heat, the hydrogen production and the synthesis of fuels by the Fischer-Tropsch process [14]. - The roasting process consists of the thermal treatment of the biomass at moderate temperatures (200-300 ºC), in an environment lacking oxygen and at pressures close to the atmospheric. Through this treatment, the biomass loses water and volatile compounds (mainly CO2), resulting in a dry, hydrophobic product with higher energy density. In this way, roasted biomass presents more similar processes properties to those of fossil coal and, therefore, it is mainly used as pre-treatment for direct combustion and gasification [15].
In particular, gasification is considered to be one of the most promising technologies for the conversion of biomass since, in combustion, the heat generated must be used directly, both the synthesis gas obtained by gasification and the bio-oil produced in the pyrolysis can be used at any time for different applications. In addition, unlike bio-oil, which requires intense improvement
16
processes to be used, the synthesis gas is a combustible gas with a wide range of applications [16,17]. In this study, Pyrolysis with the main purpose of long-term carbon storage creation rather than production of raw material for energy generation has been considered.
Figure 3. Biomass conversion technologies
1.3 Gasification: technology and uses
1-3-1 Chemistry of the Process
The gasification of biomass consists in the biomass transformation into a combustible gas (synthesis gas) by its partial oxidation in the presence of a gasifying agent, which can be air, oxygen and / or steam [18]. This process takes place at high temperature, between 500 and 1,400 ºC, and can be divided into two stages [19]:
- Pyrolysis or devolatilization: at the entrance to the gasifier, the biomass undergoes a drying process when coming into contact with the gases present in the reactor. Then, thermal decomposition of the biomass occurs giving rise to hydrocarbon gases, liquid (called tars or tars) and a solid carbonous residue (commonly called char).
17
- Gasification: the products formed in the pyrolysis stage react with each other and with the gasifying agent. The gases produced in this stage react in turn between them, resulting in the final gas mixture, known as syngas.
The operating pressure varies from atmospheric pressure to 33 bar, depending on the scale of the plant and the final application of the synthesis gas [18]. Higher pressures lead to lower equipment sizes and higher efficiencies, but they mean an increase in complexity and maintenance costs. The main reactions that occur in a gasifier are the following:
𝐶 + 𝑂2 → 𝐶𝑂2 Eq. 1 𝐶 + 1 2𝑂2 → 𝐶𝑂 Eq. 2 𝐶 + 2𝐻2→ 𝐶𝐻4 Eq. 3 𝐶𝑂 + 𝐻2𝑂 ↔ 𝐻2+ 𝐶𝑂2 Eq. 4 𝐶𝑂 + 3𝐻2 ↔ 𝐶𝐻4+ 𝐻2𝑂 Eq. 5 𝐶 + 𝐻2𝑂 → 𝐶𝑂 + 𝐻2 Eq. 6 𝐶 + 𝐶𝑂2 → 2𝐶𝑂 Eq. 7
The product gas consists mainly of carbon monoxide, hydrogen, carbon dioxide, methane, water vapor and traces of other unwanted components such as tar [18]. The composition of syngas depends on various factors, such as the composition of the biomass, the gasification technology and the gasifier used. The most used gasifying agent is air because of its low cost. However, the nitrogen present in the air dilutes the produced synthesis gas making its calorific value low (4-7 MJ · Nm-3). In contrast, if gasification is carried out with oxygen and / or steam, the produced synthesis gas has a higher calorific value (10-18 MJ · Nm-3) [20].
Depending on how the required heat is supplied to the process, the gasification can be classified directly and indirectly. If the energy produced in the combustion and in the partial oxidation of the biomass is enough for the gasification to take place, the gasification is called direct or autothermic. Otherwise, the process requires an external heat input, it is called indirect or Allothermal gasification [21].
1-3-2 Types of gasifiers
Biomass gasification can be carried out in a wide variety of reactors. Fixed bed, fluidized bed and indirect gasifiers are mostly used. Although entrained bed gasifiers are a technology developed for coal gasification, this type of technology has not been considered in this section since, when used for biomass gasification, it presents a high processing cost due to small required particle size [18]. i) Fixed bed gasifier
These reactors can be classified as a function of the flow direction into the updraft and downdraft moving bed gasifier.
The updraft gasifiers, Figure 4-a are the simplest form of moving bed. The biomass is fed from the top while the gassing agent is injected through the bottom of the reactor. In this way, the
18
biomass descends through the bed by reacting with the upwardly moving gasifying agent. At the top of the reactor is the drying zone which dries biomass due to contact with the product gas before it leaves the reactor. Then, in the zone of pyrolysis, the thermal decomposition of the biomass generates volatile gases, char and tar. The gases generated ascend with the rest of the gases, dragging part of the formed tars. The char obtained in the pyrolysis continues to react with the gases generated and with the gasifying agent in the so-called gasification zone. In this area both gas and char are gasified to H2 and CO. Finally, the residual char continues to descend to the bottom of the gasifier (combustion zone) generating the necessary heat for reactions of the previous steps. The gas temperature varies from 500 °C at the gasifier outlet to 1,000 °C in the oxidation zone [12,19,20].
a) b)
Figure 4. Fixed bed gasifier updraft (a), Fixed bed gasifier downdraft (b)
The updraft gasifiers allow the use of biomass with a high moisture content (above 60%) and have a high thermal efficiency. However, the synthesis gas produced contains a high amount of tars, which makes intensive cleaning necessary before it can be used in engines or turbines, or in synthesis applications [18,19]. This type of gasifier has been used successfully in several countries, such as Finland and Sweden, since the mid-1980s. An example of this type of reactor is the Bioneer gasifier developed in Finland [22], which is used for cogeneration of heat and power (CHP: combined heat and power). However, precisely because of the high quantity of tars in the synthesis gas, these gasifiers are no longer under investigation.
In the downdraft gasifiers Figure 4-b the biomass and the gasification agent move in the same direction through the bed. As in the updraft gasifier, the biomass is fed from the top of the bed and, as it descends, it is heated and dried and pyrolyzed (drying and pyrolysis zones, respectively). Tars and char formed continue to descend to the oxidation zone where combustion occurs upon contact with the gasifying agent. These reactions are very exothermic and provide the necessary heat in the remaining areas. Finally, the residual char continues to fall and undergoes the reduction step when reacting with the flue gases, forming H2 and CO.
19
The synthesis gas obtained has a low tar content and therefore does not require such a thorough cleaning process. As main disadvantages, it is necessary to emphasize that it requires biomass fed with a low moisture content (<20%) and its thermal efficiency is low because the produced gas leaves the reactor at high temperature (900-1,000 ° C) and part of the heat generated is not used for the conversion of the biomass [18,23]. Although this type of gasifier has been well studied [24,25], the disadvantages discussed make it unattractive for future investigations [18].
ii) Fluidized bed gasifier
Fluidized bed gasifiers typically use a bed of an inert material (such as sand, olivine or alumina) to improve the fluid dynamics properties and heat transfer of the system. In these reactors, the biomass is fed into the bed and rapidly mixed with the inert material. Unlike fixed bed reactors, in this type of gasifier there are no differentiated zones for the different stages [26].The fluidized bed gasifiers can be bubbling or circulating bed and operate normally at temperatures between 700 and 900 ° C [13].
In the bubbling bed gasifiers Figure 5-a, the gasifying agent is injected through the bottom of the reactor at a rate close to the minimum fluidization rate. The advantage they present is that when air is used as a blowing agent, bubbling bed gasification is a relatively simple process for the production of synthesis gas. This has made this type of gasifier very attractive to study.
The circulating fluidized bed gasifiers Figure 5-b are similar to the bubbling, except that the rate of the gasifying agent is higher than the minimum fluidization rate. This causes the bed material to be entrained with the synthesis gas. Therefore, at the outlet of the reactor there is a cyclonic system which separates the gas from the unreacted solid and from the bed material that has been entrained, the latter being recycled to the gasifier. In this type of reactors, the fluidization is fast and without bubbles, which improves the heat transfer and the transfer of matter; therefore, high conversion rates and a low tar content are obtained. The main disadvantage of these gasifiers is a greater loss of charge, which results in a higher electrical consumption [18,19]. An example of this type of gasifier is the Värnamo demonstration plant in Sweden [27].
a) b)
20
iii) Indirect Gasifiers
Indirect gasification can be carried out in two types of reactors: the indirect gas gasifier and the indirect char gasifier. These reactors are similar to those of fluidized bed, with the difference that they present an additional unit (a combustor) to supply the heat demand of the gasification process. In both cases, steam is used as a gassing agent, producing in this way a synthesis gas with a higher hydrogen content and a higher calorific value compared to that produced using air as a gassing agent.
As can be seen in Figure 6, the indirect gas gasifier is formed by a fluidized bed gasifier containing a heat exchanger inside the bed and a combustion chamber. The heat required for the
gasification is supplied by the combustion of part of the synthesis gas produced. The advantage of this process is that it allows working with a wide variety of raw materials [19]. The indirect
char gasifier
Figure 7 consists of two reactors: a circulating fluidized bed gasifier and a fluidized bed
combustion chamber. The biomass is converted into synthesis gas in the gasifier, which operates at a temperature between 700 and 900 ºC. The char formed and the bed material are separated from the gas in a cyclone at the outlet of the reactor and are sent to the combustion chamber where combustion of the char takes place and the bed material is heated. Bed material is recirculated to the reactor, where it yields its heat, providing the energy need for the gasification process. This type of gasifier has the highest conversions and a high gas yield [19].
21
Figure 7. Indirect fluidized bed gasifier
Some examples of this type of technology are the biomass gasifier from Battelle, licensed by the Future Energy Resource Corporation in the USA [28] and the FICFB (Fast Internally Circulating Fluidized Bed Gasifier) developed by the Technical University of Vienna in collaboration with the company Austrian Energy & Environment [29]. This type of gasifier, by using pure steam as a gasifying agent, produces a high calorific value gas rich in hydrogen and CO.
Therefore, in the last years it has attracted researchers ‘interest [30].
In the present thesis, the indirect fluidized bed gasifier is selected as the object of study because it produces a gas rich in hydrogen and with a high calorific value, similar to that obtained by gasification with pure oxygen, thus eliminating the cost associated with obtaining the oxygen.
1-3-3 Cleaning synthesis gas
Although the synthesis gas consists mainly of CO and H2, it also contains other components CO2, H2O and CH4 and heavy hydrocarbons named tar. There are also contaminants present in ppm such as solid particulates and alkaline compounds, H2S, HCl, NH3, HCN and COS. Therefore, the synthesis gas must undergo a cleaning and conditioning process in order to achieve a suitable composition for its final application.
Firstly, tar must be removed to avoid problems in the downstream process (poisoning of catalysts, clogging of equipment, etc.). In general, tar can be removed by thermal or catalytic processes, as well as by condensation in a scrubber. At present, to achieve the required tar levels and to improve the composition of the synthesis gas (conversion of tars to CO and H2), a thermal or catalytic treatment of the tars is carried out followed by the condensation of the same.
The thermal process of removal of tars requires temperatures between 900 and 1100 ° C, which are normally greater than the temperature of the synthesis gas at the outlet of the gasifier [31]. This means that this process requires an additional supply of heat, which is usually achieved by the combustion of a small fraction of the gas, implying a loss of efficiency. However, if catalysts (eg,
22
dolomite or nickel based catalysts) are used, the required temperature is lower and no additional energy input is required, thus increasing process efficiency. For this reason, the catalytic treatment is the most used to reduce the tar content [31–33].
After the removal of the tars, a cleaning process is carried out which can be carried out using two technologies: wet cold gas cleaning and dry hot gas cleaning.
Cold gas cleaning is a proven technology with several stages. First, the gas is cooled to condense the organic particles and the condensable alkali compounds which are then removed by filtration. In the next step, the particles that have not been retained by the filters, ammonia and residual tar are removed by washing in a scrubber. Finally, the synthesis gas is subjected to an H2S removal process in order to avoid the poisoning of the catalysts in downstream processes [34].
Among the technologies available for the H2S removal, the most important are the Rectisol, Selexol and LO-CAT® processes, the latter being the most used because, although it has a lower H2S removal efficiency, it is significantly more economical [35]. If the minimum sulfur requirements were not met, a bed of ZnO [35] could then be used. In this way, the concentration of sulfur in the gas can be reduced to below 0.1 ppm. The main disadvantage presented by the cold cleaning of the gas is the production of waste water during washing in the scrubber.
The hot cleaning of the gas is based on the use of a series of adsorbent reactors and filters. First, alkaline impurities and halides are removed in an adsorption reactor where the adsorbent (eg, aluminosilicates) is injected. Subsequently, the adsorbent and the ashes are separated by a cyclone system. Desulfurization takes place subsequently in a second adsorption reactor by injecting a suitable adsorbent (eg, based on CaO). The gas is then introduced into a filter where the particles are completely removed [36,37].
Finally, the traces of S, Se, As, Hg, NH3, etc. under adsorbent conditions are eliminated in a packed multizone bed [36]. This cleaning system is more efficient than cold cleaning and also does not produce wastewater [37]. However, hot cleaning presents technological problems related to adsorbent and particulate filter performance [36].
1-3-4 Uses of synthesis gas
The synthesis gas produced in the biomass gasification has several applications from the energy point of view, among which the combustion of the gas to produce electricity with cogeneration of thermal energy [38]and the production of energy products such as hydrogen and synthetic fuels. i) Electricity production
The synthesis gas produced by biomass gasification can be used to produce electricity and / or heat ii) Hydrogen production
The production of hydrogen from the synthesis gas obtained by gasification of biomass has aroused great interest due to the great variety of applications (chemical synthesis, petrochemical processes and fuel cells) [39]. In fact, it is considered as a promising method of producing hydrogen of renewable origin.
The hydrogen content of the synthesis gas obtained by this method using air or oxygen as the gassing agent is very low, between 8 and 14% by volume. However, if steam is used, the hydrogen content increases to 30 to 60% by volume, which makes this process interesting. To increase the H2 content, the synthesis gas is subjected to the Water Gas Shift (WGS) reaction, whereby the CO
23
is converted into CO2 and H2 (Ec. Typically, the WGS reaction is carried out in two consecutive reactors, one where the reaction takes place at elevated temperature (350-500 ° C) and uses iron and chromium based catalysts, and another where the reaction takes place at low temperature (approximately 200 °C) and employs copper based catalysts. Finally, the hydrogen is purified by a Pressure Swing Adsorption (PSA) unit.
1.4 Pyrolysis: technology and uses
1.4.1 Chemistry of the process
Pyrolysis is a thermal decomposition of the biomass into gas, liquid, and solid. This process has similarity to and some overlap with processes like cracking, devolatilization, carbonization, dry distillation and destructive distillation, but it has no similarity with the gasification process, which involves chemical reactions with an external agent known as gasification medium [12]. Pyrolysis of biomass is typically carried out in a relatively low temperature range of 300 to 650 °C compared to 800 to 1000 °C for gasification [40].
The main reaction that occurs in a pyrolyser is the following:
𝐶𝑛𝐻𝑚𝑂𝑝 + Heat → ∑ 𝐶𝑎𝐻𝑏𝑂𝑐 + ∑ 𝐶𝑥𝐻𝑦𝑂𝑧+ ∑ 𝐶 Eq. 8 Biomass liquid gas solid
In pyrolysis, biomass is fed into a pyrolysis chamber containing hot solids (fluidized bed) that heat the biomass to the pyrolysis temperature, at which decomposition starts. The condensable and non-condensable vapors released from the biomass leave the chamber, while the solid char produced remains partly in the chamber and partly in the gas. The gas is separated from the char and cooled downstream of the reactor. The condensable vapor condenses as bio-oil or pyrolysis oil; the non-condensable gases leave the chamber as product gas. These gases may be fired in a burner to heat the pyrolysis chamber or released for other purposes. Similarly, the solid char may be collected as a commercial product or burned in a separate chamber to produce heat that is necessary for pyrolysis. As this gas is free from oxygen, part of it may be recycled into the pyrolysis chamber as a heat carrier or fluidizing medium [40].
Based on heating rate, pyrolysis may be broadly classified as slow and fast. It is considered slow if the time, 𝑡ℎ𝑒𝑎𝑡𝑖𝑛𝑔, required to heat the fuel to the pyrolysis temperature is much longer than the characteristic pyrolysis reaction time, 𝑡𝑟, and vice versa. That is:
• Fast pyrolysis: 𝑡ℎ𝑒𝑎𝑡𝑖𝑛𝑔 <<𝑡𝑟
The primary goal of fast pyrolysis is to maximize the production of liquid or bio-oil. The heating rate can be as high as 1000 to 10,000 °C/s, but the peak temperature should be below 650 °C if bio-oil is the product of interest [41]. The biomass is heated so rapidly that it reaches the peak (pyrolysis) temperature before it decomposes. However, the peak temperature can be up to 1000 °C if the production of gas is of primary interest. Four important features of the fast pyrolysis process that help increase the liquid yield are: (1) very high heating rate, (2) reaction temperature
24
within the range of 425 to 600 °C, (3) short residence time (<3 s) of vapor in the reactor, and (4) rapid quenching of the product gas [42].
• Slow pyrolysis: 𝑡ℎ𝑒𝑎𝑡𝑖𝑛𝑔 >>𝑡𝑟
In slow pyrolysis, the residence time of vapor in the pyrolysis zone is on the order of minutes or longer. This process is used primarily for char production and is broken down into two types: (i) carbonization and (ii) conventional.
i) Carbonization is a slow pyrolysis process, in which the production of charcoal or char is the primary goal. It is the oldest form of pyrolysis, in use for thousands of years. The biomass is heated slowly in the absence of oxygen to a relatively low temperature (~400 °C) over an extended period of time, which in ancient times ran for several days to maximize the char formation. A small fire at the bottom provided the required heat, which essentially stayed in the well-insulated closed chamber. Carbonization allows adequate time for the condensable vapor to be converted into char and non-condensable gases[12].
ii) Conventional pyrolysis involves all three types of pyrolysis product (gas, liquid, and char). As such, it heats the biomass at a moderate rate to a moderate temperature (~600 °C). The product residence time is on the order of minutes. The biochar yield, bio-oil and syngas can be produced between 25%-35%, 30% and 35%, respectively [41]. Such a yield may vary depending on the nature of the feedstock, reactor type as well as the degree of operating conditions optimization [43].
1.4.2 Types of pyrolyser
The technologies available to produce biochar can be either manually operated or automatically run. In these technologies, it is possible to control some of the variables that affect the yield of biochar while it is not possible to directly control some operating conditions. Therefore, similar to gasification, the mode of operation varies with reactors designed for either autothermal or allothermal mode.
The following technologies for biomass pyrolysis are proposed. They have been extensively used in spite of their limited application due to their respective drawbacks. These conventional pyrolysis units include:
• Fixed beds: These have been used for the traditional production of charcoal. They are poor in heat and mass transfer because the bed is stationary in one position and there is no uniform mixing inside the reactor [46].
• Fluidized beds: Within fluidized bed reactors, the biomass is mixed with a hot sand bed fluidized by a gas which keeps the mixture rotating within the reactor. The attrition between biomass particles and sand particles doesn’t make fluidized beds a better choice for biochar production because there is a higher carbon conversion to gases than to solid char [52,53]. • Augers: In this technology, hot sand and biomass particles are fed at end of a screw which mixes the sand and biomass and conveys them along. This process works best when gases are the major product because it avoids the dilution of the other products with the carrier gases. Reheating sand must be done in a separate vessel therefore mechanical reliability is a concern [54].
25
• Ablative technologies: During ablative processes, biomass particles are moved at high speed against a hot metal surface. Ablation of any char forming at a particle’s surface maintains a high rate of heat transfer. This can be achieved by using a metal surface spinning at high speed within a bed of biomass particles, which may present mechanical reliability problems but prevents any dilution of the products [54,55].
• Rotating cone: Pre-heated hot sand and biomass particles are moved into a rotating cone. Due to the rotation of the cone, the mixture of sand and biomass is transported across the cone surface by centrifugal force [46].
• Circulating fluidized beds: Biomass particles are moved into a circulating fluidized bed of hot sand. Gas, sand and biomass particles move together. High heat transfer rates from sand ensure rapid heating of biomass particles and ablation stronger than with regular fluidized beds. A fast separator splits the product gases and vapors from the sand and char particles. The sand particles are reheated in a fluidized burner vessel and recycled to the reactor. Although this process can be easily scaled up, it is rather complex and the products are much diluted, which greatly complicates the recovery of the liquid products [53].
• Vacuum pyrolyzer: This technology comprises a number of stacked heated circular plates. The top plate is at about 200 °C while the bottom one is at about 400 °C. Biomass fed to the top plate drops into successive lower plates by means of scrapers. The biomass undergoes drying and pyrolysis while moving over the plates. No carrier gas is required in this pyrolyzer. Only char is left when the biomass reaches the lowest plate. Though the heating rate of the biomass is relatively slow, the residence time of the vapor in the pyrolysis zone is short. As a result, the liquid yield in this process is relatively modest, about 35 to 50% on dry feed, with a high char yield. This pyrolyzer design is complex, especially given the fouling potential of the vacuum pump[12,54].
1-4-3 Products of pyrolysis
As mentioned earlier, pyrolysis involves a breakdown of large complex molecules into several smaller molecules. Its product is classified into three principal types which their nature depends on several factors, including pyrolysis temperature and heating rate:
i) Liquid (tars, heavier hydrocarbons, and water)
The liquid yield, known as tar, bio-oil, or biocrude, is a black tarry fluid containing up to 20% water. It consists mainly of homologous phenolic compounds [12].
Bio-oil is a mixture of complex hydrocarbons with large amounts of oxygen and water. While the parent biomass has an LHV in the range of 19.5 to 21 MJ/kg dry basis, its liquid yield has a lower LHV, in the range of 13 to 18 MJ/kg wet basis [44]. It typically contains molecular fragments of cellulose, hemicellulose, and lignin polymers that escaped the pyrolysis environment [45,46]. The molecular weight of the condensed bio-oil may exceed 500 Daltons [45]. Compounds found in bio-oil fall into the following five broad categories [46]:
• Hydroxyaldehydes • Hydroxyketones
26
• Carboxylic acids
ii) Gas (CO2, H2O, CO, C2H2, C2H4, C2H6, C6H6, etc)
Primary decomposition of biomass produces both condensable gases (vapor) and noncondensable gases primary gas). The vapors, which are made of heavier molecules, condense upon cooling, adding to the liquid yield of pyrolysis.
The noncondensable gas mixture contains lower-molecular-weight gases like carbon dioxide, carbon monoxide, methane, ethane, and ethylene. These do not condense on cooling. Additional noncondensable gases produced through secondary cracking of the vapor are called secondary
gases.
The final noncondensable gas product is thus a mixture of both primary and secondary gases. The LHV of primary gases is typically 11 MJ/Nm3, but that of pyrolysis gases formed after severe secondary cracking of the vapor is much higher: 20 MJ/Nm3 (Diebold and Bridgwater, 1997). iii) Solid (mostly char or carbon)
Char is the solid yield of pyrolysis. It is primarily carbon (~85%), but it can also contain some oxygen and hydrogen. Unlike fossil fuels, biomass contains very little inorganic ash. The lower heating value (LHV) of biomass char is about 32 MJ/kg [45], which is substantially higher than that of the parent biomass or its liquid product. This product has many uses including soil amendment and long term carbon sequestration [47].
This study concentrates on biochar production applied to soil as this pyrogenic black carbon has substantial advantages from social, financial and environmental point of view. These potential benefits have been identified as: (1) soil improvement for higher biomass yields and possible costs savings; (2) waste management; (3) climate change mitigation; and (4) bioenergy production in addition to biochar production. There are some environmental sustainability studies on biochar use in soil which address CO2 saving [48–51].
27
28
In the previous chapter, the main technological alternatives for the gasification of biomass were assessed. Indirect Fluidized bed gasifier was chosen for this study because biomass conversion in these gasifiers is close to 100% and biomass flow rate per installed reactor area is double to ten times higher than in the fixed beds (500-1000 kgbiomass/h m2). These advantages are due to excellent gas-solid mixing and the large thermal inertia of the bed which uniform the temperature and the solid/gas concentration in the entire bed. In addition, unlike fixed bed gasifiers which need a fairly specific feedstock, fluidized bed gasifiers are in general more suitable for a large variety of biomass since they operate with uniform and relatively low temperatures (700-900 °C). Therefore, most high-ash content fuels, depending on ash chemistry, can be gasified without problems of ash sintering and agglomeration. The other technology considered in this thesis is slow pyrolysis as the most successful approach for high-yield biochar production which is one of the target products in this dissertation. Under slow pyrolysis, the longer residence time of the feedstock and the lower temperatures than 700 ℃ allow the volatile components to escape leaving a chary solid behind. Biochar is specifically addressed because its application to soil can have substantial advantages from a social, economic and environmental point of view, such as: (1) soil improvement for higher biomass yields and possible costs savings; (2) waste management; (3) climate change mitigation; and (4) bioenergy production in addition to biochar production. Moreover, hydrogen as a clean energy carrier is a promising product due to multiple applications in industrial market (chemical, refineries, metal processing, etc.), stationary power generation, and particularly in transport due to growing demand for zero-emission fuels and the implementation of fuel cell systems. In particular, hydrogen from biomass can be a specific role in sustainable energy strategy.
On the other hand, the innovative application of mentioned technologies to generate hydrogen and biochar entails problems linked to complexity of the system owing to biomass nature. Therefore, although the environmental benefits of these products in the application have been verified, the sustainability of the entire chain, from the production to the end uses, remains unclear. In fact, it is still to be determined whether the production of biochar and hydrogen from biomass is economical and environmentally and socially feasible which makes a sustainability assessment of these systems important. Life Cycle Assessment (LCA) is a well-known technique for monitoring environmental performance as well as integrating environmental, economic and social issues associated with a product.
The goal of this thesis is to assess the environmental and economic burdens of the various stages of life cycle of hydrogen and biochar using life cycle assessment (LCA). Different scenarios based on kinds of biomass and operating condition of processes are defined to compare and analyze sensitivity. In addition, the economic concept of shadow prices is applied to assign relative weights of socio-economic importance to the estimated life cycle impacts. This approach includes long-term global environmental impacts and the investigation of trade-offs between different environmental impacts through a single monetary unit.
To reach these objectives, it will be necessary to determine the equipment and processes that contribute most to economic, social and environmental inefficiencies in hydrogen and biochar production.
In addition, in order to propose an approach to reduce and manage environmental impact of biomass production. Environmental performance of vineyards associated with woody biomass waste production is considered as a case study. Therefore, the corresponding environmental hot
29
spots are identified and improvement potentials are proposed by the combined application of LCA and DEA.
30
31 3.1 Sustainable development
The term sustainable development was used by the Brundtland Commission to designate the development that “meets the needs of the present without compromising the ability of future generations to meet their own needs” [56].
In more detail, the social sustainability includes [57]:
• Human health: protect, sustain, and improve human health;
• Resource security: protect, maintain, and restore access to basic resources (e.g. food, land, and energy);
• Democracy and governance: provide democratic processes; • Quality of life: ensure that basic needs are met;
• Equity: provide equitable opportunities and outcomes for all members of the community, particularly the poorest and most vulnerable ones.
Economic sustainability means [58]:
• Jobs: create or maintain current and future jobs;
• Incentives: generate incentives to encourage sustainable practices;
• Natural Resource Accounting: incorporate natural capital depreciation and ecosystem services in cost benefit analysis.
Environmental sustainability consists of [59]:
• Air quality: attain and maintain air-quality standards and reduce the risk from toxic air pollutant;
• Water quality: reduce exposure to contaminants in drinking water and recreational waters; • Stressors: reduce effects by stressors (e.g. pollutants, greenhouse gas emission) to the
ecosystem;
• Resource integrity: reduce waste generation, increase recycling, and ensure proper waste management; restore by mitigating and cleaning up accidental or intentional releases; • Ecosystem services: protect, sustain, and restore the health of critical natural habitats and
ecosystems;
• Green Engineering & Chemistry: develop chemical products and processes to reduce/prevent chemical hazards, reuse or recycle chemicals, treat chemicals to render them less hazardous, dispose of chemical properly.
Therefore, sustainable development involves a pattern of resource use which aims to meet human demands while preserving the environment so that these needs can be met not only in the present, but also for future generations to come.
32
Sustainable development is conceptually regarded as the intersection of three constituent parts as shown in Figure 8 These three dimensions refer to environmental sustainability, economic sustainability and socio-political sustainability.
Figure 8. The three pillars of sustainability
The path towards sustainable development requires the modification of the current operational and environmental instructions. In this sense, it is necessary to pursue reductions in the consumption levels for materials and energy, as well as the mitigation of the corresponding environmental impacts. Environmental sustainability is the capability to preserve the qualities that are valued in the physical environment. Sustainability requires that human activity only employs nature’s resources at a rate at which they can be replenished naturally. The long-term result of environmental deterioration is the failure to sustain human life. Under this context, numerous environmental management tools have been developed with the aim of diminishing the environmental impacts linked to products, processes and services [60].
3.2 Sustainability measurement tools
Sustainability measurement tools were developed in order to understand whether a product/process/activity is sustainable or not and facilitate the improvement of the environmental performance of production systems and the integration of environmental, economic and social concerns. There is a wide range of environmental measurement tools. The main methodologies available are:
• Life Cycle Assessment (LCA), which assesses the interactions between the environment and the product or an activity, regarding the entire life cycle of the product/activity under evaluation;
• Emergetic Analysis, which allows to determine the amount of solar radiation required to obtain a product or a flow of energy for a given process;
• The Embodied Energy Analysis, which enables to convert all inputs used in the production of a product in an amount of oil equivalent;
33
• Carbon Footprint, which evaluates the greenhouse gas emissions related to the life cycle of a product. At the international level, guidelines have been established in order to define a common calculation method.
• Water Footprint, which quantifies the volume of drinkable water consumed (and polluted) produce a good;
• Ecological Footprint, which measures the area of biologically productive land and sea needed to regenerate the resources consumed by a certain activity and to absorb the corresponding waste.
Among the above-mentioned methods, the last three are a subset of the result of an LCA study, as they take into consideration the effects of the life cycle of a product in relation to a single environmental parameter.
3.2.1 Life cycle assessment
Among the methods cited before, the LCA methodology has gradually assumed a prominent role. Such method has been defined as a methodology used to evaluate the main environmental loads associated with products, processes or services. For this, it is necessary to take into account the complete life cycle of a product or activity, "from cradle to grave", that is from the acquisition of the raw material, to production, use and final disposal. This approach is shown in Figure 9, including all phases involved in the life cycle of a product which contribute to the environmental impacts associated with product [61].
Figure 9. The phases of LCA
34 3.4.2 Stages of LCA studies
i) Definition of objectives and scope
The objectives and scope of a LCA must be clearly defined and consistent with the application planned. Because of the iterative nature of LCA, the scope may need to be adjusted throughout the study.
The objective establishes the potential use and audience of the specific LCA case study as well as its justification. On the other hand, the scope includes key aspects of the study such as product system, its function, functional unit (FU), system boundaries, allocation procedures, impact categories, environmental impact assessment method, data requirements, assumptions and constraints. The functional unit is the reference unit used in the LCA studies, which quantifies the functions identified in a product system [61]. Thus, the functional unit provides a reference to which all input and output are related. LCA studies are performed by defining product systems as models that present the main elements of physical systems. System boundaries determine the unit processes to be included within the system.
Data quality requirements specify the characteristics of the data required for the study. Time, geography, technology, accuracy, completeness, consistency, reproductiveness, data sources and uncertainty are some of the aspects considered in data quality.
ii) Life cycle inventory analysis
The second phase in performing a LCA is life cycle inventory analysis (LCI). This phase comprises the collection of the input / output data of the system under study, as well as the explanation of the calculation procedures used.
Qualitative and quantitative data should be collected or calculated for each unit process within the system boundaries. It is necessary to ensure a coherent understanding of the system under study by performing the following tasks:
- Development of flow diagrams of the process that describe all the unit processes that must be taken into account, including their interrelation.
- Listing the flows and operation data related to every unit process. - Listing the units used.
- Description of the calculation and data collection techniques.
Figure 10shows a general flow diagram of the life cycle inventory [62]. The necessary data for the realization of the LCA are the following:
- Inputs of energy, raw materials, auxiliary inputs and other physical inputs. - Products, co-products and waste generated.
- Emissions to the air water and soil. - Other environmental aspects.
35
Figure 10. Flow diagram for life cycle inventory
It is very important that the calculation procedures used in the analysis are correctly documented, clearly specifying the assumptions made. In addition, the same calculation procedures should be followed consistently throughout the analysis.
A key factor in the LCA phase is to make a correct allocation or distribution of environmental charges to each products or processes under study. In the case of monofunctional processes (where a single product or function is obtained), allocation is direct. However, in multifunctional processes (where more than one product or function is obtained), it is necessary to decide the assignment of loads that is given to each the products or functions. The inputs and outputs should be assigned to the different products according to clearly explained and documented procedures. Multifunctional processes are those processes whose function requires the concurrence of more than one process. They include production processes which give rise to more than one product, as well as waste treatment processes with more than one waste flow or energy generation. In this type of systems, environmental burdens must be distributed among the different products or processes. With this purpose, inputs and outputs are allocated to the different products on the basis of procedures which must be clearly specified. Allocation procedures should capture the main features and relationships regarding inputs and outputs. The addition of the inputs and outputs allocated to a unit process shall equal the addition of the inputs and outputs prior to allocation[61].
iii) Impact assessment of the life cycle
The third phase of the LCA is the Life Cycle Impact Assessment (LCIA) which aims to provide further information to evaluate the results of the life cycle inventory in order to better understand the environmental performance of a product system. The LCIA phase involves the following steps: - Selection of impact categories, category indicators and characterization models.
The impact categories chosen to reflect the set of environmental burdens associated with the system under study, taking into account the objective and the scope. The characterization models relate the results of the LCI and the category indicators describe the environmental mechanism given in the study system.
36
- Classification. It is the allocation of life cycle inventory results to the chosen impact categories. - Characterization. It is the calculation of the values for the category indicators.
Characterization means the conversion of the life cycle inventory results to common units and the addition of the converted results belonging to the same impact category. This conversion uses characterization factors. The calculation output is the quantitative result of an indicator.
In addition to these stages, the LCIA may include the following additional elements which can also be useful depending on the specific LCA goal and scope. They include:
- Normalization. It is the calculation of the magnitude of the indicators values based on the reference information. It is aimed to facilitate the understanding of the relative magnitude of each indicator.
- Grouping. It is the organization and / or classification of impact categories.
- Weighting. It is the conversion and potential addition of the indicator results through the impact categories by means of numerical factors based on value judgments.
- Additional data quality analysis (gravity analysis, uncertainty analysis, sensitivity analysis). LCIA methods can be classified mainly into two major groups depending on the ultimate goal of the study:
- Environmental impact assessment methods (mid-point). These methods aim to obtain the definition of an environmental profile by quantifying the environmental effect of the product under study on different impact categories (acidification, eutrophication, etc.). Contrary to the second group, mid-point methods (distance to target methods) only take into account indirect effects on human being (midpoints).
- Damage assessment methods (end-point). These methods evaluate the final effect of the environmental impact by identifying and determining the damage caused to the human being and the natural systems.
In the present work, two impact assessment methods are applying. CML, one of the most common mid-point methods, and IMPACT 2002+ which assesses impacts on both mid-point and end-point level.
The CML method published by the Center of Environmental Science of the Leiden University. The CML guide [63] provides a list of impact categories widely used in LCA studies of energy systems. In particular, in this work the following are used:
- Global warming (GWP). This category is characterized by the model developed by the Intergovernmental Panel on Climate Change. The unit of reference is kg of CO2 equivalent, the time horizon is 100 years and the geographical scope is global.
37
- Ozone layer depletion (OD). The characterization model is based on model developed by the World Meteorological Organization. The reference unit of this indicator is the kg of CFC-11 equivalent. The geographical scope is global and the time horizon is infinite.
Photo-oxidant formation (POFP). This model is developed by the United Nations Economic commission for Europe (UNECE) and analyzes loads and critical levels of various air pollutants and their effects, threats and trends. The reference unit is the kg of C2H4 equivalent. The time horizon is 5 days and the geographical scale varies between local and continental.
- Abiotic depletion (AD). This impact category is related to the extraction of minerals and fossil fuels. The reference unit is kg of element equivalent.
- Acidification (AP). Acidification is calculated using the model adapted from RAINS 10 (simulation and information on regional acidification) developed by the International Institute for Applied Systems Analysis. This model describes the deposition and fate of acidifying substances and analyzes the costs of deposition of SO2 and NOx. The reference unit used is the kg of SO2 equivalent. The time horizon is infinite and the geographic scale varies between local and continental.
- Eutrophication (EP). It quantifies eutrophication in both the aquatic and terrestrial environments. The reference unit for this category is the kg of PO4 equivalent. The time horizon is infinite and the geographic scale varies between local and continental.
In addition to these categories included in the CML method, this work also evaluates accumulative energy demand in the process (CED) which takes into account all the energy required in the process with a life-cycle perspective [64].
The IMPACT 2002 + is a combination of four methods: IMPACT 2002 [65], Eco-indicator 99 [66], CML [63] and IPCC. This method includes several mid-points and four endpoint categories largely based on Eco-indicator 99.
The respective midpoint units are the following [67,68]:
- Carcinogens and Non-carcinogens. The reference substance is chloroethylene emitted into air and the characterization factors are expressed in kg C2H3Cl equivalent into air.
- Respiratory inorganics. The characterization factors are expressed in kg PM2.5 equivalent into air and obtained by dividing the damage factor of the considered substance by the damage factor of the reference substance (PM2.5 into air).
- Ionizing radiation. The characterization factors are expressed in Bq Carbon -14 equivalents into air and obtained by dividing the damage factor of the considered substance by the damage factor of the reference substance (C-14 into air).
![Table 1 . Shadow prices used in different monetary valuation methods [76] LCA application Euryear STEPWISE2006 EUR2003 ECOTAX02 EUR2002 ECOVALUE08 EUR2010](https://thumb-eu.123doks.com/thumbv2/123dokorg/2896862.11760/40.918.131.792.656.893/different-monetary-valuation-application-euryear-stepwise-ecotax-ecovalue.webp)


![[1] S.Santini, “Tecniche efficienti per l’analisi della propagazione elettromagnetica ad alta frequenza in ambienti complessi (outdoor/indoor)”, tesi di laurea, Università di Pisa, AA 2003/04](data:image/gif;base64,R0lGODlhAQABAIAAAP///wAAACH5BAEAAAAALAAAAAABAAEAAAICRAEAOw==)