1
“SAPIENZA” University of Rome
Department of Cellular Biotechnology and Hematology
Ph.D. program
“HUMAN BIOLOGY AND MEDICAL GENETICS” XXXII Cycle
“The role of Yin and Yang 1 (YY1) transcription factor in Acute Myeloid Leukemia (AML)”
Candidate: Stefania Scalea
Scientific tutor:
Prof. Giuseppe Zardo “Sapienza” University of Rome Director of Doctoral Program:
Prof. ssa Laura Stronati “Sapienza” University of Rome
3 INDEX
ABSTRACT 6
INTRODUCTION 8
1. NORMAL AND MALIGNANT HEMATOPOIESIS 8
1.1. Normal hematopoiesis 8
1.1.1 Normal Myeloid commitment 11
1.2 Malignant hematopoiesis 15
1.2.1. Acute Myeloid Leukemia 16
2. EPIGENETICS AND HEMATOPOIESIS 23
2.1 Epigenetic mechanisms 23
2.2 Epigenetic readers 28
2.3 Polycomb group proteins (PcGs) 31
3. YY1 TRANSCRIPTION FACTOR 34
3.1 YY1 biological role 34
3.2 YY1 role in cancer 38
4
AIM OF WORK 42
MATHERIALS AND METHODS 44
- Reagents 44
- Human samples and AML cell lines 44
-Immunophenotypic analysis 45
-Plasmid constructs and lentiviral infection 46
-Protein extraction and Western Blot analysis 47
-RNA extraction and analysis 48
-Morphological analysis 50
-Apoptotic assays 51
-Statistical analysis 50
RESULTS 52
-YY1 expression in AML samples and AML cell lines 52
- Effect of YY1 knockdown on differentiation markers, growth factors/receptors and transcription factors in HL-60 cell line 55
5
- Effect of YY1 knockdown on the main regulators of granulocytic differentiation in HL-60 cells treated or not with Retinoic Acid 61
-Effect of YY1 downregulation on granulocytic differentiation markers in HL-60 cells treated or not with RA 67
- Effect of YY1 knockdown on cell morphology and on the expression of RARα gene in HL-60 cells treated or not with RA
69
- Effect of YY1 downregulation on apoptosis in HL-60 cells treated or not with RA 72
DISCUSSION 76
6 ABSTRACT
Acute Myeloid Leukemia (AML) is an heterogeneous disease with different molecular signatures, therapeutic responses, and survival rates. Recent studies suggest that the transcription factor YY1 is overexpressed in AML patients and that it may have a role in the onset of AML differentiation block. Our data confirm an higher level of YY1 gene expression in patients AML compared to CD34+ hematopoietic progenitors and CD34- mature cells. When YY1 is downregulated, by short hairpin interference in HL60 myeloid cell line, we observed a significant increase in the expression of factors relevant to myeloid differentiation and in particular to granulocytic maturation, such as GMCSFr, GCSFr, CEBPε and CEBPδ and a significant decrease of the MPO gene expression. In addition, we also measured an increase in the staining of the CD11b surface antigene. Importantly, YY1 downregulation reinforced the pro-differentiative effects of all trans retinoic acid (RA) treatment compared to RA treated HL60 cells expressing YY1, including an increase in CEBPα gene expression and morphological changes compatible with granulocytic maturation. To note that YY1 knockdown determined a
7
significant increase of RARα expression, that is crucial to mediate the intracellular effects of RA. In addition, YY1 knockdown also promoted a terminal apoptosis in RA HL60 treated cells, as shown by the activation of caspase, increased expression of BAX gene and increased Annexin V and Propidium Iodide stainings. Therefore, we suggest that YY1 may play a role in the onset of the myeloid differention block in AML HL60 cell line.
8 INTRODUCTION
1.NORMAL AND MALIGNANT HEMATOPOIESIS 1.1.Normal hematopoiesis
Hematopoiesis is the process of blood cell formation starting from hematopoietic stem cells (HSCs) (1). It begins in embryonic yolk sac during the first week of development. After the third month of gestation, fetal liver and spleen are the major sites of hematopoiesis (2). After birth, throughout life, hematopoiesis takes place primarily in bone marrow, where HSCs both self-renew and differentiate into every mature blood cell type (1,3). HSCs can be grouped into a small fraction of quiescent, long-term (LT)-HSCs, and a more active group of short-term (ST)-HSCs (3) with restricted self-renewing capacity.
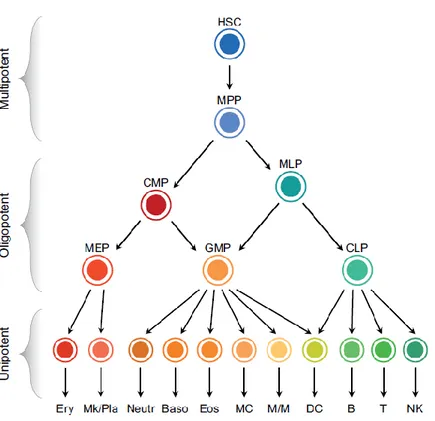
According to a classical hematopoietic differentiation model, the various blood cell lineages arise via a hierarchical scheme starting from multipotent stem cells that become increasingly restricted in their differentiation potential through oligopotent and then unipotent progenitors (4) (Figure 1). Multipotent progenitor cells (MPPs), the immediate progeny of HSCs, have
9
a full lineage potential but a limited self-renewal ability. MPPs give rise to oligopotent progenitors: the common myeloid progenitors (CMPs) and the multilymphoid progenitors (MLPs). CMPs differentiate into the granulocyte/macrophage progenitors (GMPs) and the megakaryocyte/erythroid progenitors (MEPs), which then give rise to unilineage progenitors and mature precursors. MLPs are able to generate both GMPs and the common lymphoid progenitors (CLPs), which differentiate into B, T, and NK cell precursors (1).
10
Figure 1. The classical hierarchical model of human hematopoiesis. Hierarchical scheme including multipotent, oligopotent and unipotent cell types. Abbreviations: B, B cells; Baso, basophils; CLP, common lymphoid progenitor; CMP, common myeloid progenitor; DC, dendritic cells; Eos, eosinophils; Ery, erythrocytes; GMP, granulocyte/macrophage progenitor; HSC, hematopoietic stem cell; MC, mast cells; MEP, megakaryocyte/erythroid progenitor; Mk/Pla, megakaryocytes/platelets; MLP, multilymphoid progenitor; M/ M, monocytes/macrophages; MPP, multipotent progenitor cell; Neutr, neutrophils; NK, natural killer cells; T,Tcells
11
Recent studies challenged the classical hierarchy of human hematopoiesis, working out a refined model where multipotent cells, such as HSCs and MPPs, give rise to committed unipotent progenitors, without an intermediate oligopotent CMP and MEP stage (4). However, the hierarchical model is suitable and widely used to investigate the molecular mechanisms that drive HSPCs commitment and differentiation (1). The entire differentiation process is highly regulated by both extrinsic and intrinsic factors, including transcription factors (TFs), signaling pathways, cytokines, niche factors (2) and epigenetic regulators of gene expression (3).
1.1.1 Normal Myeloid commitment.
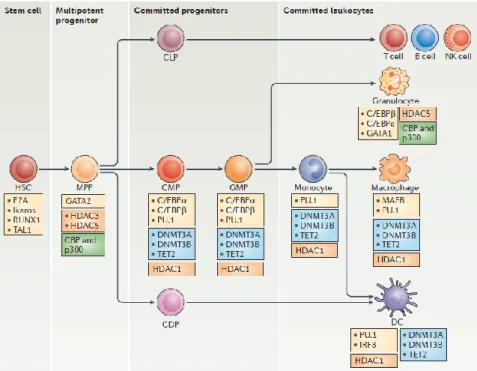
The differentiation and establishment of hematopoietic cells depends on the instructive effects of several lineage-specific transcription factors, which control the activation of lineage-specific transcriptional programs through the binding of cis-regulatory elements (promoters or enhancers) ( Figure 2) (5).
12
Figure 2. Transcription factors and epigenetic regulators of human hematopoiesis. The figure focuses on the main stages of myeloid differentiation (in the central horizontal axis) and indicates the key transcription factors (yellow boxes) and epigenetic enzymes that could be involved at each stage. Enzymes that participate in DNA demethylation events are shown in blue boxes, histone deacetylases (HDACs) are shown in orange boxes and histone acetyltransferases are shown in green boxes.
13
The interactions between Runx1, Gata2 and Scl results in a joint control of the balance between stem cell quiescence and proliferation. Relationships between Gata2, Gfi1 and Gfi1b or Bcl11A, Sox4 and TEAD1 are necessary in B-cell specification (6).
In the myeloid compartment, master transcription factors PU.1, Gata1 and CEBP-α regulate transition from MPP to CMP and from CMP to GMP (5). PU.1 cross-inhibitory interaction with Gata1 is a key determinant of the balance between megakaryocytic/erythroid and myeloid lineage choice (7). PU.1 expression in the erythroid–myeloid lineage causes monocytic differentiation, while Gata1 causes erythroid and megakaryocytic differentiation. Both transcription factors positively auto-regulate their own expression, and Gata1 has been shown to reduce PU.1 expression by binding at its regulatory regions as well as directly inhibiting Pu.1 protein activity (8).
CEBP family of transcription factors are important at certain steps of myelopoiesis (9). The differential expression of CEBP-α appears to influence the lineage choice of bi-potent GMP precursors to either granulocytic or monocytic direction. It is
14
found preferentially expressed in and required for granulocytic lineage; indeed, truncated forms of CEBP-α were detected in some AML patients (10). High level of CEBP-β leads to monocyte and macrophage development, while high level of CEBP-ɛ leads to neutrophil differentiation. It has been documented that CEBP-δ regulates expression of genes important for granulocyte function (9). CEBP-δ is silenced and its promoter is hypermethylated in many cases of AML (11). The execution of lineage-committing function of TFs is at least partly mediated through the extrinsic M-CSF/M-CSFR, G-CSF/G-CSFR and GM-CSF/GM-CSFR signaling pathways (10). Furthermore, some ligands for nuclear receptors can also modulate cell fate during hematopoiesis such as ligands for retinoic acid receptors (RARs) (9). The retinoid receptor RARs/RXRs might act as a differentiation checkpoint switch at the myeloid stage of granulopoiesis. The proper concentration of retinoid acid is required for its binding to RAR/RXR heterodimer when the latter is docking on RARE (retinoic acid response element) in regulatory sequences of its target genes. The result is to transform RAR/RXR repressor into a transcriptional activator by releasing co-repressor and recruiting co-activator to itself, which is necessary for the
15
induction of target genes for myeloid differentiation (10). Conversely, ATRA fails to induce differentiation in cells with dysfunctional RAR signaling, due for examples to the presence of oncoproteins or to epigenetic changes such as in acute promyelocytic leukemia (APL) (12).
1.2. Malignant hematopoiesis
Deregulation of transcription factors involved in HSC differentiation and lineage-commitment and defective epigenetic regulation of terminally differentiated cells, causes the onset of hematopoietic tumors called lymphoma, myeloma and leukemia (5). Lymphomas may be broadly divided into non-Hodgkin (90%) and Hodgkin (10%) types. Most lymphomas (90%) are of B cell origin but can also be T cell or natural killer cell (13). Multiple Myeloma (MM) starts from long lived plasma cells which develop in germinal center of lymphoid tissues. The myeloma plasma cells attain oncogenic potential, home to the BM and due to the support in microenvironment niche, survive for a long time (14). Leukemia can affect the lymphoid line of blood cells such as in acute or chronic lymphoid leukemia (ALL or CLL) or the
16
myeloid lineage causing acute or chronic myeloid leukemia (AML or CML) (15). In all types of haematological malignancies, the normal blood cell development process is interrupted by uncontrolled growth of an abnormal type of blood cell with an impairment of its physiological function (16).
1.2.1. Acute myeloid leukemia
Acute myeloid leukemia is a malignant disorder of hematopoietic stem cells, characterized by clonal expansion of abnormally differentiated blasts of myeloid lineage. Consequences of this proliferation of immature myeloid cells include accumulation of immature progenitors (blasts) with impairment of normal hematopoiesis, leading to severe infections, anemia, and hemorrhage (17).
AML is the most common acute leukemia in adults, accounting for ~ 80 percent of cases in this group. The median age at diagnosis is 67 years, and the incidence of the disease increases with age. Within the United States and the Europe, the incidence of AML ranges from three to five cases per 100 000 population (18, 19).
17
AML can arise in patients with an underlying hematological disorder, or as a consequence of a prior cytotoxic and radiation therapy (secondary-AMLs). However, in majority of cases it appears as a de novo malignancy in previously healthy individuals (primary AMLs) (17, 18). Several genetic and environmental risk factors have been identified that predispose individuals to the development of acute myeloid leukemia (17).
Acute myeloid leukemia has a complex genomic landscape. Chromosomal abnormalities (e.g. deletions, translocations, inversion) are identified in approximately 50% of all adult patients with primary AML and have long been recognized as the genetic events that cause and promote this disease (20, 21). Main consequence of chromosomal translocation is fusion protein production, with oncogenic potential such as RUNX1-RUNX1T1, PML-RARα and CBFB-MYH11 (15). Certain cytogenetic abnormalities, involving t(8;21)(q22;q22) (RUNX1-RUNX1T1) or t(15;17)(q22;q12) (PML-RARα), are associated with longer remission and survival, while alterations of chromosomes 5, 7, complex karyotype (described as >3 chromosomal abnormalities) and KMT2A gene alterations
18
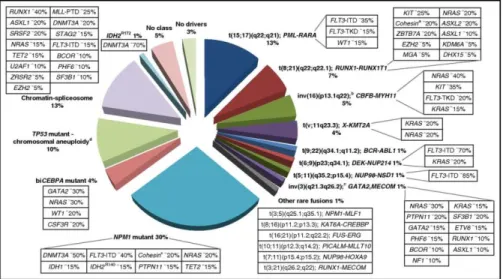
(11q23) are associated with poor response to therapy and shorter overall survival. In contrast, about 40-50% of all AML cases are cytogenetically normal (CN-AML) with point mutations in CEBP-α, NPM1, FLT3-ITD, IDH1/2, DNMT3A genes (20, 21, 22) (Figure 3). Twenty-three genes were identified as commonly mutated, and another 237 genes were mutated in two or more cases in non-random patterns of co-occurrence and mutual exclusivity. Mutated genes were classified into one of nine functional categories: transcription factor fusions, NPM1 gene, tumour suppressor genes, DNA methylation-related genes, signaling genes, chromatin-modifying genes, myeloid transcription factor genes, cohesin complex genes and spliceosome complex genes (22).
19
Figure 3. AML genomic landscape. Distribution of cytogenetically and molecularly defined subsets of AML presenting in younger adults up to the age of 65 years. For each AML class denoted in the pie chart, frequent co-occurring mutations are shown in the respective boxes.
Age and performance status in addition to chromosomal and molecular aberrations remain the most important tools for outcome prediction in AML (22). Indeed, the French-American-British (FAB) AML classification system, that classified AMLs by the morphology and cytochemical phenotype of cells, ultimately suffered from poor reproducibility and did not provide satisfactorily predictive prognostic information (23).
20
The World Health Organization (WHO) classification of AML has since moved toward a system based more on underlying genetics, first incorporating recurrent structural cytogenetic abnormalities, then specific gene mutations in the recent 2008 edition, upgraded in 2016 (23) (Figure 4). In 2010, the European Leukaemia Net (ELN) classification scheme was created in an effort to standardize risk stratification in adult patients with AML by including cytogenetic and known molecular abnormalities. In the upgraded version (2017), AML patients are classified into one of three risk groups: favorable, intermediate and adverse (21, 22).
21
Figure 4. A 2016 revision of WHO classification of AMLs. AMLs are classified into six major disease entities: AML with recurrent genetic abnormalities; AML with myelodysplasia-related features; therapyrelated AML; AML not otherwise specified; myeloid sarcoma; and myeloid proliferation related to Down syndrome.
The conventional approach for a AML patient is induction chemotherapy to achieve complete remission (17). The mainstay of induction therapy consists of the ‘7+3’ regimen, which combines 7 days of continuous infusion cytarabine (100–200 mg/m2) with 3 days of anthracycline (idarubicin or
daunorubicin). Unfortunately, minimal residual disease often persists in complete remission, and relapse will inevitably occur if treatment is discontinued (18). Therefore, a favorable response to induction therapy should be followed by consolidation therapy in order to eradicate any residual disease and achieve lasting remission. Standard post-remission strategies include high-dose chemotherapy like fludarabine, cytarabine, G-CSF and idarubicin (FLAG-IDA) and/or allogeneic hematopoietic stem cells transplants alloHSCT (18,20).
Advances in genomic landscape identification and risk stratification has made it possible to improve and personalize
22
therapy by combining chemotherapy with other specific therapies for each patient based on individual clinical, cytogenetic, and molecular features (personalized medicine) (17, 20). Use of inhibitors, small molecules, epigenetic modulators or immunotherapy result, in many cases, in improvement in outcome (20) More successful examples are small-molecule FLT3 tyrosine kinase inhibitors, HDAC and mutant IDH1/IDH2 inhibitors, antiapoptotic BCL-2 protein antagonists, monoclonal antibodies against myeloid surface protein markers or synthetic T-cell receptors with antibody-like specificity (CART therapy)(20, 21, 18).
Given improvements in therapeutic regimens and supportive care (including infection control and transfusion support), AML is now cured in approximately 35–40% of patients younger than 60 years of age. For elderly patients (>60 years), the prognosis has also improved, but survival remains poor (22).
23
2. EPIGENETICS AND HEMATOPOIESIS
2.1. Epigenetic mechanisms
Epigenetic mechanisms of gene expression regulation sustain the pro-differentiave role of the sequential expression and activity of TFs and cytokines and, thus, have a crucial role in normal hematopoiesis via balancing the self-renewal and differentiation of HSCs and supporting cell type–specific transcription and post transcription programs (2, 3). A dysfunction of the epigenetic machinery impacts on the regulation of genes that are critical to the development of leukemia (24). The transcriptional control of gene expression is
regulated through chromatin remodeling and DNA
accessibility. This, in turn, is regulated by various epigenetic factors such as DNA methylation and histone modifications, whereas small non-coding RNAs are involved in post-transcriptional regulation (2).
DNA methylation is one of the key regulatory mechanisms of HSC self-renewal and lineage commitment in normal hematopoiesis (26). There is a significant amount of variation of DNA methylation signatures in hematopoietic cells. According to a complex process: absent or almost
24
undetectable levels of DNA methylation in gene-regulatory elements of the chosen lineage are associated with transcriptional gene activation, whereas DNA methylation of the same regions is associated with transcriptional gene inhibition in alternative lineages (2). Many genes that are initially methylated, and transcriptionally inactive, in MPPs or HSCs are found to undergo selective demethylation in a tissue or lineage-specific manner where their expression is required. Examples are the kinase Lck, which undergoes demethylation in T cells, Pou2af1 which is demethylated in B cells or Mpo and Cxcr2 in GMPs. Another set of genes is actively subjected to de novo methylation and long term silencing during lineage-specific development. Meis1 progressively becomes hypermethylated and transcriptionally silenced towards both myeloid and lymphoid lineage, Dach1 is demethylated in MPPs and GMPs but methylated in CLPs (26). The modifications of DNA methylation patterns throughout differentiative restriction of HSCs, MPPs and UPPs are associated with the activation or inhibition of lineage-specific gene programs and thus with lineage commitment.
25
Dnmts (DNA methyltransferases) and TETs (ten-eleven translocations) are the enzymes responsible for DNA methylation and demethylation respectively and their impaired function is frequently observed in acute myeloid leukemia (AML) (26, 25). Dnmt3a-deficient HSCs exhibit a global loss of DNA methylation with enrichment in genes associated with HSC self-renewal and multipotency such as Hoxa9, Meis1, Runx1 and Gata3 promoting leukemia progression (26, 5).
DNA methylation modifications are strictly correlated with histone modifications. Specific, global and local, histone modifications are associated not only with distinctive DNA methylation patterns (24) but also with specific gene expression programs.
Histones may undergo at different post-translational modifications. Different aminoacids, at different positions, of
histone proteins may be methylated, acetylated,
phosphorylated, ubiquitylated and sumoylated. Each one of these modifications is catalyzed by a specific class of enzymes generally named as writers (for example: histone methyltransferases-HMTs and histone acetyltransferases-HATs), furthermore the level of modification can be regulated
26
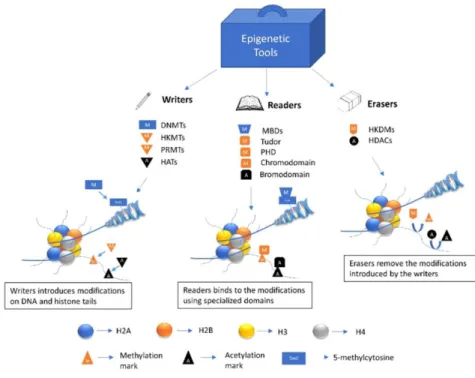
by enzymes with opposite activity, named erasers, such as histone demethylases and deacetylases (24, 25). Histone modifications are associated with specific chromatin architecture and biological activities. These modifications can directly modulate not only histone-DNA interactions but also represent docking platform necessary to recruit specific transcriptional regulatory complexes. These regulatory complexes are generally named as readers whose role is to interpret the chromatin signal and allow the actuation of specific activating or inhibiting gene expression programs (Figure 5) (27).
Trimethylated lysine 4 of histone H3 (H3K4me3) is associated with demethylated DNA and active gene promoters, whereas trimethylated lysine 27 of histone H3 is associated with methylated DNA and inactive gene promoters. Active H3K4me3 and repressive H3K27me3 marks may also overlap at specific gene promoters ensuring an intermediate level of gene expression. The coexistence of H3K4me3 and H3K27me3 on the same promoter region defines a “bivalent chromatin domain” which fine-tunes the gene expression during development allowing either rapid activation or stable
27
silencing of specific gene programs (2). Master haematopoietic cell regulator genes, such as Pax5, C/EBPα and Ebf1 have a clear bivalent histone methylation status in HSCs (26, 5). Pax5 and Ebf1, key determinant factors of B cell-lineage specification and differentiation, appeared to be transcriptionally paused by bivalent domains before lineage commitment. The promoter region of these genes lost H3K27me3 modification in mature B cells acquiring a H3K4me3-only mark which determines an active monovalent state (28). Also C/EBPα bivalent domain appear to be resolved in a mono-label H3K4me3 and then transcriptionally activated during myeloid commitment. Other differentiation genes seem to be specifically marked, in HSCs, with other histone modifications (such as H3K4me1, H3K9me1, H4K20me1, H3K79me2 and H3Ac) surrounding the promoter, and similar marks are also associated with the enhancers. By contrast, bivalent genes lacking these marks but carrying H3K9me3 are destined for long term silencing in all sublineages (26).
28
Figure 5. A representation of epigenetic writers, readers and erasers. These enzymes and protein domains carry out most of the epigenetic modifications on DNA and histone tails.
2.2. Epigenetic readers.
The plethora of histone modifications must be recognized by other cellular proteins to mediate their effects. These cellular proteins or protein complexes, as mentioned before, are
29
known as “readers” of the epigenome. Numerous chromatin modifiers act as epigenetic readers due to the presence of specialized domains that can identify and bind different covalent modifications present on DNA and histones.
Methyl CpG binding proteins (MBPs) bind and interpret methylated DNA. These proteins readout DNA methylation by recruiting chromatin remodeling complex associated with transcriptional repression (29).
Histone methylated lysine residues are read by proteins characterized by the presence of tudor domain (TD), tandem tudor domain (TTD), chromodomain, chromobarrel, double chromodomain (DCD), malignant brain tumor (MBT), PWWP (Pro-Trp-Trp-Pro), plant homeodomain (PHD), WD40, ADD (ATRX-DNMT3-DNMT3L), Ankyrin, bromo-adjacent homology (BAH) and zincfingerCW (zf-CW) domain (27). Tudor domain is found in numerous proteins and exists either as a single domain or in tandem. Single tudor domains are found in PHD finger protein 1 (PHF1) and PHF19 which are members of Polycomb protein family that recognize H3K36me3 (30, 31). Spindlin 1, which contains three tudor domains in tandem, interacts with H3K4me3 (32). UHRF1 contains a tandem tudor
30
domain and recognizes H3K9me3 (33). The histone demethylase JMJD2A comprises a hybrid TTD that binds to H3K4me3 and H4K20me3 (34). HP1 and Polycomb proteins contain single chromodomain that recognize H3K9me3 and H3K27me3 respectively (35). CHD1 protein interacts with various methylated states of H3 associated with active chromatin (36). The PHD finger module recognize both methylation and acetylation on histone tails. WDR5 recognizes methylated H3K4 and further catalyzes its tri methylation (37), whereas EED subunit of Polycomb repressive complex 2 (PRC2) recognizes H3K27me3 and enables chromatin compaction (38). The Ankyrin repeats present in the methyltransferases G9a and GLP recognize H3K9me1/2 mark associated with transcriptional repression (39).
Acetylation of histones uncoils the DNA wrapped around the nucleasome leading to transcriptional activation. Various protein domains have been identified capable to bind to acetylated histones, these include bromodomain (BRD), double PHD finger and Yeats domains (27).
31
2.3. Polycomb group proteins (PcGs)
Polycomb group proteins via their role of both writers and readers of epigenetic modifications represent a major negative regulators of gene expression in HSCs and normal lineage commitment process.
The proteins encoded by PcG genes were described as part of two distinct multiprotein complexes: PRC1 (polycomb repressive complex 1) and PRC2 (polycomb repressive complex 2), which are highly conserved in mammals (3). The role of PcGs is to repress or pause gene transcription. There are six subtypes of PRC1 complexes containing a common core consisting of RING1 (RING1A or RING1B) and BMI1 proteins. PRC1 complexes contribute to polycomb gene repression by monoubiquitination of H2AK119, performed by the Ring domain of the RING1 protein, which functions as an E3 ligase, transferring ubiquitin from an E2 ligase to the
H2AK119 target. PRC2 complexes contain histone
methyltransferases (HMTases) activity that catalyzes the trimethylation of H3K27. PRC2 has two main configurations, PRC2.1 and PRC2.2, which share the catalytic subunit EZ homolog 2 (EZH2) responsible for the trimethylation of H3K27
32
(40) and SUZ12 and EED proteins that are necessary for EZH2 activity. How PcGs work? In the classical model of recruitment of PcG complexes to DNA, the H3K27me3 mark is first deposited by PRC2 complex, which is, in turn, recognized by the chromobox homolog (CBX) proteins contained in canonical PRC1 (41). Transcription silencing is then imposed by blocking the access of chromatin remodeling complexes and/or directly inhibiting the transcriptional machinery at any step, from its recruitment to elongation. However, the determinants of PRC2 recruitment are still not well identified. PRC2 components do not contain DNA binding motif. Initial studies in Drosophila provided experimental evidences for a sequential binding of PcG complexes at PcG response elements (PREs). However, in mammals, several lines of evidence argue against the proposed model as a general mechanism of action as only two functional PRE elements have been identified. On the basis of sequence homology, the Zinc finger protein YY1 was found to be the mammalian ortholog of the DNA binding protein PHO. Studies in HeLa cells suggest that YY1 could mediate PcG binding to specific loci. However, genome-wide analysis showing a poor overlap between PcG and YY1 and an absence of YY1 DNA binding
33
elements on PcG targets sites, indicate that YY1 is not a major regulator of PcG recruitment in mammals although non-canonical PRC1s (PRC1.1, 3, 5, and 6), which contain RING1- and YY1-binding protein (RYBP) rely on, as alternative, H3K27me3-independent mode of recruitment. Moreover, PRC2.2 is able to recognize ubiquitylated H2A, suggesting that there is more than a single way of crosstalk between PcG proteins (42, 43).
Indeed, PcG proteins are fundamental for a proper hematopoietic lineage commitment. BMI-1 and RING1B are localized at the bivalent promoters of B-lineage master regulators Ebf1 and Pax5 and regulate lymphoid specification by preventing B cell lineage commitment. SUZ12 is essential for T and B cell maturation but dispensable for proper myelopoiesis. On the contrary, another PRC2 component, MTF2 is necessary to induce myelopoiesis targeting master regulators of erythrocyte maturation such as the Wnt signaling pathway and its downstream targets Gata2, Fli1, Myb, and Stat5b (3).
34 3. YY1 TRANSCRIPTION FACTOR
3.1 YY1 biological role
YY1 (Yin Yang-1) is a ubiquitous and multifunctional transcription factor, member of the GLI-Kruppel family of zinc finger DNA binding proteins (44, 45). The name “Yin Yang” refers to its ability to activate or inactivate gene expression, depending on partner proteins, promoter context and chromatin structure; in this way it may be involved in the transcriptional control of ̴10% of the total mammalian gene set (44).
YY1 was discovered in the early 1990s by several groups using a variety of approaches. Chang et al, 1989 and Shi et al, 1991 showed that the viral oncogene product Adenovirus E1A regulates the transcriptional activity of YY1 by converting it from a repressor to an activator (44, 46). Park and Atchinson, 1991 identified YY1, which they termed NF-E1, on its ability to bind within the Igk 3’ enhancer; Hariharan et al, 1991 observed the ability of YY1, termed δ, to bind to sequence elements downstream of the transcriptional start sites in the ribosomal protein L30 and L32 genes (47).
35
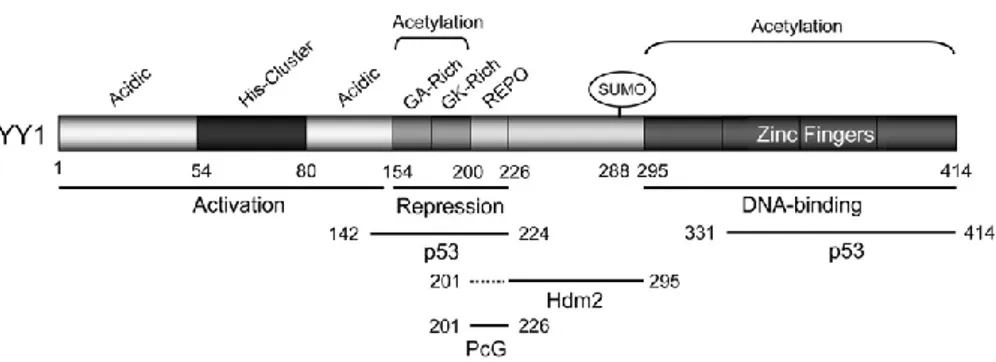
Human YY1 consists of 414 aa and it has multiple functional domains. It contains a transactivation domain at its amino-terminus, a repression domain at its central portion, and a DNA binding domain constituted of four zinc fingers of the C2H2 type at its carboxyl-terminus. All four fingers have been shown to be required for proper binding to DNA and involved in transcriptional regulation (44, 46, 48) (Figure 6).
Figure 6. The structure for human YY1. Human YY1 consists of 414 amino acids with an aminoterminal transactivation domain containing 11x His cluster and a carboxyl terminal zinc finger domain. The GA, GK-rich, and REPO domains have been shown to be responsible for transcriptional repression. The REPO domain of YY1 binds and recruits PcG transcriptional repressors.
It is conserved in multiple species and the amino acid sequence is 96% homologous between the human and the
36
mouse YY1 (49). YY1 activity can be dependent and independent of DNA binding (44): it binds gene promoters and enhancers through its consensus region 5’-AANATGGCG-3′ and it functionally interacts with many proteins like a cofactor (45). Examples of the latter include YY1 interaction with the androgen receptor that enhances its association with an androgen response element and YY1 stimulation of Mdm2-mediated p53 ubiquitination and degradation (46, 50).
YY1 is able to activate or repress gene transcription through multiple mechanisms, including activator displacement, functional interference with activator, corepressor or coactivator recruitment, direct activation, cofactor-induced inhibition of YY1 repression and chromatin remodeling (44, 47).
YY1 has an epigenetic role. It is considered a member of Polycomb group proteins: it binds DNA and it recruits, through the REPO domain, the Polycomb group silencing complexes to chromatin, establishing gene repression (46). Furthermore, It can recruit other chromatin remodelers as corepressors like HDACs and DNMTs or it can interact with coactivator proteins like p300, CBP, PCAF, PRMT (44, 47).
37
There are several mechanisms that regulate YY1 expression and activity. YY1 can auto-regulate, through a cluster of its own DNA-binding sites within the firstintron ensuring homeostasis of cellular levels of YY1 protein. YY1 is transcriptionally regulated at promoter level by several proteins, including NF-kB. YY1 is regulated too by post-transcriptional modification like methylation, phosphorylation, acetylation, poly(ADP-ribosyl)ation, and ubiquitination (49). SET7/9-mediated YY1 lysine methylation positively regulates YY1 DNA-binding activity (48). Acetylation of the YY1 central region is required for its full transcriptional repressor activity; acetylation of the C-terminal zinc finger domain decreases the DNA-binding activity of YY1 (51).
YY1 has fundamental roles in embryogenesis, cell proliferation, and differentiation (46). Its deficiency in mice is lethal in the embryo (49) and its inhibition in cultured cells lead to cytokinesis defects and cell cycle arrest (48). It is involved, too, in apoptosis, X-chromosome inactivation and DNA repair (49). Evidence suggests that YY1 transcriptionally represses Fas, which in turns means that YY1 is a significant factor in resistance to Fas-induced apoptosis (45). YY1 anti-apoptotic
38
role is also suggested by its stimulation of Mdm2-mediated p53 degradation (46). YY1 is also shown to function in homologous recombination-based DNA repair (HRR), presumably through its interaction with INO80 chromatin-remodeling complex (52). Furthermore, YY1 interacts with PARP1 stimulating its enzymatic activity and accelerating DNA repair process, in response to genotoxic treatments (53).
3.2 YY1 role in cancer
YY1 role in tumor development and progression has been suggested because of its regulatory activities toward multiple cancer-related proteins and signaling pathways and its deregulation in most cancers (54).
YY1 is overexpressed in a wide range of cancer types including breast, prostate, ovarian, brain, colon, esophagus, pancreas, liver and blood (44). Moreover, in most cases YY1 expression levels are significantly elevated in the metastatic tumor compared to its primary counterpart (55). However, YY1 expression was found to be reduced in some melanomas, pediatric osteosarcomas, and urothelial carcinomas (56). This
39
suggest a dual role of YY1 in cancer development, either through overexpression or underexpression, depending on the tumor type (55).
Increased YY1 expression can correlate with either positive or negative disease outcomes, based on both a given cancer type and the treatment regime employed (57). Indeed, YY1 can facilitate tumor suppression or tumor growth; its role in some cancers appears to promote longer patient survival, whereas in others, it correlates with poorer outcomes and shorter survival (45). For example, higher YY1 level suppresses proliferation, migration and invasion of pancreatic
ductal adenocarcinoma (PDAC) cells through
metalloproteinase MMP10 downregulation. On the contrary, overexpression of YY1 stimulates proliferation and migration, suppressing apoptosis, in laryngeal cancer cells by directly inhibiting MYCT1 (45).
This variability may arise partially from YY1’s ability to interact with multiple transcription factors to facilitate gene activation, repression, or suppression in different cellular contexts (57). Indeed, YY1 has functional interplay with several tumor suppressors. Importantly, YY1 antagonizes p53
40
through several distinct mechanisms and represses the expression of p16, p21 and Fas. On the other hand, YY1 promotes the functions and expression of multiple oncogenes, such as Ezh2, c-Myc and c-Fos. Moreover, as a Polycomb protein, the main function of YY1 in cancer is to modulate epigenetic marks at specific gene loci (54).
YY1 also has been reported to be a prognostic factor for several cancers (58). Therefore, its regulation in cancer along with the development of new therapeutic targets of YY1 may represent promising tools against cancer therapy (55).
3.3 YY1 role in Acute Myeloid Leukemia
YY1 has been reported to play an important role in the pathogenesis of hematologic malignancies (58). Recent studies show an increased YY1 expression in B-cell lymphoma, acute and chronic myeloid leukemia, B and T acute lymphoblastic leukemia, Hodgkin lymphoma, Burkitt lymphoma (56).
Grubach et al, 2008 (60) analyzed the expression levels of Polycomb group (PcG) genes, including YY1, in bone marrow
41
samples from 126 acute myeloid leukemia patients, compared to 20 healthy donors. Their results showed an overexpression of YY1 and the rest of the PcG genes in the AML patients. Erkeland et al, 2003 (59) detected increased YY1 expression in human AML, reporting the importance of YY1 in the
differentiation of neutrophils in a mouse model of (59). These results imply a possible role of perturbed YY1 expression in the development of AML, through interference with the myeloid differentiation program in the leukemic progenitor cells (59, 55).
42 AIM OF WORK
Acute Myeloid Leukemia (AML) is a heterogeneous disease with a different molecular signatures, therapeutic responses, and survival rates. Recent studies suggest that the transcription factor YY1 is overexpressed in AML patients and that it could have a role in the onset of AML differentiation block.
Our aim was to investigate the role and the effect of YY1 downregulation in granulocytic differentiation. To this end we conducted our experiments on HL60 AML cell line, which other than overexpress YY1, is a suitable model to study granulocytic differentiation when these cells are treated with all trans retinoic acid (RA).
We proposed to down-regulate YY1 by short hairpin interference and to investigate if YY1 downregulation could modify the expression of differentiation markers, growth factors and transcription factors important to granulocytic differentiation. We performed our experiments on HL-60 cells untreated and treated with therapeutic doses of RA and have investigated the possibility that YY1 down-regulation could rescue, per se, HL60 cells from the differentiation block or if
43
YY1 could synergize the pro-differentiative effect of RA treatment. Our data suggest that YY1 overexpression may play an important role in the onset of granulocytic differention block.
44 MATHERIALS AND METHODS
Reagents
All-trans-retinoic acid (RA) was from Sigma-Aldrich (Milan, Italy). RA was used at a concentration of 1 µM for up to 96 hours.
Human samples and AML cell lines
Normal CD34+ HSC/HPC and mononuclear CD34− cell fractions were purified from the cord blood of 3 healthy donors using immunomagnetic column separation (Miltenyi Biotec Inc.; Auburn, CA; and STEMCELL Technologies; Cambridge, MA, USA) as previously described (63-64). Cord blood was provided by the UOS Regional Bank of Cord Blood (Dr. Maria Screnci, Rome, Italy). The purity of column-selected CD34+ cells (> 95%) was assessed by flow cytometric (FACS) analysis. Cells were labeled with anti-CD34-APC human (Miltenyi Biotech Inc.) and sorted with the FACS Aria III (Becton Dickinson, BD Biosciences; Franklin Lakes, NJ, USA). Acute myeloid leukemia (AML) samples (n = 10) were obtained from the peripheral blood of newly diagnosed leukemia patients showing more than 60% leukemic infiltration.
45
Cases were classified according to the French-American-British (FAB) classification scheme.
HL-60 cell lines were cultured in RPMI 1640 supplemented with 10% FBS and 1% penicillin-streptomycin. ML-2 and ME-1 cell lines were maintained in RPMI 1640 supplemented with 20% FBS and 1% penicillin- streptomycin. The AML-193 cell line was cultured in Iscove’s MDM supplemented with 10% FBS, 1% penicillin-streptomycin and 20% conditioned medium from the cell line 5637 (DSMZ ACC 35).
Immunophenotypic analysis
Immunophenotyping of the HL60 cell line was performed using direct immunofluorescence staining of cells with APC-conjugated mouse anti-human CD11b (clone ICRF44) and CD14 (clone M5E2; Becton Dickinson Pharmingen). A minimum of 50,000 events was recorded for each sample in a FACSCantoII flow cytometer (BD Biosciences). using FlowJo Flow Cytometric Analysis Software for data analysis.
46
Plasmid constructs and lentiviral infection
To perform knockdown experiments, a short hairpin RNA targeting YY1 was cloned (AgeI-EcoRI) into a Tet Plko.1 puro vector, that is a tetracycline inducible system. sh-YY1
sequence was
5’-CCGGATGACAGGAAAGAAACTTCCTCTCGAGAGGAAGTT TCTTTCCTGTCATTTTTT-3’ and sh scrambled control was 5’-CCGGGCAACAAGATGAAGAGCACCAACTCGAGTTGGTGC TCTTCATCTTGTTGCTTTTT- 3’. Plasmids were verified by sequencing. Lentivirus was produced in HEK293T cells transfected with Tet Plko.1 sh YY1 and Tet Plko.1 puro-sh control constructs using a third-generation lentiviral system. 48 and 72 hours post transfection, the supernatant containing lentivirus particles was collected, concentrated by ultracentrifugation and resuspended in PBS-BSA1%. HL-60 cells were infected twice with concentrated lentiviral particles with the supplement of polybrene 8 µg/ml and selected with Puromycine 0,25 µg/ml. After selection, infected HL-60 cells were kept in culture with a low puromycine concentration of 0,125 µg/ml and treated with doxycycline 300 ng/ml to induce sh-RNA expression.
47
Protein extraction and Western Blot analysis
Total proteins were extracted from cells using homemade RIPA lysis buffer with Proteinase Inhibitors 1x and quantified through a Bradford assay. Equal amounts of protein (50 µg) was denatured, electrophoresed on SDS polyacrylamide gel, and blotted to nitrocellulose membrane (Protan S&S). The following primary antibodies were used for immunoblotting detection: rabbit anti- human YY1 1:600 (sc-1703 Santa-Crutz Biotechnology), rabbit anti-human PARP-1 1:4000 (ALX-210-302-R100 Enzo Life Sciences), rabbit anti-human Bax 1:200 (#2772 Cell Signalling Technology). The mouse anti human α-Tubulin and the mouse anti-human β-actin concentrazione were used to normalize the amount of the samples analyzed. The following horseradish peroxidase-conjugated secondary antibodies were used: mouse polyclonal IgG and anti-rabbit polyclonal IgG. The chemiluminescence reaction was performed with ECL (Amersham Biosciences), and images were captured using a Chemidoc. Bands quantification was performed with Image J program.
48
RNA extraction and analysis
Total RNA was extracted from cells using the TRIzol RNA isolation system (Invitrogen/ThermoFisher Scientific; Waltham, MA, USA). cDNA was made from the extracted total RNA (1 µg) with the High Capacity RNA-to-cDNA Kit (Applied Biosystems). HOXA2, HOXD13, CEBP-α, CEBP-δ, CEBP-ε, CD11b, CD14, GM-CSFr, CSF-1, G-CSFr, CSF-2, M-CSFr, CSF3, MPO, RAR-α, RXR GAPDH cDNA levels were measured by quantitative RT-PCR using the following primer pairs: HOXA2 F5’-ACCCCGAAGGGTGGAGATT-3’ R5’-CGGAGTCCTCAAGGCTTTTACAT-3’ HOXD13 F5’-CTTCGGCAACGGCTACTACAG-3’ R5’-TGACACGTCCATGTACTTCTCC-3’ CEBPα F5’-AACACGAAGCACGATCAGTCC-3’ R5’-CTCATTTTGGCAAGTATCCGA-3’ CEBPδ F5’-AGCGCAACAACATCGCCGTG-3’ R5’-GTCGGGTCTGAGGTATGGGTC-3’ CEBPε F5’-CAGCCACTCGAGTTCTCAGG-3’
49 R5’-TGGCTTCACGGCAAAGAGAT-3’ GMCSF-r F5’-CAACGAATGTTCGTGCACAT-3’ R5’-CAGTTCATTAAATCCGCATTG-3’ GCSF-r F5’-TCATGAACCTCACAACCAGC-3’ R5’-AGCGCATTCTCTGCCTGCA-5’ MCSF-r F5’-GTGCTCAGCCAGCAGCGTTG-3’ R5’-AGGAGTAGTTGCCGGCATG-3’ CSF2 F5’-CTGAACCTGAGTAGAGACAC-3’ R5’-GGCAGTGCTGCTTGTAGT-3’ CSF3 F5’-ACAGTGCACTCTGGACAGTG-3’ R5’-ACAGCTTGTAGGTGGCAC-3’ CSF1 F5’-CCTTGACAAGGACTGGAATA-3’ R5’-GGTACAGGCAGTTGCAATCA-3’ MPO F5’-AGGAGGCCAAGCAGCTGGT-3’ R5’-AGCCACGTGCAGGTAGTCA-3’ CD11b F5-CAGACAGGAAGTAGCAGCTCCT-3’ R5’-CTGGTCATGTTGATGAAGGTGCT-3’ CD14 F5’-CGCTCCGAGATGCATGTG-3’ R5’-TTGGCTGGCAGTCCTTTAGG-5’
50 RARα F5’-ATCATCAACAAGGTGACCCG-3’ R5’-TGTTTCGGTCGTTTCTCACA-3’ RXR F5’-CCAGTACTGCCGCTACCAGA-3’ R5’-CTGGTCGACTCCACCTCATT-3’ GAPDH F5’-ATGCCATCACTGCCACCCAG-3’ R5’-GCCTGCTTCACCACCTTCTTG-3’
All reactions were performed in triplicate on three independent cell cultures. Quantitation was performed using the SYBR Green dye detection method. Values obtained for each sample were quantified versus GAPDH cDNA levels and calculated following the 2 −ΔΔCT method.
Morphological analysis
HL-60 cell morphology was evaluated by staining cytospin (8 min at 900 rpm) with Wright-Geimsa solutions, according to manufacturer’s instructions. Imaging was performed with the microscope NIKON ECLIPSE 80i.
51
Apoptotic assays
Apoptotic cell death was evaluated using APC Annexin-V Apoptosis Detection Kit with PI (BioLegend). Cells were then stained using Annexin-V/APC and PI according to the manufacturer’s instruction. Cell populations were acquired using FACSCantoII flow cytometer (BD Biosciences). Flow cytometric analysis was performed using FlowJo Flow Cytometric Analysis Software.
Statistical analysis
All data were expressed as mean ± DS and the ± DS are represented by error bars. The statistical significance was calculated by one-tailed Mann-Whitney non-parametric test using GraphPad Prism 5 and p.value ≤ 0.05 was considered as significant. The experiments were done at least 3 times in duplicate unless otherwise stated.
52 RESULTS
YY1 expression in AML samples and AML cell lines
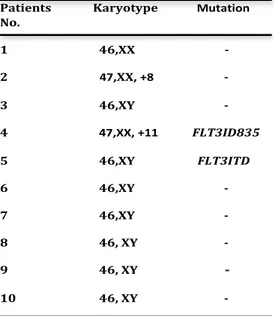
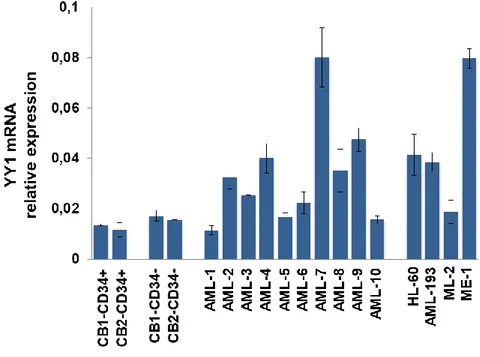
In order to confirm YY1 overexpression in AML patients, as reported by Grubach et al, 2008 (60) and Erkeland et al, 2003 (59), we analyzed YY1 expression in #10 AML patient samples (Table 1) and 4 AML cell lines, HL-60, AML-193, ML-2 and ME-1. qRT-PCR analysis revealed increased YY1 mRNA levels in the majority of AML samples and AML cell lines, compared to 2 CD34+ hHSC/MPP samples and 2 CD34- mature cell samples co-purified from umbilical cord blood of 2 healthy donors (Figure 1).
53
Table 1. Patient Characteristics Patients Karyotype Mutation No. 1 46,XX -2 47,XX, +8 -3 46,XY -4 47,XX, +11 FLT3ID835 5 46,XY FLT3ITD 6 46,XY -7 46,XY -8 46, XY -9 46, XY -10 46, XY
-54
Figure 1: YY1 expression in AML samples and AML cell lines.
qRT-PCR to detect YY1 expression in 10 AML patient samples and 4 AML cell lines (HL-60, AML-193, ML-2, ME-1) compared to 2 CD34+ hHSC/MPP samples (CB1 and CB2-CD34+) and 2 CD34- mature cell samples(CB1- and CB2-CD34-) from cord blood (CB) of healthy donors. Expression levels were normalized to GAPDH levels. Each sample was analyzed in triplicate.
HL-60 cell line was chosen, for our studies, as it other than overexpress YY1 represents a suitable model of granulocytic differentiation when RA treated (61).
55
Effect of YY1 knockdown on differentiation markers, growth factors/receptors and transcription factors in HL-60 cell line
To investigate if YY1 overexpression interferes with myeloid differentiation program, we downregulated YY1 in HL-60 cell line by using a doxycycline inducible lentiviral vector expressing a short hairpin against YY1 mRNA. Western blot analysis, shown in Figure 2, assessed a reduction of about 60% in YY1 protein level, normalized on β-actin protein level, 120h after doxycycline induction (300 ng/ml) in sh-YY1 doxy cells compared to control sh-doxy cells, which expressed a scrambled short hairpin (Figure 2a). To confirm YY1 knockdown, we evaluated the expression of HOXA2 and HOXD13 genes in sh-YY1 doxy cells compared to sh-doxy cells. HOXA2 and HOXD13 are reported to be transcriptionally repressed by YY1 (62, 63). We observed that YY1 downregulation causes an increase of mRNA level of these genes, as expected (Figure 2b).
56 Figure 2: YY1 knockdown in HL-60 cell line.
Panel A: western blot assessing YY1 protein level in HL-60 cell lineinfected with a doxycycline inducible lentiviral vector expressing a short hairpin against YY1 mRNA (sh-YY1-doxy) and a scrambled short hairpin (sh) induced (sh-doxy) or not with doxycycline 300 ng/ml for 120 hours. YY1 protein level was normalized on β-actin protein level. Histogram reports densitometric analysis. Panel B: qRT-PCR to detect HOXA2 and HOXD13 mRNA level in sh and sh-YY1 HL-60 cells induced or not with doxycycline. Expression levels were normalized to GAPDH levels. Each sample
57
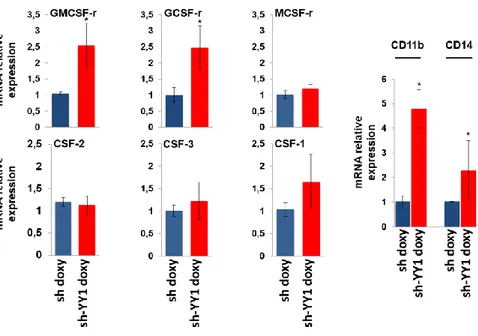
was analyzed in triplicate. Statistical analysis was performed in triplicate using the nonparametric Mann-Whitney test. P-value < 0.05 =*; SD, standard deviation. On these cells, by qRT-PCR analysis, we evaluated the expression of the extrinsic growth factors and relative receptors involved in myeloid differentiation. We analyzed the mRNA expression of: CSF-3 (colony stimulating factor 3) and GCSF-r (granulocyte colony stimulating factor receptor) that stimulate granulopoiesis; CSF-1 (colony stimulating factor 1) and MCSF-r (macrophage colony stimulating factor receptor) regulating monocyte-macrophage transition; CSF-2 (colony stimulating factor 2) and GMCSF-r (granulocyte-macrophage colony stimulating factor receptor). Results in Figure 3 showed that GMCSF-r and GCSF-r mRNA level significantly increase in sh-YY1-doxy cells compared to sh-doxy-cells, while CSF-2, CSF-1, MCSF-r and CSF-1 expression differences were not significant in YY1 knockdown cells, according to the non-parametric Mann-Whitney test analysis.
Furthermore, since the presence of surface antigen is identifier of cell differentiation status and cell type (1), we quantified the expression of CD11b and CD14 surface antigens that stain granulocytic and monocytic differentiation
58
respectively. Our data (Figure 3) indicate that CD11b but also CD14 are significantly overexpressed in sh-YY1-doxy cells when compared to control sh-doxy cells.
Figure 3: Effect of YY1 knockdown on the expression of extrinsic growth factors /receptors and surface antigenic markers.
qRT-PCR analysis of GCSF-r / CSF-3, GMCSF-r / CSF-2, MCSF-r / CSF-1, CD11b and CD14 mRNA level in sh-YY1-doxy cells (red bars) compared to sh-doxy cells (blue bars). Expression levels were normalized to GAPDH levels and expressed as fold induction to sh-doxy cells value (=1). Each sample was analyzed in triplicate.
59
Statistical analysis was performed in triplicate using the nonparametric Mann-Whitney test. P-value < 0.05: SD, standard deviation.
We also explored the level of CEBP family transcription factors, which sustains myeloid progenitors commitment (10). In our qRT-PCR experiments (Figure 4), we observed that YY1 downregulation induces a significant upregulation of CEBPɛ and CEBPδ that are reported to be required to granulocytic differentiation (9). However, such changes are not observed in CEBPα mRNA level that is known to influence the lineage choice of precursors to either granulocytic or monocytic direction (10).
60
Figure 4: Effect of YY1 knockdown on CEBP family transcription factors and MPO differentiation marker.
qRT-PCR measuring CEBPα, CEBPɛ, CEBPδ and MPO mRNA relative expression performed in sh-YY1-doxy cells(red bars) compared to sh-doxy cells (blue bars). Expression levels were normalized to GAPDH levels and expressed as fold induction to sh-doxy cells value (=1). Each qRT-PCR amplification was performed in triplicate Statistical analysis was performed in triplicate using the nonparametric Mann-Whitney test. P-value < 0.05 =*; P-value < 0.001 =***. Error bars: SD, standard deviation.
The results reported so far suggested that the reduction of YY1 protein level in HL-60 cells significantly increased the expression of factors sustaining the myelopoiesis (GCSFr, GMCSFr, CEBP-ɛ and CEBP-δ) and of the granulocytic differentiation markers CD11b and CD14. Thus, we assessed the expression of myeloperoxidase activity (MPO). MPO synthesis is known to be associated with the promyelocyte stage of myeloid differentiation; in particular, the downregulation of MPO gene transcription is associated with granulocytic cell maturation (64). Our expression data (Figure 4) underline a significant reduction of MPO mRNA level in sh-YY1-doxy cells compared to control cells, in agreement to how much evidenced by previous data. These observations show
61
how YY1 knockdown is able to sustain the expression of cytokines, transcription factors and differentiation markers directly involved in myeloid differentiation and in particular in granulocytic differentiation.
Effect of YY1 knockdown on the main regulators of granulocytic differentiation in HL-60 cells treated or not with Retinoic Acid
It is known that HL-60 cell line is a model of granulocytic differentiation when treated with all trans retinoic acid (RA). Indeed, RA treatment activates the transcription of genes necessary for myeloid cell differentiation (61). Besides, our data indicate that YY1 knockdown could affect granulocytic differentiation programs. Therefore, we aimed to investigate YY1 knockdown effect on the activation of granulocytic differentiation pathway induced by RA. For this purpose, we treated, with pharmacological doses of RA (1μM), sh-YY1-doxy cells and sh-sh-YY1-doxy control cells. We analyzed cells at different time of treatment: a standard time course, from 24 to 96 hours, and a shorter time course - from 2 hours and 30 minutes to 10 hours – for some transcription factors that are
62
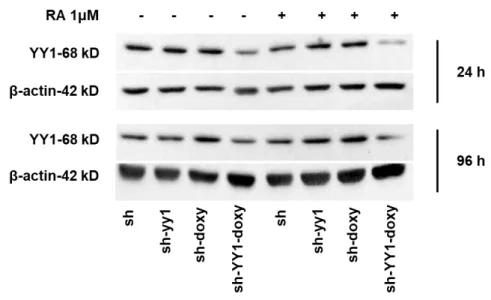
usually induced by a short exposure to RA, were run. Western blot analysis at 24 and 96 hours after RA induction, confirmed YY1 knockdown in sh-YY1-doxy cells (Figure 5).
Figure 5: YY1 knockdown in HL-60 cell line treated with RA for 96 hours.
Western blot analysis of YY1 protein level in sh and sh-YY1 cells induced or not with doxycycline performed at 24 and 96 hours after RA (1μM) treatment. YY1 protein level was normalized on β-actin protein level.
63
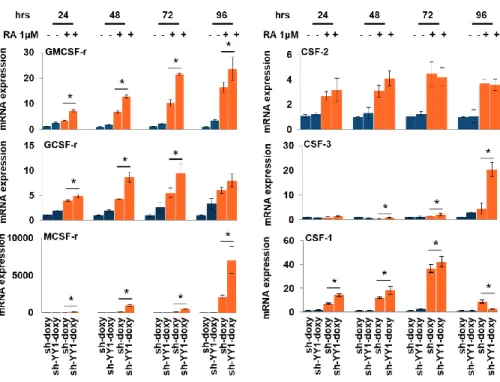
By qRT-PCR, we analyzed the same panel of growth factors and transcription factors fundamental for myelopoiesis previously analyzed. We compared their expression levels in HL-60 cells not expressing but carrying a scramble sh (sh), in HL-60 cells not expressing but carrying a sh against YY1, and in HL60 cells where the expression of the scramble sh and of the sh specific for YY1 was induced by doxycicline treatment. We observed that GMCSF-r and GCSF-r mRNA level increased when cells are treated with RA, but this upregulation, was significantly enforced by YY1 knockdown. This occurred in a time dependent manner: from 24 to 96 hours, from RA induction, for GMCSF-r and at 24, 48 and 72 hours for GCSF-r (Figure 6). Furthermore, CSF-3, whose expression is unchanged in sh-YY1-doxy cells, reached a maximum significant upregulation in YY1 knockdown cells at the 96 hours time point, even if a significative difference was evident also at earlier time points. The non-parametric Mann-Whitney test indicated that CSF-2 expression differences are not significant when RA sh-YY1-doxy and RA sh-doxy cells were compared. Our data also indicated the existence of a
64
synergistic effect between YY1 knockdown and RA treatment on MCSF-r and CFS-1 expression. (Figure 6).
*
Figure 6: Effect of YY1 knockdown and RA treatment on growth factors /receptors gene expression.
qRT-PCR analysis of GCSF-r / CSF-3, GMCSF-r / CSF-2, MCSF-r / CSF-1, mRNA level in sh-YY1 doxy cells and sh-doxy cells treated (orange bars) or not (blue bars)
65
with RA 1µM for 24, 48, 72 and 96 hours. Expression levels were normalized to GAPDH levels and expressed as fold induction to sh-doxy cells value (=1). Each sample was analyzed in triplicate. Statistical analysis was performed in triplicate using the nonparametric Mann-Whitney test. P-value < 0.05 =*; P-value < 0.01 =**. Error bars: SD, standard deviation.
We also analyzed (Figure 7) the mRNA expression of CEBPs family transcription factors. Our data show that YY1 downregulation not only increased significantly CEBP-ɛ and CEBP-δ expression but significantly enhanced RA induced CEBP-ɛ and CEBP-δ upregulation. As regard mRNA CEBP-α expression, we noticed that although the downregulation of YY1 was not able to change the basal expression levels, when cells were treated with RA we measured a significant synergistic effect between YY1 reduction and RA treatment after 2 hours and 30 minutes of treatment. Furthermore, our analysis on mRNA MPO transcription level suggested that YY1 downregulation synergistically reinforced the reduction of expression induced by RA treatment, in a time dependent manner (Figure 7).
66
Figure 7: Effect of YY1 knockdown and RA treatment on CEBPs transcription factors and MPO expression.
qRT-PCR to quantify CEBP-α, CEBP-ɛ, CEBP-δ and MPO expression in sh-YY1 doxy cells and sh-doxy cells treated (orange bars) or not (blue bars) with RA 1µM for 24, 48, 72 and 96 hours. Expression levels were normalized to GAPDH levels and expressed as fold induction to sh-doxy cells value (=1). Each qRT-PCR amplification was performed in triplicate. Statistical analysis was performed in triplicate using the nonparametric Mann-Whitney test. P-value < 0.05 =*; P-value < 0.01 =**. Error bars: SD, standard deviation.
67
Overall, our findings seemed to indicate that YY1 knockdown is per se capable of activate the granulocytes-macrophage
differentiation pathway and that, moreover, YY1
downregulation synergized RA-induced effects on the same pathway.
Effect of YY1 downregulation on granulocytic differentiation markers in HL-60 cells treated or not with RA
To better identify and characterize the differentiation status of RA treated sh-YY1-doxy cells, we evaluated the expression of CD11b and CD14 surface markers by qRT-PCR and immunophenotypic assay and performed cell morphology analyses. sh-YY1-doxy cells and control sh-doxy cells were treated with RA at different time points (from 24 to 96 hours). qRT-PCR analyses revealed that CD11b mRNA level is significantly increased by YY1 knockdown in a time dependent-manner, from 24 to 96 hours of RA treatment (Figure 8A). Immunophenotypic analysis confirmed these data. Indeed, RA treated sh-YY1-doxy cells exhibited an higher percentage of CD11b positive cells (Figure 8B) respect
68
to RA treated control sh-doxy cells; 30,7±3,1% vs 15,00±5% after 72 hours of RA treatment and 73,6±3% vs 36,00±6% after 96 hours of treatment, in figure 8B is reported the best replicate.
Figure 8: Effect of YY1 knockdown and RA treatment on surface differentiation markers.
Panel A: qRT-PCR assessing CD11b and CD14 mRNA level in sh-YY1 doxy cells and sh-doxy cells treated (orange bars) or not (blue bars) with RA 1µM for 24, 48,
69
72 and 96 hours. Expression levels were normalized to GAPDH levels and expressed as fold induction to sh-doxy cells value (=1). Each sample was analyzed in triplicate. Statistical analysis was performed in triplicate using the nonparametric Mann-Whitney test. P-value < 0.05 =*; P-value < 0.01 =**. Error bars: SD, standard deviation. Panel B: immunophenotypic analysis to detect the % of CD11b positive cells 72 and 96 hours after RA treatment in sh-doxy and sh-YY1 doxy cells. The experiment was repeated three times at the same conditions and the best replicate is reported.
Besides, CD14 resulted to be significantly upregulated mainly at 72 and 96 hours after RA induction in sh-YY1-doxy cells compared to control cells, according to qRT-PCR analysis, but no difference was shown by the immunophenotype analyses for CD14 positivity of the same samples (data not shown).
Effect of YY1 knockdown on cell morphology and on the expression of RARα gene in HL-60 cells treated or not with RA
Morphologic analyses of untreated and RA treated sh-YY1-doxy versus untreated and RA treated control sh-sh-YY1-doxy cells displayed signs of cell maturation even in untreated sh-YY1-doxy cells when compared to their control counterpart.
70
Differentiation signs, such as chromatin condensation with nuclear segmentation, increased granulation and reduced cytosolic basophilia were particularly evident in RA treated sh-YY1-doxy vs RA treated sh-doxy cells at the different time points analyzed (24,72 and 96 hours) with a surprising evidence at 96 hours. Overall, these data show that YY1 downregulation may be very effective in synergize the therapeutic effect of RA treatment, at least in HL-60 promyelocitic cell line (Figure 9A).
RA through its binding to the retinoic acid receptors, such as RARα/RXR, activates transcription of the main regulators of myeloid commitment. Conversely, RA fails to induce differentiation in cells with dysfunctional RAR signaling, mainly due to the genesis of fusion products or to epigenetic changes (12). We tested the hypothesis that the overexpression of YY1 could be one of the epigenetic players responsible for a dysfunctional RAR signaling. Therefore, we investigated YY1 knockdown effect on RARα and RXR expression in RA treated and untreated cells. Data reported in Figure 9B showed that YY1 downregulation induced a significant increase of mRNA RARα transcription level, compared to untreated sh-doxy
71
control cells. In addition, RARα upregulation appeared enanched when sh-YY1-doxy cells were treated with RA (Figure 9B). No effect was measured for RXR expression level (data not shown).