Leaf proteome modulation
and cytological features of seagrass
Cymodocea nodosa in response
to long‑term high CO
2
exposure
in volcanic vents
Amalia Piro
1,5, Letizia Bernardo
2,5, Ilia Anna Serra
1, Isabel Barrote
3, Irene Olivé
3,4,
Monya M. Costa
3, Luigi Lucini
2, Rui Santos
3, Silvia Mazzuca
1,5*& João Silva
3,5Seagrass Cymodocea nodosa was sampled off the Vulcano island, in the vicinity of a submarine volcanic vent. Leaf samples were collected from plants growing in a naturally acidified site, influenced by the long‑term exposure to high CO2 emissions, and compared with others collected in a nearby meadow living at normal pCO2 conditions. The differential accumulated proteins in leaves growing in the two contrasting pCO2 environments was investigated. Acidified leaf tissues had less total protein content and the semi‑quantitative proteomic comparison revealed a strong general depletion of proteins belonging to the carbon metabolism and protein metabolism. A very large accumulation of proteins related to the cell respiration and to light harvesting process was found in acidified leaves in comparison with those growing in the normal pCO2 site. The metabolic pathways linked to cytoskeleton turnover also seemed affected by the acidified condition, since a strong reduction in the concentration of cytoskeleton structural proteins was found in comparison with the normal pCO2 leaves. Results coming from the comparative proteomics were validated by the histological and cytological measurements, suggesting that the long lasting exposure and acclimation of C. nodosa to the vents involved phenotypic adjustments that can offer physiological and structural tools to survive the suboptimal conditions at the vents vicinity.
The Mediterranean submarine volcanic vents are natural sources of CO2 since this gas is the main component of the volcanic emissions that have been happening for hundreds of years, forming unique and extraordinary environments in which the relative abundance of dissolved inorganic carbon (Ci) species is altered by an increase in the partial pressure of CO2 (pCO2), with a consequent drastic reduction in seawater pH1,2. In these special
acidic environments, marine ecosystems suffer from a drastic remodeling; while the pioneering studies on ocean acidification focused on how it negatively affects some species while favoring others3, more recent evidence
exists on the large ecological effects on herbivores, invertebrates4–7 and on intra-community processes within
seagrass meadows exposed to acidic conditions8,9. Seagrasses have been reported to be Ci-limited in the marine
realm10–12, using CO2 and bicarbonate (HCO3-) as external Ci sources for photosynthesis10. Recent studies on
ocean acidification have also aimed at resolving the question of whether seagrasses can fix an increasing amount of inorganic carbon (Ci) in the future, thus providing a way forward to their survival while alleviating the effects a more acidic seawater in their associated ecosystems (12 and references therein,13–16).
Volcanic vents create, in the present, the necessary acidified conditions to evaluate the long-lasting effect of high pCO2 exposure on acclimated populations of marine plants, which is a mandatory requirement to under-stand the plant’s real and sustained behavior17. Studies conducted in naturally acidified conditions at several
OPEN
1Laboratory of Plant Biology and Plant Proteomics (Lab.Bio.Pro.Ve), Department of Chemistry and Chemical
Technologies, Università della Calabria, Ponte Bucci 12 C, 87036 Rende, CS, Italy. 2Department of Sustainable
Food Process, Università Cattolica Sacro Cuore, Via Emilia Parmense 84, 29122 Piacenza, Italy. 3CCMAR – Centre
of Marine Sciences, University of Algarve, Campus of Gambelas, 8005-139 Faro, Portugal. 4Departamento
de Biología, Facultad de Ciencias del Mar Y Ambientales, Universidad de Cádiz, Cádiz, Spain. 5These authors
contributed equally: Amalia Piro, Letizia Bernardo, Silvia Mazzuca and João Silva. *email: silvia.mazzuca@
volcanic sites have provided contrasting results, often suggesting species-specific responses to increased pCO28,9,18. An ecological assessment of Cymodocea nodosa at a shallow acidified site at Volcano Island (Italy) revealed that the meadow is negatively affected by the environmental conditions at the low pH site, as the plant’s density and biomass decreased8,9; authors also reported a decrease in leaf area in plants acclimated to the CO
2 vents. This latter finding, along with similar studies, strongly suggests that the acclimation of seagrasses to the long-lasting high pCO2 concentration encompasses several physiological and morphological adjustments. It is relevant to note that some biomechanical responses of C. nodosa were altered in the course of a CO2 enrichment experiment19 and that changes in plant anatomy and cell ultrastructure have been reported for Halodule wrightii under ocean acidification conditions20. These observations are in line to those previously observed in terrestrial plants, in
which the exposure to high pCO2 induced several anatomical alterations21–23.
On the molecular side, a wider investigation on the gene expression profile, performed in the same population of Cymodocea nodosa in Vulcano island, confirmed the decrease in productivity in plants growing at the high CO2 site24. Contrastingly, the same study reported that productivity significantly increased with Ci availability in plants incubated with artificially CO2-enriched water at a non-acidified control site, supporting the hypothesis that C. nodosa might in general benefit from a higher Ci availability24,25. Taken all together, these results
sup-port the suggestion that volcanic vents may not be ideal analogues for ocean acidification studies and that the observed effects on seagrasses are not merely due to the increased CO2 availability but are also influenced by other environmental factors present at these sites9.
In this controversial scenario, our study aims to elucidate how a well-established natural population of
Cymo-docea nodosa, exposed to the CO2 vents environment at Vulcano Island, modulates its protein metabolism and what specific modifications take place, both at the morphological and functional traits levels, associated to the long-term adaptation process.
Comparative proteomics has been previously applied to seagrasses, revealing the protein molecular dynam-ics for surviving under various conditions26–30 Since the amounts of protein and transcripts corresponding to
the same gene are generally loosely correlated31, the advantage offered by proteomics in the present study is to
reveal changes in protein accumulation induced by high CO2 that cannot have been predicted from the previous transcriptomics investigation24, thus contributing to elucidate the effects of a long-term exposure to naturally
increased pCO2.
Results
Protein yield, proteins identification and differential accumulated proteins in leaf tissues.
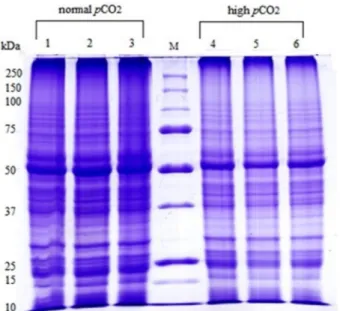
A decrease of 30% in protein yield in leaf tissues of plants growing in high pCO2 comparing to the normal pCO2 condition was found (See the Supplementary Table 1). The SDS-PAGEs of leaf proteins provided well-resolved lanes both in normal and high pCO2 samples. Each lane consists of about 80 different polypeptides bands, dem-onstrating the efficiency of the protein extraction and purification by means of the multistep protocol optimized for C. nodosa28. Spite the same amount of leaf proteins loaded on each well, the band at 55 kDa, correspondingto the large subunit of RuBisCo, decreased in all replicates of plants living in high pCO2 with respect to those under normal pCO2 condition (Fig. 1). Measures from the digitalized images of the gels by the Quantity One 1-D Analysis Software (Bio-Rad Laboratories; Berkley, California) gave a mean decrease of up to 40% in the optical density of the 55 kDa band (data not shown) in the high pCO samples.
Figure 1. 1D-SDS PAGE of proteins from leaves of three biological replicates of Cymodocea nodosa living in
normal (lanes 1,2,3) and in high (lanes 4,5,6) pCO2 environments in Vulcano Island. 25 μg of proteins in each well were loaded. Markers used from Bio-Rad 250–10 kDa.
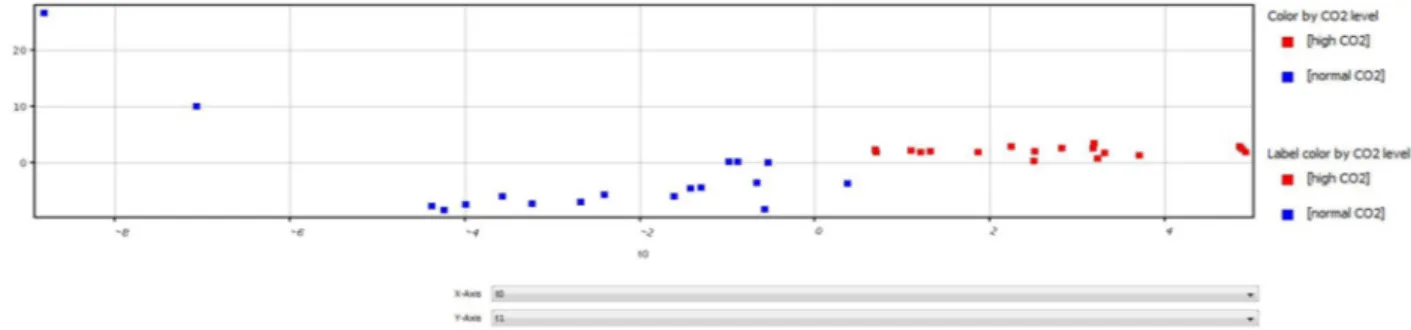
Figure 2 depicts the multivariate classification (PLS-DA) of all mass spectra results from normal pCO2 and high pCO2 plants. Spectra patterns of normal (blue dots) and high (red dots) pCO2 plants are quite distinct. Plants collected in high pCO2 showed a higher degree of homogeneity in comparison to samples collected in normal pCO2.
The mass spectra analysis coupled with database search has identified 190 proteins in all samples (Supplemen-tary Tables 2 and 3). The hierarchical clustering of all identified proteins is shown in Fig. 3. Under the screening criteria of a fold change greater than 2 or less than 0.60 and p value < 0.05, a total of 75 proteins were identified to be differentially abundant (DAPs) by comparison between normal pCO2 and high pCO2 plants; 45 proteins resulted accumulated, while the remaining 30 proteins are depleted. All these proteins were regarded as candidate proteins associated with the high pCO2 adaptation and acclimation processes (Table 1).
The pathway analysis using the Kyoto Encyclopedia of Genes and Genomes (KEGG) pathway database32
(http://www.genom e.jp/kegg/pathw ay.html, accessed on 11 September 2019) identified 6 pathways (p < 0.05) related to proteins with enriched relative abundance, as shown in Fig. 4. Proteins involved in the light reactions of photosynthesis are the most relevantly enriched under the acidified conditions. These include the Photosys-tem II CP43 chlorophyll apoprotein, PhotosysPhotosys-tem II D2 protein, PhotosysPhotosys-tem II CP47 chlorophyll apoprotein, Photosystem Q(B) protein, Photosystem I P700 chlorophyll a apoprotein A2, ATP synthase subunit beta, chlo-roplastic, Cytochrome b6, ATP synthase subunit alpha and the chloroplastic Photosystem I P700 chlorophyll a apoprotein A1 (Table 1). In contrast, the depleted metabolic pathways were those related to carbon fixation, carbon metabolism, glycolysis/gluconeogenesis. The Ribulose bisphosphate carboxylase large chain and the Ribulose bisphosphate carboxylase/oxygenase activase appeared strongly depleted in acidified conditions, as also cytoplasmic and chloroplastic Malate dehydrogenase and Transketolase. The key enzymes of glycolysis
Figure 2. Multivariate classification (PLS-DA) predictions (Mass Profiler Professional Software) of full mass
spectra results from normal pCO2 (blue box) and high pCO2 (red box) C. nodosa samples (All mass spectra of all samples). Horizontal dashed lines indicate the thresholds and vertical dashed lines indicate the separation between samples.
Swiss-Prot ID KEGG* orthology (proteins) Protein Log FC ([high CO2] versus [normal CO2]) Normalized FC (abs) ([high CO2] versus [normal CO2]) Normalized DAPs ([high CO2] versus [normal CO2])
Normalized Molecular Mass (Da) KEGG* orthology
(metabolisms) Metabolism
P0C365 K02705 Photosystem II CP43 chlorophyll
apoprotein 13.134 8993.973 STA 52,246.3 ko00195 Photosynthesis
P0C435 K02706 Photosystem II D2 protein 12.430 5520.685 STA 39,801.0 ko00195 Photosynthesis
P05641 K02704 Photosystem II CP47 chlorophyll
apoprotein 10.513 1461.336 STA 56,276.2 ko00195 Photosynthesis
P0C432 K02703 Photosystem Q(B) protein 8.324 320.653 STA 39,076.0 ko00195 Photosynthesis
P05642 K02635 Cytochrome b6 7.938 245.255 STA 24,310.3 ko00195 Photosynthesis
P19023 K02133 ATP synthase subunit beta,
mitochondrial 7.155 142.595 STA 59,216.4 ko00190
Energy metabo-lism P00827 K02112 ATP synthase subunit beta,
chloroplastic 6.426 86.00222 STA 54,097.0 ko00195 Photosynthesis
P0C387 K02634 Apocytochrome f 6.121 69.602 STA 35,580.5 ko00195 Photosynthesis
A5H454 K00432 Peroxidase 66 5.701 52.048 STA 33,932.3 ko01100 Lipid metabolism
P0C356 K02690 Photosystem I P700 chlorophyll a
apoprotein A2 4.901 29.885 STA 82,672.8 ko00195 Photosynthesis
P12863 K01803 Triosephosphate isomerase,
cytosolic 4.827 28.386 STA 27,252.6 ko00010
Glycolysis/Gluco-neogenesis O24592 K09840 9-cis-epoxycarot-enoid dioxygenase
1, chloroplastic 4.805 27.953 STA 66,007.5 ko01110
Biosynthesis of seconday metabo-lites
P0C2Z4 K02111 ATP synthase subunit alpha,
chloroplastic 4.095 17.091 STA 55,721.0 ko00195 Photosynthesis
P0C353 K02689 Photosystem I P700 chlorophyll a
apoprotein A1 3.406 10.603 STA 83,395.2 ko00195 Photosynthesis
Q41764 K10363 Actin-depolymer-izing factor 3 2.982 7.905 A 16,013.8 ko04812 Signaling and cel-lular processes
Q8W2B7 K13227 DIMBOA UDP-
glucosyltrans-ferase BX8 2.981 7.895 A 49,926.0 ko00402
Biosynthesis of seconday metabo-lites
P46302 K02979 40S ribosomal protein S28 2.980 7.889 A 7,467.6 ko03010 Translation
A1Y2B7 no KO assigned Protein SUPPRES-SOR OF GENE
SILENCING 3 2.933 7.640 A 67,979.5 no KO assigned
No assigned metabolism
P46252 K02943 60S acidic riboso-mal protein P2A 2.763 6.790 A 11,476.7 ko03010 Translation
Q00827 K08912 Chlorophyll a-b binding protein
48, chloroplastic 2.675 6.386 A 28,299.8 ko00195 Photosynthesis
A5H452 K00432 Peroxidase 70 2.449 5.462 A 33,994.0 ko01100 Lipid metabolism
Q9FQA3 K00799 Glutathione trans-ferase GST 23 2.327 5.018 A 24,992.4 ko00480 Glutathione metabolism
B4FGS2 no KO assigned Spindle and
kinetochore-asso-ciated protein 1 2.254 4.769 A 30,488.3 no KO assigned
No assigned metabolism B6TZD1 K08963 Methylthioribose-1-phosphate isomerase 2.205 4.613 A 38,735.5 ko00270 Amino acid metabolism
P46420 K00799 Glutathione S-transferase 4 2.178 4.524 A 24,741.1 ko00480 Glutathione metabolism
P11155 K20115 Pyruvate, phos-phate dikinase 1,
chloroplastic 2.143 4.416 A 103,585.5 ko00710 Carbon fixation
P49101 K06103 Calcium-dependent protein
kinase 2 2.139 4.405 A 58,422.9 ko04131 Exocytosis
B8A031 K03644 Lipoyl synthase, mitochondrial 2.126 4.366 A 42,341.6 ko01100 Lipid metabolism
Swiss-Prot ID KEGG* orthology (proteins) Protein Log FC ([high CO2] versus [normal CO2]) Normalized FC (abs) ([high CO2] versus [normal CO2]) Normalized DAPs ([high CO2] versus [normal CO2])
Normalized Molecular Mass (Da) KEGG* orthology (metabolisms) Metabolism P49094 K01953 Asparagine synthetase [glutamine-hydro-lyzing]
2.126 4.364 A 67,147.1 ko00270 Amino acid metabolism
P0C8M8 K08852 serine/threonine-protein kinase
CCRP1 2.062 4.176 A 70,746.2 ko04141 Protein processing in endoplasmic reticulum O63066 K10956 Preprotein translocase subunit SECY, chloroplastic
2.031 4.086 A 59,637.9 ko04141 Protein processing in endoplasmic
reticulum Q8LPU4 K11303 Histone acetyl-transferase type B
catalytic subunit 2.028 4.079 A 53,119.5 ko03400 DNA repair
C0PF72 K00620
Arginine biosyn-thesis bifunctional protein ArgJ, chloroplastic
2.016 4.046 A 48,407.3 ko01230 Amino acids biosynthesis
Q67EU8 K04482 DNA repair protein RAD51
homolog A 1.998 3.994 SLA 36,989.5 ko03400 DNA repair
Q10717 K16290 Cysteine protein-ase 2 1.976 3.935 SLA 39,712.1 ko01002 Protein degrada-tion
P41978 K04564 Superoxide dis-mutase [Mn] 3.2,
mitochondrial 1.914 3.770 SLA 25,356.4 ko04146 Oxidative stress
P42390 K13222 Indole-3-glycerol phosphate lyase,
chloroplastic 1.888 3.701 SLA 36,691.8 ko00402
Biosynthesis sec-onday metabolites
P00056 K00413 Cytochrome c 1.885 3.695 SLA 12,132.6 ko00190 Energy metabo-lism
P49081 K01638 Malate synthase, glyoxysomal 1.881 3.684 SLA 62,092.2 ko01200 Carbon metabo-lism
Q9XGD5 K00588 Caffeoyl-CoA
O-methyltrans-ferase 2 1.851 3.607 SLA 29,522.0 ko01110
Biosynthesis of secondary metabo-lites
P12959 K21632 Regulatory protein opaque-2 1.815 3.519 SLA 49,812.2 ko03000 Transcription
P23345 K04565 Superoxide dismutase
[Cu-Zn] 4A 1.593 3.017 SLA 15,228.5 ko04146 Oxidativ stress
Q05737 K07874 GTP-binding protein YPTM2 1.558 2.945 SLA 22,646.2 ko04031 Protein transport
P06671 K08913 Chlorophyll a-b binding protein,
chloroplastic 1.427 2.689 SLA 28,165.7 ko00195 Photosynthesis
P0C520 K02132 ATP synthase subunit alpha,
mitochondrial 1.414 2.665 SLA 55,657.7 ko00190
Energy metabo-lism
Q41803 K03231 Elongation factor 1-alpha −7.805 223.659 STD 49,574.4 ko03013 Translation
Q08062 K00025 Malate dehydroge-nase, cytoplasmic −7.712 209.621 STD 35,931.6 ko01200 Carbon metabo-lism
P0C510 K01601 Ribulose bisphos-phate carboxylase
large chain −7.099 137.062 STD 53,450.7 ko00710 Carbon fixation
Q43298 K04077 Chaperonin CPN60-2,
mito-chondrial −6.089 68.074 STD 61,219.3 ko03018 Protein folding
P27923 K02977 Ubiquitin-40S ribosomal protein
S27a −5.271 38.628 STD 17,909.5 hsa03010 Translation
P14640 K07374 Tubulin alpha-1 chain −4.601 24.271 STD 50,414.8 ko04514 Citoskeleton metabolism
Q02245 K07374 Tubulin alpha-5 chain −4.556 23.538 STD 50,251.7 ko04514 Citoskeleton metabolism
Q9ZT00 K19199
Ribulose bisphos-phate carboxylase/ oxygenase acti-vase, chloroplastic
−4.483 22.367 STD 48,108.8 ko00710 Carbon fixation
Swiss-Prot ID KEGG* orthology (proteins) Protein Log FC ([high CO2] versus [normal CO2]) Normalized FC (abs) ([high CO2] versus [normal CO2]) Normalized DAPs ([high CO2] versus [normal CO2])
Normalized Molecular Mass (Da) KEGG* orthology (metabolisms) Metabolism P09315 K05298 Glyceraldehyde-3-phosphate dehydrogenase A, chloroplastic
−4.386 20.907 STD 43,208.4 ko00010 Glycolysis/Gluco-neogenesis
Q7SIC9 K00615 Transketolase, chloroplastic −4.094 17.078 STD 73,391.4 ko01200 Carbon metabo-lism
P24631 K13993 17.5 kDa class II heat shock protein −3.6320088 12.398 STD 17,568.0 ko04141 Protein processing in endoplasmic reticulum P08440 K01623 Fructose-bispho-sphate aldolase,
cytoplasmic −3.430 10.778 STD 39,059.9 ko00010
Glycolysis/Gluco-neogenesis
P26301 K01689 Enolase 1 −2.870 7.313 D 48,290.9 ko00010 Glycolysis/Gluco-neogenesis
P04712 K00695 Sucrose synthase 1 −2.545 5.83469 D 92,129.6 ko00500 Starch and sucrose metabolism
Q43704 K02541 DNA replication licensing factor
MCM3 −2.539 5.811 D 85,694.0 ko03030
DNA replication and repair P15719 K00051 Malate dehydro-genase [NADP],
chloroplastic −2.475 5.560 D 47,429.3 ko01200
Carbon metabo-lism
P0C1M0 K02115 ATP synthase subunit gamma,
chloroplastic −2.464 5.516 D 40,131.4 ko00195 Photosynthesis
P38560 K01915 Glutamine synthetase root
isozyme 2 −2.115 4.332 D 40,492.8 ko00250
Amino acid Bio-synthesis
P18122 K03781 Catalase isozyme 1 −2.073 4.207 D 57,389.9 ko04146 Oxidativ stress
P02582 K06759 Actin-1 −2.058 4.164 D 41,902.1 ko04514 Citoskeleton metabolism
Q6XZ79 K00847 Fructokinase-1 −2.028 4.078 D 34,861.4 ko00500 Starch and sucrose metabolism
Q9SP22 K08057 Calreticulin −1.854 3.616 SLD 48,052.8 ko04141 Protein folding and sorting
O22424 K02987 40S ribosomal protein S4 −1.832 3.561 SLD 30,130.6 ko03013 Translation
Q195N6 K01006
Pyruvate, phos-phate dikinase regulatory protein, chloroplastic
−1.804 3.491 SLD 46,360.8 ko00710 Carbon fixation
B4G072 K13227 DIMBOA UDP-
glucosyltrans-ferase BX9 −1.710 3.272 SLD 50,358.7 ko00402
Biosynthesis sec-onday metabolites
Q9ZSV1 K24070 Poly [ADP-ribose] polymerase 1 −1.698 3.244 SLD 111,614.5 ko03410 Dna repair
P80607 K13379 Alpha-1,4-glucan-protein synthase
[UDP-forming] −1.654 3.148 SLD 41,717.1 ko00520 Carbohydrate metabolism B4FAT0 K11996 Adenylyltrans-ferase and sulfurtransferase MOCS3 2 −1.514 2.856 SLD 52,564.9 ko03013 Translation Q8S4P4 K11430 Histone-lysine
N-methyltrans-ferase EZ3 −1.498 2.824 SLD 102,388.1 ko00270
Amino acid metabolism Q43272 K00131 NADP-dependent glyceraldehyde-3-phosphate dehydrogenase
−1.432 2.698 SLD 53,773.0 ko00010 Glycolysis/Gluco-neogenesis
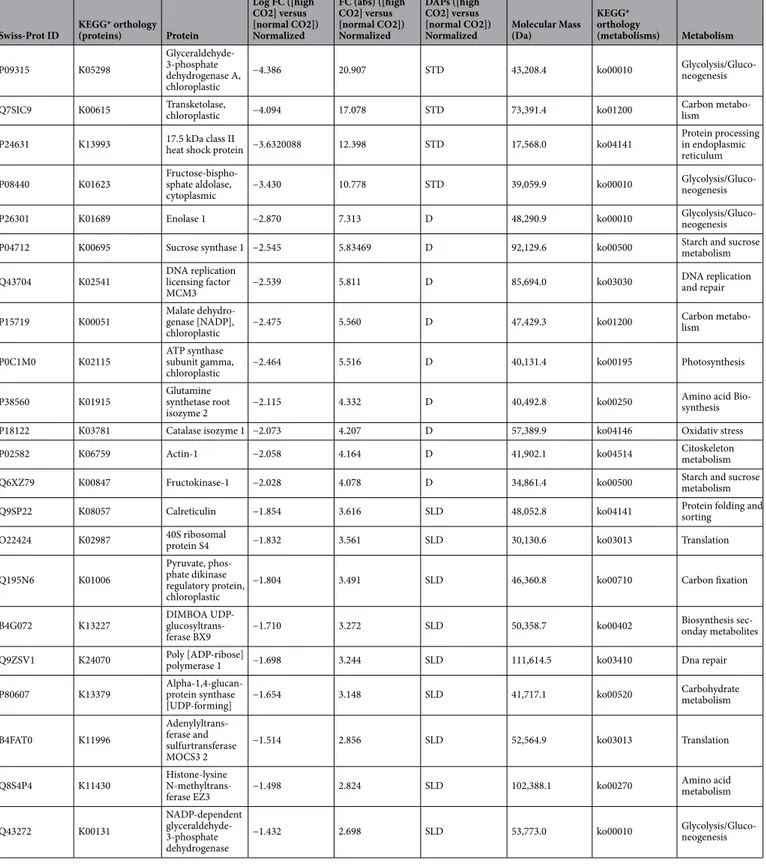
Table 1. Differential abundant proteins (DAPs) in leaf tissue of high pCO2 samples comparing with those of
normal pCO2 samples. Accession number, protein name, fold change expressed as Log (2) and absorbance, protein behavior KEGG orthology, molecular mass and metabolisms have been shown. Strongly accumulated and strongly depleted proteins are reported in bold. Details on mass spectrometry parameters for peptides for each identified proteins are reported in the Supplementary Table 2 STA: Strongly accumulated; STD: Strongly depleted; A: accumulated; D: Depleted; SLA: Slightly accumulated; SLD: Slightly depleted * KEGG codes are developed in the Kanehisa Laboratories
Glyceraldehyde-3-phosphate dehydrogenase A, Fructose-bisphosphate aldolase and Enolase 1 were also depleted. The Malate synthase, that facilitates the glyoxylate cycle, the Pyruvate phosphate dikinase involved in the alter-native glycolisis,, the Serine-threonine protein and many proteins involved in the amino acid metabolism are enriched under acidified conditions. Also the glutathione metabolism seems to be upregulated as the Glutathione transferases are accumulated under acidified condition.
Protein folding and turnover seemed also to be affected under acidified conditions as the Elongation factor 1-alpha, Chaperonin CPN60-2 and Ubiquitin-40S ribosomal protein S27a were strongly depleted. Proteins belonging to the cytoskeleton metabolism are affected by acidification such as Tubulin alpha-1 chain, Tubulin alpha-5 chain and Actin-1 (Table 1).
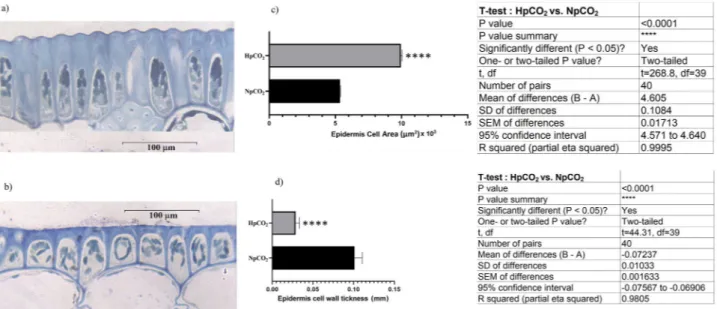
The leaf blades of C. nodosa growing under acidified conditions were shown to be almost 15% wider (3.22 ± 0.43 mm) than those of plants living in normal pCO2 (2.76 ± 0.52 mm); epidermal cells have larger areas and thinner cell walls in high pCO2 leaves than those of normal pCO2 cells (Fig. 5). Leaves growing under acidi-fied conditions have also larger parenchyma cells, lesser number of cells/mm2 and thinner cell wall than those of normal pCO2 cells (Supplementary Table 4).
Schematic representation of DAPs involved in different metabolic pathways/cellular processes in Cymodocea
nodosa to cope the environmental conditions at CO2 vents is reported in the Fig. 6.
Discussion
The comparative proteomics data showed that the long-term exposure to high pCO2 in the vicinity of volcanic vents strongly affected the inorganic carbon assimilation in leaves of Cymodocea nodosa as demonstrated by the significantly decreased levels of the key carbon metabolism enzymes . These results suggest that the chronic exposure of C. nodosa to CO2-enriched volcanic emissions did not act positively toward carbon fixation, neither via Rubisco nor via PEPC, indicating a general depression of both inorganic carbon fixation pathways; even if the accumulation of Malate synthase and Pyruvate dikinase can pose the question whether or not seagrasses have a carbon concentrating mechanism, its existence to date is not proven and more evidence from “omics” is still required.
Our proteomic findings reinforce the results of a gene expression study carried out simultaneously on plants from the same populations, in which a significant down-regulation of the transcripts related to carbon metabo-lism, carbon uptake and carbohydrate metabolism were also found to be strongly down-regulated in the acidified leaves25. Proteomics and trascriptomics thus demonstrate that the long-lasting exposure to the vents conditions
Figure 4. KEGG pathways where the differentially abundant proteins were enriched. The x-axis shows the
proteins involved in the extended KEGG network and pathways. P values were calculated using a modified Fisher’s exact test. Values above the threshold indicate p < 0.05. KEGG pathways are developed by Kanehisa Laboratories32.
Figure 5. Cytological measurements of leaf epidermis of Cymodocea nodosa plants growing in normal and high
pCO2 environments. Epidermal leaf cell microphotographs of C. nodosa growing in normal (a) and high (b)
pCO2 environments. Boxplots (± SD) showing the cell area (c) and cell wall thickness of epidermal thickness (d) of C. nodosa growing in normal and high pCO2 environments.
Figure 6. Schematic diagram of differentially expressed proteins belonging to metabolic pathways/cellular
processes leading to the acclimation/tolerance of Cymodocea nodosa in volcanic vents. The acclimation strategy combines the reduction of carbon fixation, gluconeogenesis, carbohydrate metabolism and protein synthesis with increasing photophosphorylation, cell respiration and aminoacid metabolism to maintain the high energy demand for leaf expansion and elongation of the mesophyll cell; the cell expansion is accomplished by the cell wall loosening, the vacuole enlargement and the cytoskeleton remodeling. Proteins belonging the oxidative stress response pathway, the Gluthatione metabolism and the biosynthesis of secondary metabolites were also accumulated, suggesting that potential external stress factor other than CO2 are at play at the Vulcano submarine vents. Proteins and related KEGG codes, reported also in Table 1, are developed by Kanehisa Laboratories32.
lead to the overall depression of the primary metabolisms, and are the probable cause of the reduction of the net plant productivity (NPP) and plant biomass found in plants growing in the vicinity of the vents8,25.
The metabolism of proteins is also negatively affected; previous proteomics studies of seagrasses living under several acute stressors or long-lasting disturbing factors also reported lower protein content linked to depletion of Rubisco28–30. Here we found that the lower protein contents is mainly due to an impaired protein synthesis
at the post-transcriptional level in leaf tissue of plants under acidified conditions. Also protein function and turnover seems be the machinery that require an increasing energy demand.
Despite the strong depletion of the Calvin cycle proteins, a significant positive correlation between proteins related to the light reactions of photosynthesis and the exposure to high pCO2 was found, the same happening with some proteins belonging to photosystem II and photosystem I. High levels of Chl a and significant increases in maximum electron transport rate and in compensation irradiance were previously found in C. nodosa grown under acidified conditions at this same volcanic CO2 vent, corroborating the hypothesis that acidification pro-motes the photosynthetic light reactions8. Moreover, we found that the energy metabolism from
photophos-phorylation and from oxidative phosphotophos-phorylation are positively affected by high pCO2 exposure; the latter comes from leaf mitochondrial respiration which have been previously found to be up-regulated in the response to high
pCO224,33. The observed depletion of the Calvin cycle proteins near the vents is likely to reflect a higher efficiency
in the use of CO2 that would require a higher energy availability from the photosynthetic electron transport chain. On the other hand, a potential imbalance between the photosynthetic electron transport chain and the Calvin cycle reactions could also result in the formation of reactive oxygen species (ROS).
Increases in ROS may result from a number of other stress factors, and are usually associated with increases in the overall antioxidant capacity. The observed accumulation of antioxidant enzymes such as Peroxidases, Glu-tathione S-transferases, Superoxide dismutases and enzymes belonging the phenylpropanoid pathway has been well documented as defense responses of seagrasses to light stress and heavy metal toxicity27,29. The enhanced
multi-enzyme antioxidant system indicates that vents conditions results in ROS production, triggering the response to scavenge H2O2 and maintaining the cell redox status. Taken all together, our results support the previously conveyed idea that potential external stress factors other than CO2 are at play at the Vulcano submarine vents, significantly affecting the plants’ metabolic balance8,9,34.
The adaptive strategy that plants use to cope with vents condition also involves some morphological adjust-ments. If at the meadow level, C. nodosa lowered the density, biomass and below/aboveground biomass ratio at the acidified site8,9, at plant level, no significant differences in number of leaves per shoot (total mean number
of leaves per shoot was 4 ± 0.7, data not shown) was found. Interestingly, we found that plants growing closer to the vents had shorter but wider leaf blades, epidermal cells with thinner cell walls and larger parenchyma cells. These morphological differences could indicate ecotypes, eventually selected by this extreme environment, but results from the population genetics carried out on the same sampling site showed no genetic differentiation and a high gene flow between C. nodosa plants growing at both the acidified and the control sites25. The
morphologi-cal differences found should then be considered as a phenotypimorphologi-cal response of C. nodosa to the pressure of the acidified environment. A similar pattern of leaf parameters was also recently described at the Vulcano CO2 vents by Vizzini et al.9. Our data support the hypothesis that under acidified conditions the cell expansion contributed
more than cell division to the leaf expansion; following this assumption, leaf blades become shorter and wider than those grown in normal pCO2 condition. Further studies conducted on C. nodosa and Halodule wrightii demonstrated that an elevated CO2 concentration has effects on leaf mechanical resistence such as on the leaf anatomy and cell ultrastructures19,20. The authors reported that high pCO
2-grown C. nodosa had an increased leaf-breaking force related to leaf growth; leaf width and cross-section area were larger under acidification in
Halodule wrigtii, thus indicating that increased CO2 may manifest in large part at cellular level. Here we might conclude that the morphological traits have shown a positive correlation between mesophyll cell size and pH at CO2 venting sites, suggesting that wider leaves have a higher capacity to buffer pH. Even if is demonstrated that exposure to elevate pCO2 alters plant structure by inducing change in rate of cell division and cell expansion in seed plants35, further investigation needs to elucidate whether C. nodosa growing in the vicinity of volcanic
vents might ameliorate potential adverse effects on growth by means the mesophyll cell expansion and modified cell water uptake. In support of this idea, Ruocco et al.24 found that C. nodosa exposed to high pCO
2 overex-pressed transcripts encoding for enzymes that play an integral role in pH homoeostasis of the cells. Under this concept, mesophyll cells of C. nodosa might couple the ions homeostasis with increased water uptake to adjust the osmotic balance.
Moreover, specific molecular rearrangements seem to validate the hypothesis that high pCO2 led to larger cell size; biosynthesis of secondary metabolites appeared to be positively related to acidification and also to hormone-mediated response such ABA biosynthesis36–38. The actin-depolymerizing Factor 3 coupled with the
Calcium-dependent protein kinase 2 (CDPK) have been found to modulate the plant cell shape through the regulation of the actin filament network in cytoskeleton39 and also to have a role in the re-organization of plant
cytoplasm in response to a wide range of internal and external stimuli, suggesting a direct correlation between signal transduction and actin cytoskeleton reorganization in plants40,41. The strong depletion of tubulin and actin
cytoskeleton constituents further support the suggestion that acidification affects the cytoskeleton dynamics and might trigger the modulation of cell enlargement and elongation in mesophyll cells. A pattern of thinner cell walls was also found in mesophyll epidermal cells of plants growing in the acidified site. Seagrasses possess a very different cell wall composition as well as proportion of polysaccharide and monosaccharides than terres-trial plants42; the modified cell wall structure and metabolism lead to an increase in the polyanionic character of
seagrass cell wall43. It is well known that an acid cell wall is necessary for wall loosening to occur, thus
promot-ing cell expansion and growth44; this mechanism is induced by the hormone auxin during cell elongation. In
seagrasses, under normal conditions, the extracellular carbonic anhydrase mediates the conversion of HCO3– to CO2 generating acid zones created by H+ extrusion from the cytoplasm to the cell wall11; we can speculate that
in an acidified environment the increased exogenous protons could, at least partially, substitute auxin in induc-ing cell enlargement. The thinner cell wall found in acidified epidermal cells of C. nodosa is likely to come from the cell elongation without ex novo biosynthesis of structural wall carbohydrates, due to the impaired primary metabolism and depressed carbon fixation; the lowered biomass of plants exposed to high pCO2 also indicates that leaf elongation occurred mainly by means of cell expansion. Thus, cell wall seems to be a critical player in response to acidification and further studies on the cell wall metabolism of C. nodosa growing near Vulcano CO2 vents are necessary.
In conclusion, proteomic analysis and cytological features evidence some physiological and structural adap-tive traits of the seagrass Cymodocea nodosa growing in the vicinity of the Vulcano CO2 vents. This adaptation strategy combines the reduction of carbon fixation and gluconeogenesis with increasing photophosphorylation and cell respiration to maintain the high energy demand for leaf expansion and elongation of the mesophyll cell. Our results largely corroborate the findings of previous metabolic and transcriptomic studies carried out in the Vulcano vents, raising additional concerns on the use of volcanic vents as proxies for future acidification conditions. On the other hand, the specificities of the volcanic emissions also raise interesting questions and allow the investigation of pertinent physiological questions.
Methods
Sites description and plant sampling.
Vulcano, the southernmost island of the Aeolian Archipelago, contains the most recently active center of submersed CO2 vents systems1. The most recent CO2 emissions origi-nated from a volcanic activity on Vulcano occurred in 2002 has caused a series of gas explosions2. Most ofthe active submersed seeps are located along southern and western shores of Baia di Levante, where dispersed underwater leaks cover a 0.13 km2 shallow area (1 m depth). Gas composition at the seeps consists of 99% of carbon dioxide and dissolved hydrogen sulphide from the seeps was undetectable at the sampling locations; seawater parameters, daily irradiance and pCO2 concentration at two sites were reported in Olivé et al.25.
For molecular analyses, C. nodosa samples (i.e., morphological individuals with two or more shoots) were collected at 5 m depth by SCUBA diving in the acidified site referred as high pCO2 environment (38°25.057′N-14°57.599′E) and in a nearby site referred as normal pCO2 environment (38° 25′ 22″ N-14° 57′ 82″ E)25. To assure the representation of the seagrass meadows in the study sites, sampling were performed along
three grids of 20 × 20 m each with the internal distance between sampled plants of 4–5 m to reach a total sampling of 15 individuals at each site. Once collected, epiphytes on leaf surface were rapidly and carefully removed by a razor, then leaves were rinsed in distilled water and immediately frozen in liquid nitrogen and kept at -80 °C until the protein extraction procedure described in Mazzuca et al.30.
For the histological and cytological analyses adult leaves were selected from the 15 individuals at each sam-pling site, cleaned from the epiphytes, washed in sea water and fixed in 4% formalin in 0.15 M phosphate buffer pH 7.2 and stored refrigerated.
Extraction and purification of total protein from leaves.
Frozen leaves were pooled forming 3 bio-logical replicates, each composed by 5 individuals, because of the low amount of leaf tissue for each shoot. Leaf proteins were extracted by the multistep procedures28; for each extraction 1.4 g of pooled leaves were powderedin a mortar in liquid nitrogen until a fine powder was obtained. At this powder a volume of 10% TCA in acetone was added and centrifuged at 13,000 rpm for 5 min at 4 °C. Subsequently, four washes were performed in 80% acetone in water. After centrifugation the pellet containing the precipitated proteins was dried at room tempera-ture. Approximately 0.1 g of powdered tissue was dissolved in 0.8 ml of phenol (buffered with Tris–HCl, pH 8.0, Sigma, St. Louis, MO, USA) and 0.8 ml of SDS buffer (30% sucrose, 2% SDS, 0.1 M Tris–HCl, pH 8., 0,5% 2-mer-captoetanol) in a 2 ml microfuge tube. The samples were vortexed for 30 s and centrifuged at 13,000 rpm for 5 min to allow the solubilization of proteins in the phenol phase. The phenol phase was mixed with five volumes of 0.1 M ammonium acetate in cold methanol, and the mixture was stored at -20 °C for 30 min to precipitate proteins. Proteins were collected by centrifugation at 13,000 rpm for 5 min. Two washes were performed with 0.1 M ammonium acetate in cold methanol, and two with cold 80% acetone, and centrifuged at 13,000 rpm for 7 min. The final pellet containing purified protein was dried and dissolved in Laemmli 1DE separation buffer overnight. Proteins were then quantified by measuring the absorbance at 595 nm according to the Bradford assay. Protein yield was calculated as milligrams of protein for g fresh tissue weight in three biological replicates at each site. For each replicate, two independent extractions were made. The relative abundances of proteins were calculated as mean ± standard error (n = 6). A Student t-test was used to make pair-wise comparisons between normal pCO2 and high pCO2 samples. Unless otherwise noted, p-levels of 0.05 were used as the threshold for statistical significance.
Electrophoresis of leaf proteins, protein in‑gel digestion and mass spectrometry analyses.
A gel was prepared at a concentration of 10% acrylamide/bisacrylamide, according to the method of45. The ratio ofacrylamide/bisacrylamide was 12.5% in the running gel and 6% in the stacking gel. All biological replicates were heated for 5 min at 100 °C and 25 μg of activated proteins were loaded on the each well in the gel. The electro-phoretic run was carried out at 60 mA for the stacking gel and 120 mA in the running gel at power of 200 V. The electrophoresis ran for an average time of 1 h and 15 min. The gels were stained with Coomassie Blue overnight and subsequently destained with several changes of destaining solution (45% methanol, 10% acetic acid). Digi-talized images of the destained SDS-PAGEs were analyzed by the Quantity One 1-D Analysis Software (Bio-Rad Laboratories; Berkeley, California) to measure the optical densities at each lane of all biological replicates from both sites. The amount of protein at bands of 55, 25, and 10 kDa was done using the marker reference bands at
75, 50, and 25 kDa that contained 150, 750, and 750 ng of proteins respectively (Fig. 1). Each lane of the same SDS-PAGE was divided in six slices from 200 to 10 kDa and manually excised from the gel.
The CBB-stained gel slices from three biological replicates were destained and then processed for the reduc-tion and alkylareduc-tion steps by using dithiotreitol (DTT) and iodoacetamide (IAA), respectively46. Gel pieces were
digested by Trypsin (Promega, Madison WI, USA) overnight at 37 °C adding ammonium bicarbonate buffer to cover gel matrix. The extracted peptides from three independent biological replicates and two technical replicates were immediately processed for mass spectrometry analysis.
Tandem mass spectrophotometry (MS) analysis.
A data-dependent tandem MS approach was car-ried out using a hybrid quadrupole-time-of-flight (Q-TOF) mass spectrometer (6550 IFunnel Q-TOF, Agilent Technologies, CA, USA), with a nano LC Chip Cube source (Agilent Technologies, CA, USA) according to Lucini and Bernardo47. The chip consisted of a 40-nL enrichment column (Zorbax 300SB-C18, 5 µm pore size)and a 150 mm separation column (Zorbax 300SB-C18, 5 µm pore size) coupled to an Agilent Technologies 1200 series nano/capillary LC system and controlled by the MassHunter Workstation Acquisition (version B.04).
A volume of 8 µL was injected per run, loading peptides onto the trapping column at 4 µL min−1 in 2% (v/v) acetonitrile and 0.1% (v/v) formic acid. After enrichment, the chip was switched to separation mode and pep-tides were back flush eluted into the analytical column, during a 60 min acetonitrile gradient (from 3 to 90% v/v in 0.1% formic acid) at 0.6 µl min−1. The mass spectrometer was used in positive ion mode and MS scans were acquired over a mass range from 300 to 1700 m/z, at 4 spectra s−1.
Twelve precursor ions per scan were selected for auto-MS/MS, adopting an absolute threshold of 1000 and a relative threshold of 0.01%, and enabling active exclusion after 2 spectra of the same precursor. Ramped collision energy was used for collision-induced decomposition, as a function of peptide charge.
Peptide identification from MS/MS spectra, proteins inference and validation were performed in Spectrum Mill MS Proteomics Workbench (Rev B.04; Agilent Technologies). Auto MS/MS spectra were extracted from raw data accepting a minimum sequence length of 3 amino acids and merging scans with the same precursor within a mass window of ± 0.4 m/z, in a time frame of ± 30 s. Search parameters were Scored Peak Intensity (SPI) ≥ 50%, precursor mass tolerance of ± 10 ppm and product ions mass tolerance of ± 20 ppm. Carbamidomethylation of cysteine was set as fixed modification and trypsin was selected as enzyme for digestion, accepting 2 missed cleavages per peptide.
Considering that a species-specific proteome was not available, the proteome referring to viridiplantae in Uniprot was used; downloaded on April 2015, a total of 144,283 entries can be found according to this criterion.
Auto thresholds were used for peptide identification in Spectrum Mill, to achieve a target 1% false discovery rate. Label-free quantitation, using the protein summed peptide abundance, was carried out after identification.
Statistical analyses.
The results were directly exported to Mass Profiler Professional B.04 (Agilent Tech-nologies) for statistical analysis. Protein intensities were log2 normalized and fold-change analysis was carried out using a threshold of 3. Multivariate Partial Least Square Discriminant Analysis (PLS-DA) was then carried out (N-fold validation, using N = 3 and 10 repeats). The PLS-DA class prediction model loading, i.e. the plot of the weight for each protein in the model within the latent vectors, was used to select those proteins being more discriminant in class prediction (those having a score of above + 0.2 rather than below -0.2). These proteins were exported from the covariance structures in the PLS-DA hyperspace and further discussed.Preparation of samples and histological analyses.
For each individual, several 5 × 5 mm pieces of six fixed leaves were cutted and washed in 0.15 M phosphate buffer three times for 10 min; subsequently leaf pieces were treated with 1% osmium tetraoxide in phosphate buffer. Leaf pieces were then dehydrated trough the increasing concentration of ethanol solutions. Dehydrate samples were then imbedded in epoxy resin, obtained by mixing Epon 812-Araldite and ethanol (1: 1, v/v) for 4–5 h at 4 °C and then embedded in pure resin overnight at room temperature. The embedded samples were polymerized in an oven at 60 °C for 3 days; then each sample was cut in 0.2 mm thick sections through the ultramicrotome. The sections were transferred onto slides and stained with Methylene Blue. At least ten sections for each leaf sample were observed and photographed at 100 X magnification and digitalized using Image J open source software. A measurement bar of 100 μm as a reference scale was added to the images obtained for subsequent analysis using CellProfiler open source software (Broad Institute; country). The areas of 20 cells per section of the epidermis and parenchyma were measured and the thickness of the epidermis and parenchyma cell wall was also measured and a 100 × 100 μm scale square. The measurements obtained were divided into two datasets of all the samples of the two sites; the first dataset with the comparison of the mean values of the cell area and the second dataset with the comparison of the average values of the wall thickness. Significance of values from both datasets were made by t-student test using the GraphPad Prism 8 software.Received: 9 May 2020; Accepted: 24 November 2020
References
1. Tassi, F. et al. Low-pH waters discharging from submarine vents at Panarea Island (Aeolian Islands, southern Italy) after the 2002 gas blast: Origin of hydrothermal fluids and implications for volcanic surveillance. Appl. Geochem. 24, 246–254 (2009).
2. Boatta, F. et al. Geochemical survey of Levante Bay, Vulcano Island (Italy), a natural laboratory for the study of ocean acidification.
Mar. Pollut. Bull. 73, 485–494. https ://doi.org/10.1016/j.marpo lbul.2013.01.029 (2013).
3. Hall-Spencer, J. M. et al. Volcanic carbon dioxide vents show ecosystem effects of ocean acidification. Nature 454, 96–99 (2008). 4. Ricevuto, E., Kroeker, K. J., Ferrigno, F. & Gambi, M. C. Spatio-temporal variability of polychaete colonization at volcanic CO2 vents indicates high tolerance to ocean acidification. Mar. Biol. 161, 2909–2919. https ://doi.org/10.1007/s0022 7-014-2555-y (2014). 5. Ricevuto, E., Vizzini, S. & Gambi, M. C. Ocean acidification effects on stable isotope signatures and trophic interactions of
polychaete consumers and organic matter sources at a CO2 shallow vent system. J. Exp. Mar. Biol. Ecol. 468, 105–117. https ://doi.
org/10.1016/j.jembe .2015.03.016 (2015).
6. Foo, S.A., Byrne, M., Ricevuto, E., Gambi, M.C. The Carbon Dioxide Vents of Ischia, Italy, A Natural System to Assess Impacts of Ocean Acidification on Marine Ecosystems: An Overview of Research and Comparisons with Other Vent Systems. In Oceanog-raphy and Marine Biology An Annual Review. S. J. Hawkins, A. J. Evans, A.C. Dale, L. B. Firth, I. P. Smith eds. Taylor & Francis Group, 56 (2018).
7. Mutalipassi, M. et al. Ocean acidification alters the responses of invertebrates to wound-activated infochemicals produced by epiphytes of the seagrassPosidonia oceanica. J. Exp. Mar. Biol. Ecol. 530–531, 151435 (2020).
8. Apostolaki, E. T., Vizzini, S., Hendriks, I. E. & Olsen, Y. S. Seagrass ecosystem response to long-term high CO2 in a Mediterranean volcanic vent. Mar. Environ. Res. 99, 9–15 (2014).
9. Vizzini, S., Apostolaki, E. T., Ricevuto, E., Polymenakou, P. & Mazzola, A. Plant and sediment properties in seagrass meadows from two Mediterranean CO2 vents: Implications for carbon storage capacity of acidified oceans. Mar. Environ. Res. 146, 101–108 (2019).
10. Beer, S., Björk, M., Beardall, J. Acquisition of carbon in marine plants. In: John Wiley & Sons eds. Photoshynthesis in the Marine Environment. Wiley Blackwell, Iowa, USA. pp: 95–124 (2014).
11. Beer, S., Björk, M., Hellblom, F. & Axelsson, L. Inorganic carbon utilization in marine angiosperms (seagrasses). Funct. Plant Biol.
29, 349–354 (2002).
12. Koch, M., Bowes, G., Ross, C. & Zhang, X. H. Climate change and ocean acidification effects on seagrasses and marine macroalgae.
Glob. Change Biol. 19, 103–132. https ://doi.org/10.1111/j.1365-2486.2012.02791 .x (2013).
13. Zimmerman, R. C., Kohrs, D. G., Steller, D. L. & Alberte, R. S. Impacts of CO2 enrichment on productivity and light requirements of eelgrass. Plant Physiol. 115, 599–607. https ://doi.org/10.1104/pp.115.2.599 (1997).
14. Garrard, S. L. & Beaumont, N. J. The effect of ocean acidification on carbon storage and sequestration in seagrass beds; a global and UK context. Mar. Pollut. Bull. 86, 138–146 (2014).
15. Hendriks, I. E., Duarte, C. M. & Alvarez, M. A. Vulnerability of marine biodiversity to ocean acidification: a meta-analysis. Estuar.
Coast. Shelf Sci. 86, 157–164 (2010).
16. Zimmerman, R. C., Hill, V. J. & Gallegos, C. L. Predicting effects of ocean warming, acidification, and water quality on Chesapeake region eelgrass. Limnol. Oceanogr. 60(2015), 1781–1804 (2015).
17. Pacella, S. R., Cheryl, A. B., George, G. W., Rochelle, G. L. & Burke, H. Seagrass habitat metabolism increases short-term extremes and long-term offset of CO2 under future ocean acidification. PNAS 115(15), 3870–3875 (2018).
18. Russell, B. D., Connell, S. D., Uthicke, S. & Hall-Spencer, J. M. Future seagrass beds: can increased productivity lead to increased carbon storage?. Mar. Pollut. Bull. 73, 463–469 (2013).
19. de los Santos, C. B., Godbold, J. A. & Solan, M. Short-term growth and biomechanical responses of the temperate
seagrassCymo-docea nodosato CO2 enrichment. Mar. Ecol. Prog. Ser. 572, 91–102 (2017).
20. Schneider, G. et al. Structural and physiological responses of Halodule wrightii to ocean acidification. Protoplasma 255, 629–641 (2018).
21. Radoglou, K. M. & Jarvis, P. G. The effects of CO2 enrichment and nutrient supply on growth morphology and anatomy of Pha-seolus vulgaris L seedlings. Ann. Bot. 70, 245–256 (1992).
22. Epron, D., Liozon, R. & Mousseau, M. Effects of elevated CO2 concentration on leaf characteristics and photosynthetic capacity of beech (Fagus sylvatica) during the growing season. Tree Physiol. 16, 425–432 (1995).
23. Lin, J., Jach, M. E. & Ceulemans, R. Stomatal density and needle anatomy of Scots pine (Pinus sylvestris) are affected by elevated CO2. New Phytol. 150, 665–674 (2001).
24. Ruocco, M. et al. Genome-wide transcriptional reprogramming in the seagrassCymodocea nodosa under experimental ocean acidification. MolEcol 26, 4241–4259. https ://doi.org/10.1111/mec.14204 (2017).
25. Olivé, I. et al. Linking gene expression to productivity to unravel long- and short-term responses of seagrasses exposed to CO2 in volcanic vents. Sci. Rep. 7, 42278 (2017).
26. Procaccini, G. et al. Depth-specific fluctuations of gene expression and protein abundance modulate the photophysiology in the seagrassPosidonia oceanica. Sci. Rep. 7, 42890. https ://doi.org/10.1038/srep4 2890 (2017).
27. Kumar, M. et al. Proteome analysis reveals extensive light stress response reprogramming in the seagrassZostera muelleri (Alis-matales, Zosteraceae) metabolism. Frontiers Plant Sci. 7, 2023 (2017).
28. Piro, A. et al. The modulation of leaf metabolism plays a role in salt tolerance of Cymodocea nodosa exposed to hypersaline stress in mesocosms. Front Plant Sci. 6, 464 (2015).
29. Dattolo, E. et al. Acclimation to different depths by the marine angiosperm Posidonia oceanica: transcriptomic and proteomic profiles. Front. Plant Sci. 4, 195. https ://doi.org/10.3389/fpls.2013.00195 (2013).
30. Mazzuca, S. et al. Seagrass light acclimation: 2-DE protein analysis in Posidonia leaves grown inchronic low light conditions. J.
Exp. Mar. Biol. Ecol. 374, 113–122 (2009).
31. Schwanhäusser, B. et al. Global quantification of mammalian gene expression control. Nature 473, 337–342 (2011). 32. Kanehisa, M. & Goto, S. KEGG: Kyoto encyclopedia of genes and genomes. Nucleic Acids Res. 28, 27–30 (2000).
33. Watanabe, C. K. et al. Effects of elevated CO2 on levels of primary metabolites and transcripts of genes encoding respiratory enzymes and their diurnal patterns in Arabidopsis thaliana: possible relationships with respiratory rates. Plant Cell Physiol. 55(2), 341–357. https ://doi.org/10.1093/pcp/pct18 5 (2014).
34. Lauritano, C. et al. Response of key stress-related genes of the seagrassPosidonia oceanica in the vicinity of submarine volcanic vents. Biogeosciences 12, 4947–4971 (2015).
35 Neha, S., Gokhale, S. P. & Kumar, B. A. Effect of elevated [CO2] on cell structure and function in seed plants. Clim. Change Environ.
Sustain. 2, 69–104. https ://doi.org/10.5958/2320-642X.2014.00001 .5 (2014).
36. Iuchi, S. et al. Regulation of drought tolerance by gene manipulation of 9-cis-epoxycarotenoid dioxygenase, a key enzyme in abscisic acid biosynthesis in Arabidopsis. Plant J. 27, 325–333. https ://doi.org/10.1046/j.1365-313x.2001.01096 .x (2001).
37. Endo, A. et al. Drought induction of Arabidopsis 9-cis-epoxycarotenoid dioxygenase occurs in vascular parenchyma cells. Plant
Physiol. 147, 1984–1993 (2008).
38 Toh, S. et al. High temperature-induced abscisic acid biosynthesis and its role in the inhibition of gibberellins action in Arabidopsis seeds. Plant Physiol. 146, 1368–1385 (2008).
39. Dong, C. H. et al. ADF proteins are involved in the control of flowering and regulate F-actin organization, cell expansion, and organ growth in Arabidopsis. Plant Cell 13, 1333–1346 (2001).
40. Vantard, M. & Blanchoin, L. Actin polymerization processes in plant cells. Curr. Opin. Plant Biol. 5(6), 502–506 (2002). 41. Smertenko, A. P. et al. Ser6 in the maize actin-depolymerizing factor, ZmADF3, is phosphorylated by a calcium-stimulated protein
42. Webster, J. & Stone, B. A. Isolation, structure and monosaccharide composition of the wall of vegetative parts of Heterozostera
tasmanica (Martens ex Aschers) den Hartog. Aquat. Bot. 47, 39–52 (1994).
43. Olsen J.L., Rouzé, P., Verhelst, B., Lin, Y.-C., Bayer, T., Collen, J., Dattolo, E., De Paoli, E., Dittami, S., Maumus, F., et al. The genome of the seagrass Zostera marina reveals angiosperm adaptation to the sea. Nature 530, 331–335 (2016) https ://doi.org/10.1038/natur e1654 8.
44. Brummel, D. A. Cell wall acidification and its role in Auxin-stimulated growth. J. Exp. Bot. 37(2), 270–276 (1986).
45. Laemmli, U. K. Cleavage of structural proteins during the assembly of the head of bacteriophage T4. Nature 227, 680–685 (1970). 46. Shevchenko, A., Tomas, H., Havlis, J., Olsen, J. V. & Mann, M. In-gel digestion for mass spectrometric characterization of proteins
and proteomes. Nat. Protoc. 1, 2856–2860 (2007).
47. Lucini, L. & Bernardo, L. Comparison of proteome response to saline and zinc stress in lettuce. Front. Plant Sci. https ://doi. org/10.3389/fpls.2015.00240 (2015).
Acknowledgements
This study received Portuguese national funds from FCT—Foundation for Science and Technology through pro-ject UIDB/04326/2020 and is also a contribution to the FCT propro-jects HighGrass, (PTDC/MAR-EST/3687/2012) and GrassMet (PTDC/MAR-EST/4257/2014). During the sampling campaign and data analysis, AP was sup-ported by a STSM fellowship within the ESF COST Action “Seagrass Productivity: from genes to ecosystem
man-agement”, coordinated by Rui Santos. The authors deeply thank Daniela Perrotta and Nicodemo Passalacqua for
their valuable technical and logistic support for the histological sample preparation.
Author contributions
S.M. and J.S. coordinated the manuscript writing, S.M., A.P., J.S., R.S. conceived and designed the experiments, S.M., A.P., R.S., J.S., I.O., I.B. and M.M.C. participated to the sampling campaign and the field work, A.P., L.B., and L.L. performed the mass spectrometry analysis, A.P., L.B. and I.A.A. performed the bioinformatics and sta-tistical analyses. S.M. and A.P. performed the cytological measurements. All Authors reviewed the manuscript.
Competing interests
The authors declare no competing interests.
Additional information
Supplementary information is available for this paper at https ://doi.org/10.1038/s4159 8-020-78764 -7.
Correspondence and requests for materials should be addressed to S.M. Reprints and permissions information is available at www.nature.com/reprints.
Publisher’s note Springer Nature remains neutral with regard to jurisdictional claims in published maps and
institutional affiliations.
Open Access This article is licensed under a Creative Commons Attribution 4.0 International
License, which permits use, sharing, adaptation, distribution and reproduction in any medium or format, as long as you give appropriate credit to the original author(s) and the source, provide a link to the Creative Commons licence, and indicate if changes were made. The images or other third party material in this article are included in the article’s Creative Commons licence, unless indicated otherwise in a credit line to the material. If material is not included in the article’s Creative Commons licence and your intended use is not permitted by statutory regulation or exceeds the permitted use, you will need to obtain permission directly from the copyright holder. To view a copy of this licence, visit http://creat iveco mmons .org/licen ses/by/4.0/.