UNIVERSITY
OF TRENTO
DIPARTIMENTO DI INGEGNERIA E SCIENZA DELL’INFORMAZIONE
38123 Povo – Trento (Italy), Via Sommarive 14
http://www.disi.unitn.it
A SVM-BASED MULTI-RESOLUTION PROCEDURE FOR THE
ESTIMATION OF THE DOAS OF INTERFERING SIGNALS IN A
COMMUNICATION SYSTEM
M. Donelli, R. Azaro, L. Lizzi, F. Viani, and A. Massa
January 2011
A SVM-Based Multi-resolution Procedure for the Estimation of the DOAs of
Interfering Signals in a Communication System
M. Donelli, R. Azaro, L. Lizzi, F. Viani, and A. Massa Department of Information and Communication Technology
University of Trento, Via Sommarive 14, 38050 Trento, Italy
E-mail: [email protected], Web-page: http://www.eledia.ing.unitn.it
ABSTRACT
In this work, the use of a planar antenna system for the estimation of the directions of arrivals (DOAs) of multiple signals impinging on the receiver has been considered. Towards this end, an efficient multi-resolution method based on a SVM-classifier is proposed for determining a probabilitic map of the DOAs of the unknown interfering signals. Numerical results dealing with multiple interferers scenarios in noisy environments are provided in order to assess the feasibility as well as the capability of the proposed approach.
1. INTRODUCTION
In the last few years, there has been a growing demand for high performance devices in mobile and wireless communication systems. Several researches have been devoted to the development of methods able to detect and to track the signals coming from different and arbitrary directions. The knowledge of the directions of arrival (DOAs) of the unknown interfering and desired signals significantly improves the performances of an adaptive array for achieving high interference rejection and signal of interest enhancement, because it is possible by means of adaptive arrays, to limit the effects of the interfering signals in a faster way, for example by placing nulls in the beam pattern in correspondence of the DOAs of the interferers once the knowledge of the DOA of the desired source is available [1]. A number of techniques have been proposed for determining the DOAs of multiple signals [2] for instance, the multiple signal classification algorithm (MUSIC) [3] and the estimation of signal invariance technique (ESPRIT) [4]. Although these approaches are able to detect signals with reduced angular separations and scenarios characterized by low signal-to-interference-plus-noise ratios, they require high computational resources and some knowledge on the geometrical and electrical characteristics of the sensors as well as on the environment. Recently some alternative techniques based on learning-by-examples techniques [5] have been proposed for addressing in an alternative fashion the same issues. In such a framework, support vector machines (SVMs) can be efficiently used for localizing single as well as multiple signals. The SVM was introduced by Vapnik [6] and recently, it has found useful and effective in dealing with various and complex electromagnetic problems [7]. In such a work, the estimation problem is addressed by considering an integrated strategy based on a SVM classifier and on an iterative multi-zooming procedure. A succession of approximations of a map of probability of the DOAs of the signals is defined starting from the same training set. At each step, the angular resolution is increased in a limited set of angular regions (called “angular-regions- of-interest, AROIs) defined at the previous zooming step and characterized by a greater value (with respect to the remaining part of angular investigation domain) of the probability of occurrence of the interference signals. The multi-step procedure is stopped when the required degree of accuracy in terms of angular resolution is reached in the AROIs. Summarizing, the main advantages of the proposed strategy are: (a) a favorable trade-off among computational complexity and angular resolution and (b) an easy hardware implementation. In order to assess the feasibility and effectiveness of the proposed procedure, such features, a large number of numerical experiments has been performed and a representative set of results will be shown and discussed in the following.
2. MATHEMATICAL FORMULATION
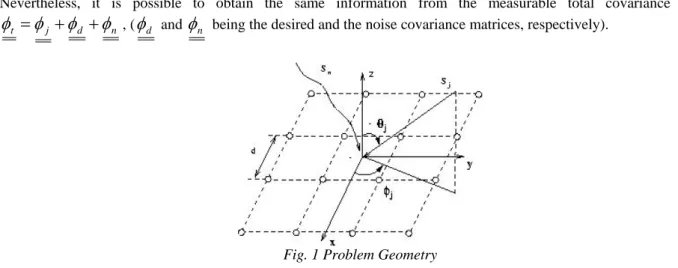
Let us consider a planar array made up of M equally spaced isotropic elements (Fig. 1), given as d=λ/2 ( being the wavelength ). The array receives a desired signal Sd(t), a variable number of interfering signals (Sj(t); j=1, … ,J), and a
noise contribution Sn(t). The narrowband desired signal is centered at an angular frequency as well as the interfering
ones. The information related to the DOAs of the interfering signals can be deduced from the undesired covariance matrix
λ d
ω
u
Nevertheless, it is possible to obtain the same information from the measurable total covariance matrix
n d j
t
φ
φ
φ
φ
=
+
+
, (φ
d andφ
n being the desired and the noise covariance matrices, respectively).Fig. 1 Problem Geometry
Therefore, starting from the knowledge of
φ
t the goal of this work is to obtain a probability map related to interferers DOAs. In order to determine such a “DOAs probability map”, let us model the angular region (θ∈[
−90:90]
and[
0:360)∈
]
φ above the antenna with a two dimensional lattice of N cells.
The state of the n-th cell can be either empty (if any interfering signal impinges on the cell) or occupied . Then the problem can be formulated as follows: “starting from the measurements of the total covariance matrix
n χ χn=−1 1 = n χ t
φ
, find the probability qn that a signal impinges on the n-th cell”. That is, determine the probability array Q, whichis a function ℑ of the data
φ
t⎟ ⎠ ⎞ ⎜ ⎝ ⎛ ℑ = ⎪⎭ ⎪ ⎬ ⎫ ⎪⎩ ⎪ ⎨ ⎧ Γ = = t t Q Pr χ 1 φ φ (1)
where Q=
{
qn,n=1,...,N}
and{
such a statement defines z classification problem. A solution based on the SVM will be detailed in the following by assuming the knowledge of a set of known examples (i.e. input output relations}
N n n, =1,..., χ ⎭ ⎬ ⎫ ⎩ ⎨ ⎧ = = = t n n n N h h H t ; 1,..., ) ( ) , ... , 1 ; , , (φ χφ called training set) H being the number of training examples. Moreover in order to improve the angular resolution of the method a multi-resolution strategy is used. The strategy can by summarized through the following steps:
Step 1 – The first step (s=1) is aimed at obtaining a “coarse” probability map Q=
{
qn,n=1,...,N}
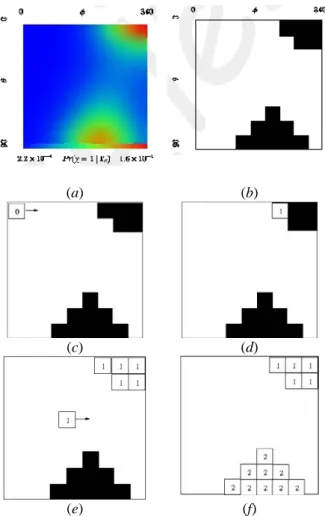
, r=1, of the interfering scenario, in the whole angular domain (called investigation area). [Fig. 2(a)].Step 2 – Angular Regions of interest (AROIs) identification. This step is aimed at identifiyng the angular regions of
interest AROIs, to which the interferers belong and where the angular resolution will be improved. Towards this end, the map obtained at the previous steps, is binarized by thresholding [Fig. 2(b)]. Then the obtained binary map is raster scanned from left- to right- hand side and from the top to bottom, in order to identify the RoIs. The process is summarized in Figs. 2 (c) – 2(f).
Step 3 – Then a synthetic zooming is performed only in the selected AROIs, by using the same SVM used to obtain the coarse risk map at the Step 1 exploiting the knowledge of
φ
t . Accordingly, a multi-resolution probability map is defined ⎪⎭ ⎪ ⎬ ⎫ ⎪⎩ ⎪ ⎨ ⎧ = = = nr N r r R r n q r Q , ( ) 1,..., ( ), 1,... ) ( ) ( (3)Step 4 – The procedure is iteratively repeated (s← s+1)until a “stationary condition” for the probabilities is fulfilled. This condition holds true when in two consecutive steps (s and s-1) the dimensions of the AROIs turn out to be equal.
3. NUMERICAL RESULTS
In order to assess the effectiveness of the proposed approach, several synthetic numerical examples have been considered. In all the examples presented here the following configurations have been chosen: a planar array of M=16 elements and a lattice of N=81 square cells. The desired signal impinges on the array from the known direction θ=0. As far as the interfering scenario is concerned, the power of the interfering signals has been set to
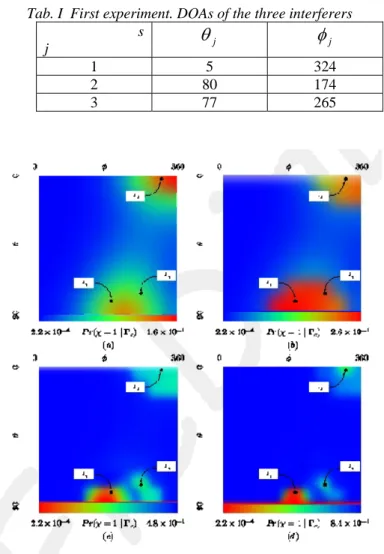
above the desired signal and their angular position is looked for. The SVM has been trained considering H=100 trial examples characterized by a maximum number of interfering signals J=4. The first experiment is aimed at pointing out the effectiveness of the proposed strategy in “detecting” the DOAs of multiple interferers. The actual directions of the interferers are summarized in Tab I. Fig. 3 shows the DOAs probability map retrieved at different steps of the IMSA-SVM approach. As it can be observed, starting from the coarse map, shown in Fig. 3 (a), the proposed strategy identifies at the step s=2, two AROIs. At the last step, s=3 different AROIs are correctly identified tp which the actual positions of the interferers belong (pictorially indicated by the black points in Figs 3).
J j dB j P =10 ; =1,..., (a) (b) (c) (d) (e) (f)
Fig. 2 Example of the RoIs identifications procedure. (a) The coarse probability map at step r=0, (b) Binarized representation of the probability map after thresholding. (c, f) RoIs detection and labelling.
As it can noticed Fig. 3, the estimated probability of detecting a signal increases during the multi-resolution procedure in the AROIs as confirmed by the values of probability reported in Tab. II, which shows the probability of correctly detect the DOA of the interferers at the different step of the multi-resolution process.
Tab. I First experiment. DOAs of the three interferers s j
θ
jφ
j 1 5 324 2 80 174 3 77 265Fig. 3 Three interfering signals scenario, probability map versus step number. (a) r=0, (b) r=1, (c) r=2, (d) optimal r=R=3.
Tab. II Probability of detect an interferer j with the correct DOA, versus step number. Step. No. 0 1 2 3 1
J
0.16 0.20 0.21 0.38 2J
0.11 0.26 0.48 0.8 3J
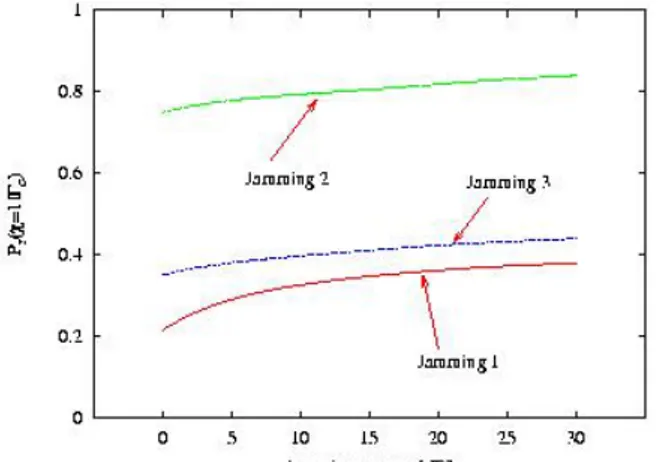
0.08 0.24 0.30 0.44Moreover, in order to evaluate the power of the interferences on the localization capability of the proposed approach has been varied in the range from 0 dB up to 30 dB. The data reported in Fig 4 show the probability to detect the correct DOAs of the interferer versus the jamming power. As it can be observed from the data reported in Fig. 4 the method is able to correctly identify the presence and the DOAs of the jammers also when the jamming power is close to that of the desired signal. In the last experiment a more complicated scenario, has been considered. The DOAs of the interferers are reported in Tab. III. In Fig. 5 are reported the DOAs probability map retrieved at different the steps of the multi-resolution process.
j P
Fig. 4 Three interfering signals scenario. Probability of correctly detect a jammer, versus the jamming power.
Tab. III Four interferings scenario DOAs. Jammer j
θ
φ
j 1J
5 79 2J
28 168 3J
36 157 4J
46 3204. CONCLUSIONS
A multi-resolution strategy for the estimation of the DOAs of multiple interference signals has been proposed. The method is based on the use of a SVM approach for the generation of a probability map of the DOAs of signals impinging on the receiving array. Although a non exhaustive validation of the advantages and current limitations of the proposed approach is needed (also considering experimental data), the obtained results seem to confirm its realiability and effectiveness.
REFERENCES
[1] S. P. Applebaum, “Adaptive arrays,” IEEE Trans. Antennas Propagat, vol. AP-24, pp. 585-598, May 1976. [2] R. O. Schimid, “Multiple emitter location and signal parameter estimation,” IEEE Trans. Antennas Propagat, vol.
34, pp. 3226-3231, 1986.
[3] A. Swindlehurst, T. Kaliath, “A performance analysis of sub space-based methods in the presence of model errors. I. The MUSIC algorithm,” IEEE Trans.on Sign. Processing, vol. 40, pp. 1578-1774, 1992.
[4] F. Gao, B. Gershman, “A generalized ESPRIT approach to direction of arrival estimation,” IEE Signal Processing
Letters,vol. 12, pp. 254-257, 2005.
[5] A. H. El Zoogli, C. G. Christodoulou, and M. Georgiopulos, “A neural network-based smart antenna for multiple source tracking,” IEEE Trans. Antennas Propagat., vol. 48, pp. 768-776, May 2000.
[6] V.Vapnik, Statistical Learning Theory. New York: Wiley, 1998.
[7] E. Bermani, A. Boni, S. Caorsi, M. Donelli, and A. Massa, “A multi-source strategy based on a learning-by-examples technique for buried object detection,” Progress In Electromagnetic Research, PIER 48, pp. 185-200, 2004.
[8] D. S. Weile and E. Michielssen, “The control of adaptive antenna arrays with genetic algorithms using dominances and diploidy,” IEEE Trans. Antennas Propagat, vol. 49, pp. 1424-1433, Oct. 2003.