SCUOLA SUPERIORE SANT’ANNA THE BIOROBOTICS INSTITUTE PhD PROGRAM IN BIOROBOTICS
Assessment of motor function in
Parkinson disease: study and development
of algorithms and mobile solutions
SUPERVISOR
Prof. Angelo Maria Sabatini TUTOR
Ing. Filippo Saponara
PhD Candidate Pinna Laura
Abstract
The measure of the mobility in the subjects suffering from Parkinson’s disease is currently an important research topic because, in such complex pathology, movement alteration represents one of the most debilitating phenomena that patients have to face. This is accompanied by the need to monitor the evo-lution of the disease from a quantitative point of view, with the use of an instrumented methodology developed directly for this purpose. The detailed information about the evolution of the pathology allows the doctor to plan treatments tailoring them to the patient’s needs. In addition to the charac-terization of the disease, identifying the first signs at an early stage of the pathology is of main importance: as a result clinicians are seeking help in new technologies. The use of wearable sensors for the analysis of movement occupies a large part of the research in this field since the beginning of our century. In the last decade, the diffusion in clinics of wearable systems is exponentially growing because they are perceived as a way to monitor the patient in the hospital and/or at home, and because, wearable sensors are a more comfortable and quick way of carrying out quantitative analyses, compared to widely-used methods such as optoelectronic systems. More-over, the increasing distribution of smartphones has made it possible for the smartphone to interface with the wearable sensors to make them even more appealing and eye-catching to the user.
The purpose of this research is the use of wearable inertial sensors, con-nected with Bluetooth to a smartphone that synchronize and save the ac-quired data in order to: on the one hand discriminate the presence or not of the pathology in subjects that are located at an early stage of the disease, and in the other hand, to look for correlations of results with what is commonly
used by neurologists at evaluation, i.e. UPDRS and H&Y evaluation scales. The hardware involved in tests was customized from existing devices and custom made Android applications for data acquisition and synchronization were designed and developed during this study. The whole thesis work has been organized around a physical test that is common in clinical practice, namely the Timed Up and Go Test (TUG), that can be instrumented for its objective evaluation by means of wearable sensing nodes. TUG test instru-mentation took the start from a redundant experimental setup, involving the use of many magneto inertial sensing units positioned on the shanks, wrists, chest and body center of mass (CoM). Participants were asked to walk for a 3-meters TUG test as it is common for the compilation of the UPDRS but they also performed an extended version of the test, the 7-meters TUG, to obtain a greater number of step during the gait phase to get higher reliability in gait parameter extraction.
Data analysis show that the CoM-placed sensor is the one that allows extracting more information when used alone. In fact using CoM sensor data, it was possible to discriminate not only the postural transition and the turning phase during the test with Sensitivity > 74.7 and Specificity > 78.2 for both PD and CTRL group, but also to extract temporal and spatial parameters such as step time, stride time, cadence and stride length without showing significant differences (pvalue > α, α=0.05) compared to those obtained from right and left shanks sensors. Among them, the step length calculated in the PD group of women has proved to be important in the discrimination of the presence or not of the disease. The stride time estimated in the same group showed a significant correlation with the H&Y and UPDRS evaluation scale (R2 > 0.7). Moreover, the evaluation of the trunk tilt in the women with the device secured on the chest showed a correlation with the UPDRS and H&Y evaluation scale with values of R2 > 0.6 .
Study results allowed to simplify the experimental setup to a single-unit based configuration. CoM sensor in fact allowed to extract both parameters which can discriminate against the presence or not of the pathology, and calculate parameters that show correlation with the evaluation scales that represent the gold standard from a medical point of view.These results pave
the way to new scenarios for patient monitoring, that could also be based on the use of the inertial sensors embedded on the smartphone. In fact, such a solution would allow to monitor movement alteration during specific tasks and to track his/her movement quality in everyday life. This would allow a reduction of psychological load due to the presence of the medical staff and then obtain a more detailed and truthfully follow up assessment that could be a daily one instead of being performed on a six-months basis.
Contents
1 iTUG - State Of Art 14
1.1 Algorithms for automatic transitions detection . . . 18
1.1.1 Sit to stand / Stand to sit detection: . . . 18
1.1.2 Turning/ turn to sit detection . . . 19
1.2 Tug Phases - Parameters . . . 20
1.2.1 Sit To Stand . . . 21
1.2.2 Gait . . . 22
1.2.3 Turn . . . 24
1.2.4 Turn To Sit . . . 25
2 Experimental Setup, instrumentation, Android software & Firebase console 26 2.1 Subjects . . . 27 2.1.1 Patients . . . 27 2.1.2 Control group . . . 29 2.2 Hardware platform . . . 29 2.2.1 Time synchronization . . . 31
2.3 Android Application- PDdataProtocol . . . 34
2.3.1 Main Activity . . . 34
2.3.2 List item changes Activity . . . 36
2.4 Firebase (Real Time Analysis) . . . 41
2.4.1 Workflow . . . 41
2.4.1.1 Firebase console . . . 42
3 Data Analysis: iTUG segmentation and parameters
extrac-tion 45
3.1 Data pre-processing . . . 46
3.2 TUG phases segmentation: transitions . . . 46
3.2.1 SST (sit-stand transition): comparing methods . . . . 46
3.2.2 Turn . . . 51
3.3 Gait Parameters . . . 52
3.3.1 Temporal Parameters: comparing methods . . . 52
3.3.2 Spatial Parameters: . . . 55
3.3.3 Tremor . . . 58
3.4 Turn Parameters . . . 60
3.5 Sit to Stand Parameters . . . 60
3.6 UPDRS . . . 61
3.7 Reliability tests . . . 62
3.8 Gold Standard . . . 64
4 Results and Discussion 65 4.1 Transitions Detection . . . 66
4.1.1 Sit To Stand and Stand To Sit Transition (SST) . . . 66
4.2 Gait Parameters . . . 70
4.2.1 Temporal Parameters . . . 70
4.2.2 Spatial Parameters . . . 73
4.2.3 Statistical Analysis Spatio-Temporal Parameters . . . . 77
4.2.4 Tremor . . . 80
4.3 Turn Parameters . . . 85
4.4 SST Parameters . . . 85
4.5 Intra-Inter Reliability . . . 86
Introduction
The thesis was born in an industrial context (Joint Open Lab of Tim), from a requirement manifested by a group of neurologists of the University Hos-pital of Pisa, which have stressed the need to locate an instrumented set up which allows to analyze a target of patients suffering from Parkinson’s dis-ease during the course of some tests that are commonly carried out in phase of analysis, providing quantitative information on the exercise performed.
The aim is to monitor the patient not only in controlled conditions, as happens during the hospital visit but also in family conditions, thus allowing to have more frequent updates on the evolution of the disease that has in most cases rapid variations, caused by the dosage of drugs administered thus effecting a therapeutic correction in a shorter time with respect to the classical outpatient practice.
To be able to make this, the system must supply to the user of the results that allow the evaluation from the medical staff of the state of advancement of the pathology. In order to understand which is the best experimental test for highlighting the characteristic problems of the pathology; it is necessary to introduce more in deep the knowledge of the pathology itself.
Parkinson’s disease motor symptoms
Parkinson’s disease (PD) is a neurodegenerative disease affecting more than 1 in every 100 people over the age of 75 years [1]. On a worldwide basis, it is thought that approximately 10 million of elderly people have PD. With a large proportion of the population aging, by the year 2020 more than 40 million people in the world will have this progressive, neurological condition
[2].
Symptoms and signs may vary from person to person. Early signs may be mild and may go unnoticed. Symptoms often begin on one side of the body and usually remain worse on that side, even after symptoms begin to affect both sides. Parkinson’s signs and symptoms may include [3]:
Tremor, or shaking, usually begins in a limb, hands or fingers. The person notices a back-and-forth rubbing of the thumb and forefinger, known as a pill-rolling tremor. One characteristic of the disease is a tremor of the hand when it is relaxed, resting tremor 5-7 Hz, that lead to a high frequency of sway.
Rigidity manifested in hypertonicity in agonist and antagonist muscles that cause a flexed posture and a weak torque to control Center of Mass (CoM). Muscle stiffness may occur in any part of the body. The stiff muscles can limit the range of motion and cause pain.
Bradykinesia: that is a reduction in movement speed and amplitude. Due to this, the patient has a slow force to control CoM. Steps may become shorter when the patient walks, or may find it difficult to get out of a chair.
Akinesia: i.e. the difficulty in initiating movement like gait due to a poor postural control [4].
Freezing episodes: motor blocks that cause sudden inability to walk Impaired postural control: difficulty in maintaining stance balance or
in response to perturbations, difficulty in transferring, falls without re-covery of equilibrium during stance, perturbations, and transfers. The posture may become stooped and the patient shows balance problems.
Dyskinesia: wiggling twitching involuntary movement, fast turns and large sway area
Loss of automatic movements. A decreased ability to perform uncon-scious movements, including blinking, smiling or swinging arms during walking.
Writing changes. It may become hard to write, and the writing may appear small with the difficult to change direction or join two distant points.
There are other physical symptoms associated with PD such as anosmia, nerve pain, urinary incontinence etc. However, Parkinson’s disease not only involves physical aspects of the person but also cognitive and psychiatric aspects such as depression and anxiety, mild cognitive impairment which occur with slight memory problems and difficulties with activities that require planning or organisational skills and dementia.
Monitoring motor signs in PD, and specifically, gait and balance impair-ments, is particularly demanding because gait and balance impairments re-spond poorly to most interventions, may vary in strength and type of symp-toms with disease progression (e.g. freezing of gait), and consist of many different subsystems that vary in their response to intervention. There are several approaches used for clinical assessment of all of these manifestations some with clinical rating scales such as Part III of the Unified Parkinson’s disease Rating Scale (UPDRS) [5]. Balance and gait are measured with the Postural Instability and Gait Disability (PIGD) sub-score (including pos-ture, gait, sit-to-stand, and the pull test) with scores from 0 (normal) to 16 (severe or unable to stand or walk) [6]. Quality of life is measured with the PD Quality of Life questionnaire (PDQ-39) [7], which is based on clinical judgments and perception of people with PD. The MDS-UPDRS (a revision of the UPDRS sponsored by the Movement Disorders Society published in 2008) is a multidimensional scale, most widely used to clinically assess PD motor impairments and disability [8]. It is made up of four parts, cover-ing behaviors and mood (Part I), ADL (Part II), motor performance (Part III), and complications of therapy (Part IV). The Hoehn and Yahr staging is probably the most widely known evaluation of people with PD and was first described in 1967 [9]. It is a staging from 0 to 5 of the motor manifestations
of PD, intended to reflect the degree of progression, and combines features of motor impairment and disability. However, the scale is not linear and may not even have a proper rank order, with some people having greater disabil-ity with stage 2 (with substantial bradykinesia but good stabildisabil-ity on the pull test) compared to some that have been ranked as stage 3 (that fall on the pull test but have relatively mild bradykinesia and rigidity). Overall, the Hoehn and Yahr staging is most used for a description of subject groups [10]. However, the use of rating scales is not practical for long-term, repeated, and remote follow-up of Parkinsonian symptoms, since they are relatively time-consuming, require a clinical visit, depend on considerable clinical ex-pertise, and some of their items have poor inter-clinician reliability [11, 12]. Furthermore, the clinical visit may not accurately represent the patients’ activities in their home environment and may influence outcomes [13, 14]. Therefore, there is a need to add an objective, observer-independent mea-sure of PD motor impairments that can be meamea-sured during prescribed tasks in the clinic. The most popular approach to objective assessments of PD symptoms, excluding stereophotogrammetry, involves the use of wearable, inertial sensor technology [15]. Wearable sensors let extract quantitative in-formation easily, without the necessary presence of dedicated technician or a configuring environment allowing to carry out the test at home thus facilitat-ing the follow-up. There are a number of objective assessment tools, several commercial products, and many more developed for laboratories, reported in the literature that aim to provide objective assessments of PD-related symp-toms, including bradykinesia, therapy-induced dyskinesia, akinesia, posture, and gait deficits, among others [16, 17].
At this point it is important to understand how it is possible to identify the characteristic symptoms of parkinson’s disease in subjects at an early or intermediate stage of the disease. The use of an instrumented test is a starting point for characterizing the pathology in some of its aspects, with the aim of being able to discriminate, from a few parameters extracted, the presence or not of the disease and its evolution over time.
Which test? Timed Up and Go Test, because TUG is one of the most commonly used functional measurements in PD and allows to evaluate at the
same time most of the symptoms mentioned above.
Identified the reference test, the need to provide quantitative information relating to the tug, in addition to the single time duration of the test (not in-strumented TUG’s output), moves the problem on the choice of technologies that allow the monitoring of the activities during the test.
In a context in which it is desired to provide a portable system, easy to use, small in size, with relatively low costs, the solution falls on the iner-tial devices such as accelerometers and gyroscopes today available to most users in terms of smartphone or smartwatch. These devices allow to make a quantitative analysis of the test.
Identified the domain, it was important to establish which was the best positioning of the devices in order to obtain the optimal parameters for the characterization of the state of the pathology. From this last sentences can be seen as the choice of the positioning of the device strongly depends on the information that it’s important to obtain or that are of most interest from a clinical point of view.
In this framework, the aim of the present thesis has been a characteriza-tion of the physical signs during TUG test, in people with Parkinson disease using wearable inertial sensors. The focus is to identify, from the analysis of the data the positioning ”optima” of the devices, and a set of parameters that are helpful to the doctor during the evaluation of the progression’s state of the disease but that also allow to discriminate the presence or not of the pathology in a early stage of the disease and also that correlate with the rating scales commonly used by the clinician during the assessment of the patience, UPDRS and Hoen&Yahr scale, since would allow the clinician to have a direct link with the evaluation methods that represent the reference standard in the treatment of Parkinson disease.
Once the parameters of interest have been identified for an early detection of the pathology and / or an update of the evolution of the same, thanks to the integration of the analysis in an Android application that manages a Real-Time analysis using Google Firebase platform, the results of the analysis will be available at the end of the test itself, thus allowing immediate feedback in real time.
The results can be also consulted directly on the Android app with which you made the acquisition or by logging on to the console Firebase, which al-lows the physician to view the complete history of the subject under analysis, thus providing the physician a tool for the monitoring of patients.
Chapters organization
The thesis can be divided into different sections; first, the choice of the experimental set-up, then the development of testing and finally data analysis were carried out.
Chapter one presents a general discussion on the state of the art of the Instrumented Timed Up and Go Test. The Chapter reflects the need to clarify the ideas on what may be the output produced by a tug instrumented in relation to the different possible positions of devices in fact
Chapter two is one of the main chapters of the thesis. It describes the ex-perimental setup used to extract the interesting parameters, passing through the implementation of an android application for synchronization and acqui-sition of data from inertial sensors (IMUs) and the features of the devices. The first part of this chapter is dedicated to the description of inclusion cri-teria for subjects that were enrolled in the trial (patients and control group) by highlighting what are the most important features that will be taken into account in the following chapter.
Chapter three represents the core of the work, it shows the methods de-veloped for data analysis. It starts explaining in detail the algorithms used to automatically detect the characteristic transitions of the Timed Up And Go test, focusing on the comparison between the two most used approaches reported in the literature. The detection of transitions in TUG opens the scenario for the analysis of individual phases, with the extraction of param-eters and the search for information that can discriminate patients from the control group
Chapter four, reports the results of the work obtained from data analysis (chapter three), taking into account the different possible groupings identified earlier in the experimental setup section. The results obtained from the
comparison with the section III of the UPDRS rating scale cover much of the chapter. These are evaluated in relation to intra and inter-subject variability and correlations between patients and the control group taking into account the different phases of the pathology itself.
Chapter five, includes a critical discussion of the proposed approach and reports the concluding remarks of this thesis work, showing the advantages of the use of the proposed approach and its future goals.
Chapter 1
iTUG - State Of Art
The TUG (Timed Up and Go) test was developed in 1991 as a modified timed version of the Get up and Go test [18, 19]. To perform the TUG test as described in the original derivation study, patients are timed while they rise from an arm chair (approximate seat height 46 cm), walk at a comfortable and safe place to a line on the floor three meters away, turn and walk back to the chair and sit down again. In general, a faster time indicates a better functional performance. From literature screening, it is evident that the TUG test is an important standardized test with several benefits, but it also has some limitation. TUG Test is the shortest, simplest clinical balance test, and probably the most reliable because it uses agreement in stop-watch duration rather than rating scales [20]. No formal normal values are available. Healthy adults over 79 years old took 7-10 seconds [19]; frail elderly subjects took 10-240 seconds to perform, with 45 out of 57 subjects performing the test in less than 40 seconds [19]; all healthy community dwelling subjects 65-84 years of age performed the test in < 20 seconds without assistance [21]. In a meta-analysis of 21 studies reporting TUG times in healthy older adults, the mean times progressively increased with age with 8.1 seconds (95% confidence interval = 7.1-9.0) among 60 to 69 year olds, 9.2 seconds (95% CI = 8.2-10.2) among 70-79 year olds, and 11.3 seconds (95% CI = 10.0-12.7) among 80-99 year old [22]. The TUG is widely used because of the ease with which it can be performed in the clinic [16] and The combined use of
an accelerometer and rate gyrosensor are able to identify the activity phases of the timed up-and-go test [23]. In addition, the TUG test has been shown to predict a risk of falls in the elderly, are routinely used to screen also for mobility issues [24]. A cut-off score of ≥ 13.5 seconds was shown to predict falls in community-dwelling frail elders, but this score is not verified in other studies [25]. Scores of ≥ 30 seconds correspond with functional dependence in people with pathology [19]. Standardized cut-off scores to predict a risk of falling have not yet been established. The TUG duration correlates with severity of moderate-to-severe Parkinson’s disease [26, 27], and it is sensitive to therapeutic intervention in Parkinson’s disease subjects [28].
It has to be noticed that there are several limitations of the test that has been reported in the literature. The main limitations are not specific to the TUG test and are common among other clinical assessment, and con-cerns variability among instruction given, subjectivity among examiners, and documentation differences [29]. With three highly different subtasks (chair transition, straight-ahead gait, and 180° turn), there is an opportunity for various movement strategies that can compensate deficiencies in these phases because there are a lot of ways to conclude a task for example, in chair tran-sition different distribution of the weight can be used. As a result during the standard TUG test movement deficiencies exhibited on the complex subtasks may be ignored. For example, the 180° turn introduces variability as people with different gait and balance impairments compensate during turns in a different way: subjects may turn on the spot or in a curve [29] introducing variability in tests interpretation.
Other limitations reported in literature are that: the effect of a new medication or therapy could go unnoticed when analyzing the course-grained measurement of TUG duration only[30];
there is the evidence that a 3 meters distance are not long enough to grant high reliability and discriminate among populations [31];
It is known that the performance in a lab setting does not fully repre-sent the abilities of an individual [29], as it does not replicate ecological conditions [9]. People are more aware of the “test” situation in a
lab-oratory or clinical setting and, thus, are more conscientious of their performance, often resulting in better performance [32].
Several variations of the TUG have been proposed to address the limitation of the standard TUG and to perform an additional assessment. Wearable in-ertial sensors are finding application in the objective quantification of move-ment in TUG test. Such sensors, in fact, has been previously used for the evaluation of walking phases during TUG test [33, 34, 35, 36].
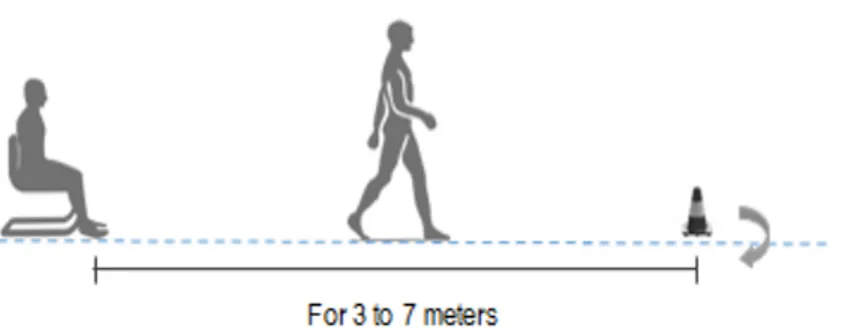
First going deeper on the analysis, it is important to clarify how TUG is deployed (see Figure 1.1). As described by Podsiadlo et al. [19], the TUG is a simple test in which the people have to rise from a chair, walk three meters, turn around, walk back to the chair, and sit down. During the test, the person is expected to wear regular footwear and use any mobility aids that they would normally require. In instrumented version of this test, the distance of the walking part of the TUG is often modified by researchers, to improve the amount of available gait cycles to be analyzed and make some statistical analysis and to get more accurate measures of the various step, as suggested by Wall et al. [37].
Figure 1.1: Experimental setup for instrumenting the TUG with inertial sensors
More studies in literature implement the 3 meters iTUG (instrumented TUG), but most adopt an “extended” version of TUG, from 5 to 7 meters.
The test is repeated at least twice, as suggest by Podsiadlo et al. [19], in that case the first one is considered as an example that helps the subjects to familiarize with the exercise and it is not retained for processing [16, 38, 39, 40, 41].In other cases, three tests are considered and the values reported in the studies refer to the median of the analyzed sessions [42, 43] or the average [31, 44, 45]. To assess test re-test reliability of the measures, the subjects are asked to repeat the protocol a second time during the same session [46, 30]. A crucial step for these studies is the segmentation of the TUG into separate temporal phases that can be described in more detail according to their clinical relevant information. All previous studies are based on the TUG test phases segmentation, however, an automatic algorithm to discriminate the phases is not frequently deployed. The TUG phases are divided as follows:
Sit to stand (SiTS): the subject sits in the chair with its back against the chair back. On the command “go” the subject rises from the chair. Gait: the subject walks straight on from 3 to 7 meters.
Turn: the subject turns around a cone.
Turn to sit: the subject sits down on the chair after taking a turn on itself (into this phase we can find a sub-phase called stand to sit (StTS)).
The algorithms available in literature for the automatic detection of tran-sitions are mainly two ([47, 48]), however, the determination of some pa-rameters in the TUG phases that is done in many research studies (e.g. [49, 50, 3, 51, 52]), demonstrates that some kind of identification of the sin-gle phases was actually done, probably by means of manual labeling. Algo-rithms described in previous studies for automatic TUG phases segmentation are based on the use of a single inertial measurement unit secured or on the lower back or on the chest.
1.1
Algorithms for automatic transitions
de-tection
The automatic detection of test phase transitions during the TUG test can be divided into two main problems. The detection of postural transitions (sit-to-stand and (sit-to-stand-to-sit) and the detection of turnings. The following text will briefly summarize the existing solutions for the two separate problems. In addition, walking detection algorithms can be used to improve the specificity of the segmentation of walking sections of the test.
1.1.1
Sit to stand / Stand to sit detection:
Two main approaches exist for detecting postural transitions depending on the location of the wearable sensor: lower back or chest.
Lower back sensor : Weiss et al. [53] derived these phases from two chan-nels of the accelerometer secured in a proximity of the 3rd-5th lumbar verte-bra with the Z axis oriented along the vertical axis upwards and gyroscope signal in a mediolateral direction (for the axis convention see Figure 1.2). The extraction of the Z Acc measures is described elsewhere by Weiss et al. [16, 54]: during SiTS and StTS it is possible to recognize an “M” shape sig-nal, obtained by the acceleration of the CoM along the Z axis. The minimum Z Acc peak before the signal started to rise from steady state, represent the start of SiTS transition whereas the first maximum peak, corresponding to the end of the transition. The StTS are identified in a reverse way. Acceler-ation, velocities, trajectories and angle, allow to recognize trunk movement such as: seat off ( minimum X Acc within 0.1 sec of first 25% of the vertical trajectory range), end of trunk flexion phase (derivative of the flexion rota-tion was zero) end of trunk rising phase (downward peak vertical velocity after the upward vertical velocity reached zero) and gait initiation (using high frequency component of sensor signal), [55].
Figure 1.2: axis convention
In alternative, some solutions based on signals from the gyroscope, are available [41]. In this case, the peak detection of a low-pass filtered of antero-posterior (AP) accelerometer signal allows detecting SiTS and StTS transi-tion [46].
Chest sensor: Gyroscope signal from upper-trunk sensor [55, 30], has been used to estimate trunk tilt by integrating low pass filtered version of the signal (cut off at 0.65 Hz). The difference between the maximum and minimum values of the filtered trunk tilt at two different times represents an estimation of the trunk flexion and extension in degrees. Posture transitions produced a negative peak in the trunk tilt signal preceded and followed by positive peaks corresponding to the start and the end of the transition. Posture transition candidates were selected by finding all negative peaks of the trunk tilt signal with a -10° threshold. To separate transitions from non-transition and to differentiate between sit to stand and stand to sit, two statistical classifiers based on a logistic regression model were trained using parameters, such as the interval between the two positive peaks, the amplitude of the negative peak, the range of antero-posterior tilt of the trunk.
1.1.2
Turning/ turn to sit detection
Also, in this case, lower back and chest are the main sensors sites that have been analyzed in previous works:
Lower back sensor: Turning measures were derived from the gyroscope signal in a vertical direction (angular velocity VT) [53, 41]. The first peak
represents the turn performed in the middle of the TUG and the second, the turn at the end of the trial. The start and the end point of the turn were determined as the points in the yaw signal in which it crossed 0.1 of the maximum yaw peak amplitude of the turn [53] and were extracted manually from the raw sensor signal of each transition [41]. Greene et al. identifies a turn from the vertical component of the angular velocity recorded by the IMU on the back, which is low-pass filtered, de-trended and normalized. A turn is detected at the occurrence of peaks higher than 0.6 (and separated from the previous and the following peaks by more than 4s) [56]. Nguyen et al. identifies a turn from the vertical component of the angular velocity and angular change about the vertical direction recorded by the IMU on the back. A turn is detected when a heuristically determined threshold is exceeded [57]. Chest sensor: Turns were detected using a mathematical model [30]: to detect 180° turns, the estimated vertical gyroscope signal on the sternum is integrated to obtain the relative trunk angle in the horizontal plane. Turning component appears on the obtained signal as positive or negative ramps depending on the direction of turns. Since the sensor attached to the trunk could have a small inclination relative to the horizontal plane due to the anatomy of the sternum, a difference in the angle before and after turns could be smaller than 180°.
They have been used for discriminating the turning also the device put into the ankles as:
Ankle sensor: Trojaniello D, et al. identifies a turn from the medio lateral component of the angular velocity recorded by the IMU at the ankle. The angular velocity is first rectified and low-pass filtered, and as the instanta-neous value drops below the 50% of its average value, then a turn is detected [58].
1.2
Tug Phases - Parameters
Once a TUG phases segmentation is available, previous studies focused on the instrumental evaluation of each single phase. Among the variety of pa-rameters observed using inertial sensors, the time duration of the phases is
still the most commonly evaluated one. In fact, the not instrumented TUG consists in records the number of seconds that subject takes to perform the task using a stopwatch; therefore, the measure of the duration of the test phases the way to reconnect the iTUG to the TUG. However, in this section, the parameters that have scientific interest for PD detection and assessment in the TUG test are reported.
1.2.1
Sit To Stand
Rising from a sitting position is one of the most common daily tasks. Muscu-loskeletal, movement control and balance impairments affect the sit-to-stand (SiTS) transfer. The accurate control of the Center of Pressure (COP) po-sition in relation to the Center of Mass (COM) is important as it allows a controlled transfer and aims the maintenance of postural stability. Problems with range, flexibility, and strength in the lower limbs and trunk, together with movement control impairments will impact speed, COP position, and control during the task. For these reasons, it is important to extract some parameters that characterize the stage of examination as:
Peak and average, angular velocity. Range of motion, ROM.
Range of acceleration signal.
Root mean square, RMS of acceleration and angular velocity signal. Normalized jerk: normalized acceleration time derivative [g/s] or
an-gular velocity derivative [°/s2]
Some studies using these parameters allowed to discriminate the presence or not of the disease (Wilcoxon rank sum test [59, 9], unpaired t-test or Mann-Whitney [16, 60, 59], show p-value < 0.05) with the use of a single inertial unit positioned on the lower back during sit to stand. However, it is unclear whether it will be possible to discriminate the early stage (H&Y=1) in this phase [61].
1.2.2
Gait
Walking detection to detect walking transition during TUG test is typically based on two sensors on the shanks. It is usually based on shank angular velocity in the medio-lateral (ML) axis [62]. The algorithm by Salarian et al. was developed to extract the precise stance of initial contact (heel strike) and terminal contact (toe off) of the feet. First, it identifies the mid-swing of the shank angular velocity as the local maximum peak of the signal then it looks for the local minimum peaks of shank angular velocity inside interval time [mid-swing ± 1.5 sec] to identify the events that discriminate gait phases.
A common symptom of Parkinson’s disease is the gait alteration. This commonly includes the inability of a person to swing their arms naturally while walking, taking short shuffling steps and ”freezing spells” (difficulty starting to walk and difficulty stopping). This highlights the importance of this phase, during which it is possible to extract time parameters and spatial parameters as in detail below:
Cadence, a number of steps per minute.
Step time, the time between two consecutive supports with the opposite foot in seconds.
Stride time, the time between two consecutive supports with the same foot and its variability evaluated in terms of its coefficient of stride time variability and the coefficient of variation (CV) of stride time.
Arm oscillation, the oscillatory movement of the upper limbs measured in degree.
Swing width, maximum of lateral deviation of foot trajectory during swing phase of gait.
Peak swing velocity and Peak angular shank velocity.
The covariance of this measures (CoV) per seconds is also evaluated over all gait cycle in the trial measured in degree per seconds.
Peak angular velocity of the trunk, in degree per seconds.
Asymmetry, a difference of the left and right side parameters divided by the fastest, reported as a percentage.
Harmonic ratio (HR), calculated by dividing the sum of the amplitudes of the in phase harmonics by the sum of the amplitudes of the out of phase harmonics of an accelerometric signal during stride.
Phase measures the step time with respect to the stride time assigning 360° to each stride (gait cycle), denoted in degrees [31].
Apparently literature shows some inconsistencies in the calculation of trunk ROM and in normalized jerk; in fact, it is possible to find a different study with conflicting results in term of capability to discriminate the presence/absence of the pathology. In the first case as regards the calculation of the trunk ROM, in fact, Zampieri et al. [45] has identified in the trunk rotation range of motion, in the yaw axis, a parameter that discriminates significantly (p-value = 0.041) controls group from pathological, while Salarian et al. [30] argues that the parameter is not sufficient to discriminate the two popula-tions (p-value = 0.12). The difference lies in the choice of data, despite the two works refer to the same subjects, Salarian et al. [30] applied a test re-test reliability, people performed the test 3 times first then repeated 3 more times after one hour (takes into account the average of all tests), while Zampieri et al. [45] consider the average of 3 exercises only. This diversity causes a discrepancy for what concerns the calculation of another parameter, the asymmetry. The result that emerges from the calculation of the cadence is relevant: parameters calculated from the data of the lower back are not able to identify the presence of the pathology. In spite of everything it is possible to discriminate the presence or not of the pathology considering the number of step made during the gait (sensor lower back) ([40, 38, 63, 39, 46]).
Differently, Gait Stride velocity and Stride time can be used as discrimi-nating parameters only for Parkinson patient in an OFF state of the medica-tion. In such conditions, all the difficulties introduced by the pathology are emphasized. The result obtained for the step time is in line with the cadence
ones, in fact, it is not possible to discriminate the population of controls of PD using a lower back sensor and analyzing the temporal parameters like cadence and step time ([40, 63, 30, 38]). During gait, Hoskovcova et al. [40] identify in the stride time variability a marker that correlates with the fall risk, basing on a logistic regression model. This model predicted fallers as patients having 7.2 % stride time variability in the OFF state and cadence in the OFF state greater than 80 (steps/min).
Estimation of step-by-step spatio-temporal parameters of normal and im-paired gait, also in Parkinson disease, using shank-mounted magneto-inertial sensors was evaluated by Trojaniello et al. [64]. The method detects gait events taking advantage of the cyclic nature of gait and exploiting some lower limb invariant kinematic characteristics. A combination of a IMU axis realignment along the direction of progression and of an optimally filtered direct and reverse integration is used to determine the stride length. Over the 4,514 gait cycles analyzed, neither missed nor extra gait events were gen-erated. The errors in identifying both initial and final contact at comfortable speed ranged between 0 and 11 ms. The stride length was estimated for all subjects with less than 3% error.
1.2.3
Turn
For Parkinson’s disease (PD), turning is among the most frequent causes of freezing and falls. This widely reported loss of movement continuity and/or postural stability is also known as ‘Dysfunctional Turning’. Optoelectronic system using for movement analysis has illustrated the complexity of the walking turn. The control of head direction in advance of any changes in locomotion provides a stable frame of reference during turning. The request to turn around a cone is specifically designed to create more problems to the subjects with PD since the patients are required to turn in small space to change the sense of march. That increase the movement indecision of the patience. The evaluation of the steps number parameter is also affected by the same problem [43, 42, 30].
1.2.4
Turn To Sit
This phase can be further divided into two sub-phases: turning and stand-to-sit (StTS), [31, 16]. During StTS, the sensor put on foot only [9] allow discriminating the presence of pathology in patients during ON or OFF med-ication. However, sensors placed in CoM [16, 31] do not allow to discriminate the presence or not of the pathology, but allow to discriminate within the pathology some aspect of the disease (i.e differences between PIGD -postural instability and gait disorder and TD- tremor dominant) [38]. It is possible to observe contrasting results concerning the normalized jerk [16, 31], which does not seem to be related to a different population of PD (In terms of H&Y) rather from a different numerosity.
Chapter 2
Experimental Setup,
instrumentation, Android
software & Firebase console
The thesis revolves around the analysis of data coming from wearable sensors during the execution of the timed up and go test, then it is important to outline the steps that led to the collection of the inertial data. First, it is significant to twist a strong bond with the clinician to identify the subjects who can best benefit from the instrumented TUG test (iTUG); in fact the experiment did not only and exclusively characterize the pathology but also have to give elements useful to discriminate the presence of the disease in subjects who were at an early stage of the disease (early diagnosis). Such strong collaboration is necessary because an expert clinical eye can easily identify physical, behavioral and psychological “patterns” characteristic of the disease that can be before the manifestation of evident symptoms. From the technological point of view, the first phase of this thesis involved the choice of the device and subsequent modifications to obtain the performance required. Then the implementation of an application in an Android operating system is described. The Android application has been designed and tested to allow the acquisition and synchronization of data from wireless sensors for later analysis.
2.1
Subjects
Six Inertial sensor unit were placed on participant during tests using elastic bands. One sensor was secured in the region around the third lumbar ver-tebrae L3, (close to the body center of mass, CoM), two were placed on the anterior aspect of the right and left tibia (R/L shank), another on the chest and the last two devices were placed on the right and left wrists.
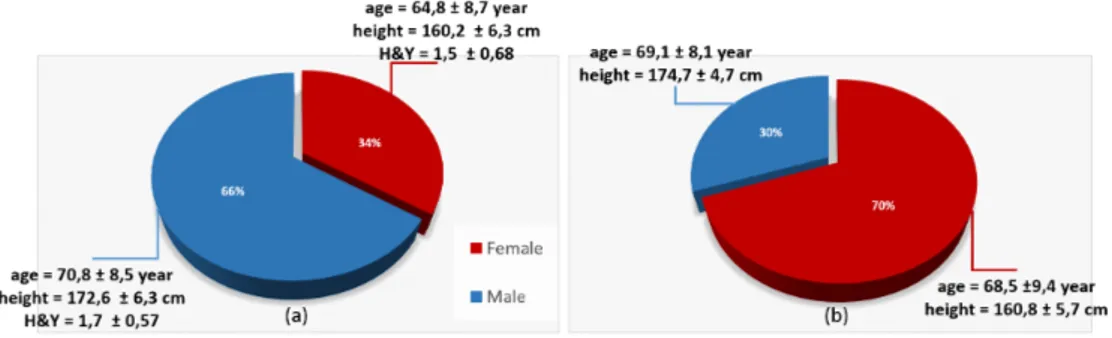
Figure 2.1: Gender of PD a) and CTRL b)
2.1.1
Patients
For the patients selection have been identified, subjects suffering from Parkin-son who had stage of the disease from 1 to 3 Hoehn &Yahr rating scale. All subjects had no further neurological disorders were thus able to fully under-stand the task requested. Not also had no other problems related to the gait, if not the problems linked to the advance of age.Were excluded two subjects, as in one case the subject was subjected to hip prosthesis and another case where the subject wearing of corrective plantar following an asymmetry of the column.
For analysis purposes, only data acquired by 32 of the subjects were used. In fact, only data from those who were able to complete the test without any kind of aids were retained: 9 subjects from PD group, due to the severity of the disease, either failed to complete the test in complete autonomy, or also had serious cognitive impairments that did not allow them to understand the instructions required for the test. The population examined was classified
according to various criteria to have to ease results interpretation. A first subdivision took into account gender, see Figure 2.1(a): 66% of the people were male 70,8 ± 8,7 years old, height 172,6 ± 6,3 cm and Hoehn & Yahr scale (H&Y) 1,7 ± 0,57 and rest were female 64,8 ± 8,7 years old, height 160,2 ± 6,3 cm and H&Y scale 1,5 ± 0,68. A second grouping was done according to the UPDRS rating scales and H&Y (Figure 2.2
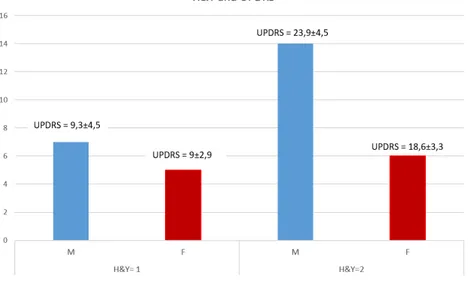
Figure 2.2: Subdivision of patience based on H&Y scale and gender taking into account the differences between male and female), in Figure 2.2 the subdivision of gender is important to notice the value of the UPDRS Vs H&Y score. In fact, in the first part on the left, where H&Y=1 there is not any difference in UPDRS between male and female but something change in the second part on the right, where H&Y=2 and there is a greater value in the UPDRS score of male than woman. These differences result from the different meaning of the scale, one highlights the ability to carry out activities of the daily living, the other tracks the evolution of the disease.
A further graph shows the limb that was first involved in the disease by taking into account only the value of the H&Y scale (Figure 2.3). In the first stage of the pathology according to the H&Y scale, a prevalence in side involvement is not evident, whereas the same cannot be said for stage 2, in
which a prevalence of left side is usually observed.
2.1.2
Control group
All data collected from the control group has been analyzed off line. Nobody claimed to suffer problems related to walking or balance and also as it can be seen from the Figure2.1(b) although there is no gender match, the control group has been recruited to grant age-matching in relation to the pool of available PD patients. In fact, parameters in healthy subjects vary with age as all those degenerative musculoskeletal, bone and bone-related degradation factors pass through time. As regards Parkinsonism the gender of the pa-tient has a strong importance: it has been observed that the disease is most affected by men but it is more severe in women.
2.2
Hardware platform
The platform is composed of a set of 6 wearable sensor nodes (developed at the premises of Scuola Superiore Sant’Anna, [65]) sending data to a central unit (smartphone) that performs data synchronization and storage (Figure 2.4). In this implementation, the central unit is a high-end system that runs the application under the Android Operating System.
Figure 2.4: Block diagram of the node component
Figure 2.4 illustrates the block diagram of the main logical components of a node. Every node is powered by an ultra low-power Nordic nRF51822 mi-crocontroller with embedded 2.4Ghz transceiver; an InvenSense MPU-9150 9-axis IMU; an integrated on-board chip-antenna with 20m range indoors/80m range outdoor,; an USB port, some I/O devices (3 LEDs, 2 buttons and a buzzer) and six GPIO (that can be used both for digital I/O or as analog input with ADC) to have the flexibility to expand the board with other sen-sors, like ECG, EMG, etc. The node is powered by a single cell LiPo battery that guarantees more than 20 hours of continuous use and can be charged using both USB or wireless recharge. The nRF51822 microcontroller is built around a 32-bit ARM Cortex-M0 CPU with 256kB flash and 16kB RAM, and incorporates a rich selection of analog and digital peripherals. The embed-ded 2.4GHz transceiver supports Bluetooth 4.0 low energy, in the first release but for this experimentation the need to stream raw data, with a sampling rate of 100Hz, from 3 channel accelerometer and gyroscope, led us to take a step back towards the Bluetooth 2.0 that enables greater data transfer rate (3Mbps versus 1Mbps of -Bluetooth 4.0).
The IMU is an InvenSense MPU- 9150, which combines a 3-axis MEMS gyroscope with a sensitivity up to 131 LSBs/dps and a full-scale range of
±250dps, a 3-axis MEMS accelerometer with a programmable full scale range of ±4g, a 3-axis MEMS magnetometer with a full scale range of ±1200µT. The MPU-9150 features three 16-bit analog-to-digital converters (ADCs) for digitizing the gyroscope outputs, three 16-bit ADCs for digitizing the ac-celerometer outputs, and three 13-bit ADCs for digitizing the magnetometer outputs. The DMP acquires data from all sensors and streams the data to the central unit with an output frequency of 100 Hz.
2.2.1
Time synchronization
In a wireless network like the one used in this setup, the analysis of gathered data is performed by processing measurement samples coming from the six different nodes of the network. In order to minimize the error, it is important to elaborate samples acquired at the same instant, especially if the nodes are used to monitor the dynamic of some physical variables, as in limb motion tracking. It is known that the amplitude of the error increases with the temporal misalignment among the samples.
The goal of time synchronization is to accurately represent data events from multiple sensors (or nodes) on one common timeline. This could mean synchronizing the clocks of nodes to match a global time, or it could mean finding the offsets necessary to synchronize nodes to a moment in time. Re-gardless of the time sync method, every data event can be represented by a time stamp based on the equation 2.1
τM EAS = τT RU E + eSY N C+ eM EAS (2.1)
where τM EAS denotes the measured time of event, which is composed of three
components, τT RU E(the true time when the event occurred), eSY N C (the error
introduced by the synchronization error), and eM EAS (the error introduced
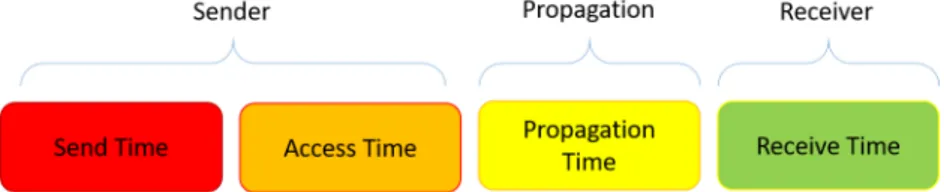
by the measurement method of the application). The synchronization error is caused by the uncertainties of time that occur when a sender node sends a time stamp to a receiver node. The error can be broken down into four components (Figure 2.5): Send Time, Access Time, Propagation Time, and Receive Time [66].
Figure 2.5: Message Uncertainties that contribute to Synchronization Error Send Time: This error comes from time spent to construct the
mes-sage to be sent. Uncertainties stem from scheduling within the oper-ating system and from the time needed to transfer the message to the Network Interface Controller (NIC) for transmission.
Access Time: Each packet faces some delay at the medium access con-trol (MAC) layer before actual transmission. The sources of this delay depend on the MAC scheme used, but some typical reasons for the delay are waiting for the channel to be idle or for the time division multiple access (TDMA) slot for transmission [66].
Propagation Time: This is the amount of time it takes the message to travel from the sender to the receiver. In one method of time syn-chronization, it is assumed that a reference signal arrives at two sensor nodes at the same time. Because of the finite speed of the signal, there would be some unknown time difference between the arrivals. This is also attributed to this type of error.
Receive Time: This error comes from the time spent in decoding the message.
In this work, an opportunistic synchronization is accomplished with nodes by correlating their reference broadcast recording with the reference broadcast recordings of other nodes. The only requirement is that an RF signal must be recorded at every node while the event of significance is recorded / time stamped. When a data event occurs, a small snippet of the FM Radio broad-cast is recorded and saved as a flag (2.3). This is done for all sensors. To
synchronize the nodes, a time offset has to be calculated in order to realign the signals according to the previously set flags.
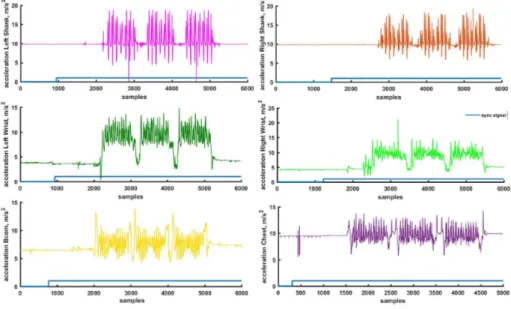
Figure 2.6: Example of inertial data synchronization from 6 different devices In Figure 2.6 it is possible to notice how the synchronization has been carried out on 6 different devices. For simplicity, the sync signal was plotted over the accelerometric channel, but the result would be the same for any of the available channels. By looking at the figure, the sequence of device connected to the central unit is reported, the device that has a greater number of samples before the change in status of the flag (from 0 to 1) was the first to be connected to the smartphone (the procedure will be analyzed in detail in 2.3). In the example, the connection sequence is as follows: R-Shank (device positioned on the right shank) – > R-Wrist (device on the right wrist) – > L-Shank (device on the left shank) – > L-Wrist (device on the left wrist) – > CoM (device on 3/5 lumbar vertebra) – > Chest (device placed across the chest).
To synchronize all devices it is important to correct the offset (number of samples before the flag takes the value 1) for all of them.
2.3
Android Application- PDdataProtocol
Icon Android Application
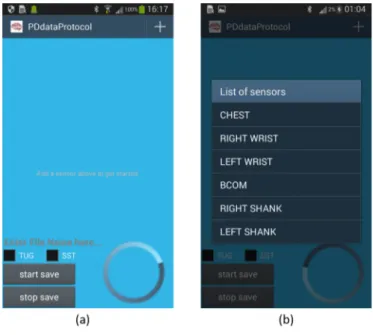
A dedicated custom-made Android application allows the users to con-nect, synchronize, stream and save data from wearable sensors during the exercises. This section explains in detail the steps that led to the implemen-tation of the Android Application (App) whose main activities are shown in Figure 2.9
The App can be executed by clicking on the icon depicted in Figure 2.3. The main activity is then displayed on the screen as depicted in (Figure 2.9(a).
2.3.1
Main Activity
This Android Activity allows the user to:
set the type of the exercise using the CheckBox, TUG (Timed Up And Go Test) or STS (Sit To Stand)
choose the name of the main folder in which the system will save the acquired data. During data acquisition procedure all sampled data from the six devices are stored in six different .txt file into the main folder;
start saving data
starting a synchronization signal that is possible to read in the last column of every .txt file
stop the acquisition with the disconnection of the devices. At the bottom right, a progress bar is available (see Figure 2.7
Figure 2.7: Progress bar
indicating the elapsed time from the beginning of the acquisition. Con-cerning TUG, the progress bar helps in determining the remaining time for the test. In this activity the most important role is given to the Start button, in fact its pressure calls the methods “start saveDATA” reported in
Figure 2.8: Start SaveDATA method
Figure 2.8, that set the flag for synchronization and activates the services related to the device connection.
Figure 2.9: Android Activities
2.3.2
List item changes Activity
In the top left of the Android main activity ( Figure 2.9(a)), by pressing
+
it is possible to open a ScrollView, the View that contains the list of devices used to capture data. ScrollView is defined in the activity layout as seen in Figure 2.10. Note that this LinearLayout, within the ScrollView, has the ”animateLayoutChanges” property set to true. This allows the framework to automatically animate child views (in this case, rows) as they are added to and removed from the LinearLayout. The user can select devices and can also remove devices from the list using this interface.Figure 2.10: ScrollView
For example, after clicking on item Chest, the application framework provides access to the Bluetooth functionality through the Android Bluetooth APIs and connects to the selected “Chest” device. In particular, using the Bluetooth APIs, the App performs the following:
Scan for other Bluetooth devices, in this case, in particular, it scans for a specific mac-address previously set to associate with the sensor to its
location in the body (mac-address IMU secured on the Chest=”80:C3:B6:2D:D6:96”). In order to use Bluetooth features in the application, it is important
to declare the Bluetooth permission “BLUETOOTH”. This permission allows performing any Bluetooth communication, such as requesting a connection, accepting a connection, and transferring data. If it is a need that the App initiates device discovery or manipulate Bluetooth settings, it is necessary to declare the BLUETOOTH ADMIN permis-sion as well in the application manifest file (Figure 2.11).
Figure 2.11: Android Manifest-Bluetooth Permission
Query the local Bluetooth adapter for paired Bluetooth devices. After the IMU-Chest accepts the pairing request, the two devices, IMU and
Smartphone complete a bonding process where they exchange security keys. After the pairing and bonding processes are complete, the two devices exchange information.
Establish RFCOMM channels using the BluetoothAdapter that allow transmitting data.
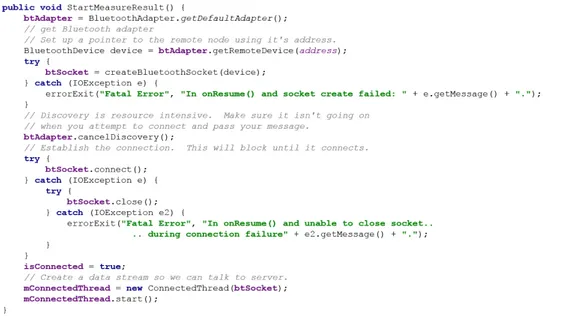
Connect to the Chest sensor through service discovery. In order to create a connection between two devices, it is important to implement both the server-side and client-side of the connection because one de-vice must open a server socket, and the other one must initiate the connection using the server device’s MAC address. The server device and the client device each obtain the required BluetoothSocket in dif-ferent ways. The server receives socket information when an incoming connection is accepted. The client provides socket information when it opens an RFCOMM channel to the server. This section has been developed with the method StartMeasureResult reported in figure 2.12
Transfer data from IMU-Chest to the App using a buffer. To read data from the buffer the App use the method Run (Figure 2.13)
Reading data from the buffer is the core of the data collection. In this case each data packet consists of 20 Bytes, the first 8 bytes, from byte 0 to 7, belong to the header, the others represent the inertial data: from byte [8] to byte [13] identify the acceleration data, from byte [14] e byte [19] identify the angular velocities. To have the acceleration along an axis, we need a couple of adjacent bytes (byte [8] and byte [9] for acceleration along x axes and so on) then the data is converted to signed integers. The same procedure has been done for all the axes of accelerometer and gyroscope. Every time a data item is available, this is saved in a file using the myPrintWriter object (Figure 2.13).
Thanks to this API, the App can manage multiple connections (six in this specific setup) implemented in this App with six different services that im-plement all we have seen so far.
2.4
Firebase (Real Time Analysis)
It is a mobile and web application development platform developed by Fire-base, Inc. in 2011, then acquired by Google in 2014. It shows a lot of service from a firebase analytics that is a cost-free app measurement solution that provides insight into app usage and user engagement to a firebase Auth, a service that can authenticate users using only client-side code. It supports social login providers Facebook, GitHub, Twitter and Google but for the thesis porpoises it is important the Realtime Database. Firebase provides a realtime database and backend as a service. The service provides application developers an API that allows application data to be synchronized across clients and stored on Firebase’s cloud. It provides client libraries that en-able integration with Android (to upload data acquisition from the Android device to firebase) and Node.js applications (server-side).
Figure 2.14: workflow Firebase console
As can be seen from the figure 2.14, they have done the TUG test and collected the data from the 6 inertial sensors, it was possible to upload 6 different files on the real time Date Base available from Firebase. From the console you can request the analysis of the acquired data, which is processed in real time and displayed in the results folder . Firebase also allows to download all the files that have been uploaded to the DB, but also the results file produced by the processing.The figure shows the flow of data starting from the acquisition during the experimental test until a partial analysis real time. The power of this tool is the ability to be able to request processing of acquisition, by the application itself installed on your smartphone but at the same time to be able to track for future analysis in a database realized ad hoc. You can also delegate the processing of data to a remote server without having to depend on the technology present on your smartphone.
2.4.1.1 Firebase console
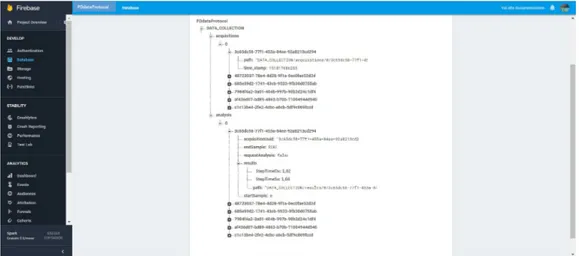
In the figure 2.15 it is possible to observe the Firebase console created for data acquisition from six inertial sensors. On the left you can observe all the features present in the platform used, while in the central part it is possible to observe how it has been achieved the Data Base.
In the latter it is possible to identify two sub folders:
Acquisition: Inside you will find all the subjects who have participated in the experimentation, identified by a growing numbering (in the figure we can see the subject 0). Each subject are associated six separate files, derived from the data acquired by the six sensors available. Each file has an alphanumeric code that allows you to connect to the analysis itself and that will be unique for each file. For each file you can view the directory in which it is located and the time stamp referred to the moment in which it was uploaded the file.
Analysis: Inside you will find all the subjects who have participated in the experimentation, identified by a growing numbering (in the figure we can see the subject 0). Each subject are associated six separate files, derived from the data acquired by the six sensors available. Each file has an alphanumeric code that allows you to connect to the analysis itself and that will be unique for each file. Each file has the ability to view the results of a different nature reflecting the various analyzes that have been carried out starting from the data of sensors in different locations in the body.
Both the sides related to the acquisition that the analysis, is managed server side by an application in javascript.
2.4.1.2 C Library
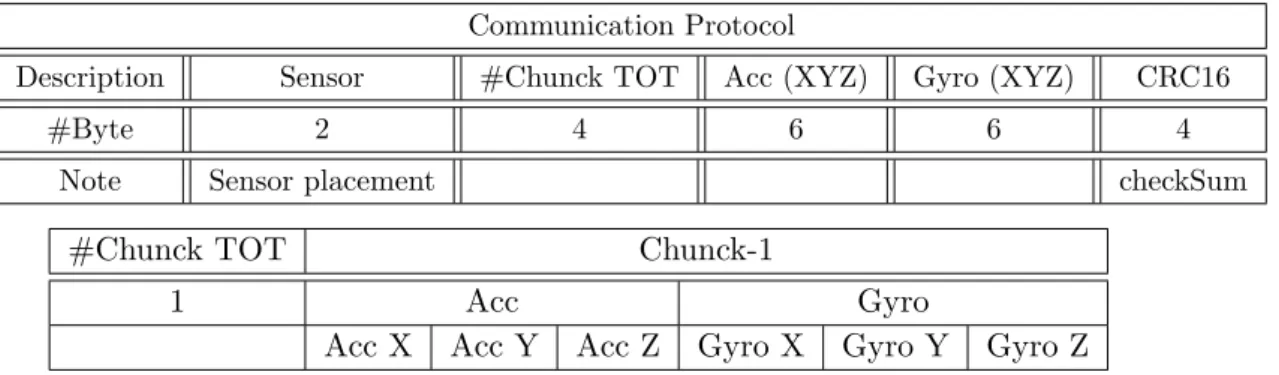
The C libraries represent the heart of the analysis, in fact allow, fixed a diagram of data transfer 2.1,, performing the parsing of the input file by checking the integrity of the input data thanks to checksum, perform the analysis and finally to provide the synthetic result (Firebase Console) , and a results file containing more detailed information.
The libraries were created starting from the Matlab code used for the off-line data analysis, in order to evolve the analysis in a real-time condi-tion. These allowing to replicate the greater number of analyzes carried out initially off-line.
Communication Protocol
Description Sensor #Chunck TOT Acc (XYZ) Gyro (XYZ) CRC16
#Byte 2 4 6 6 4
Note Sensor placement checkSum
#Chunck TOT Chunck-1
1 Acc Gyro
Acc X Acc Y Acc Z Gyro X Gyro Y Gyro Z
Table 2.1: Communication Protocol from App Android To Firebase After having tested the libraries, these have been compiled in a Linux environment and run on the server side every time in which it was carried out a request for analysis.
Chapter 3
Data Analysis: iTUG
segmentation and parameters
extraction
The data analysis purposes are two-fold. First, the analysis targets the sim-plification of the experimental setup that is needed for a reliable segmentation of TUG phases and for the estimation of gait parameters, then locate those parameters which can be calculated using sensors located in different points of reference so as to reduce the complexity and number of devices in the set-up, to do this we have gone to the comparative analysis of methods in literature. Secondly, it aims at finding features for discriminating the pres-ence of the pathology and estimate its severity level. This analysis has been following an incremental approach, where for incremental means an increase in the inclusion criteria in the clusters selected for scanning. We started by considering as a first step a single macro subdivision of the subjects who par-ticipated in the trial : pathological subjects and control subjects. A further breakdown of the two populations was made based on gender, and only then identified three clusters: Side affected (body side who first showed symptoms of the disease, i.e tremor), Hoehn &Yahr scale (0-3) and UPDRS scale
3.1
Data pre-processing
Inertial data acquired from smartphone embedded sensors is processed in a first step of the Thesis, offline using Matlab MATLAB® (Math- Works, Inc., Natick, MA, USA) than using the same methods, on the basis of the results obtained from the analysis in Matlab, were implemented C libraries for the real time analysis.
Kinematics data were then filtered using a 2nd order Butterworth band-pass filter with cut-off frequencies of 0.2 and 12 Hz. Pre-processed signals were used to extract information on postural transitions, gait parameters and turnings as described in detail in this chapter.
3.2
TUG phases segmentation: transitions
TUG phases segmentation takes the start from the detection of postural transitions that trigger phases transitions during the test. The detection of transitions is to determine the moments in which the subject sitting in chair (stand to sit, StST), rises from the chair (sit to stand, SiST) and walks in the direction of the cone, walks around it (turning) and comes back to sit down in the chair (turn to sit). Algorithms for detecting transitions are summarized in following lines.
3.2.1
SST (sit-stand transition): comparing methods
Starting from literature[48, 30], two methods previously proposed by Najafi et al. [48] and Salarian et al. [30] as been implemented:
Figure 3.1: SST transition using method’s Najafi
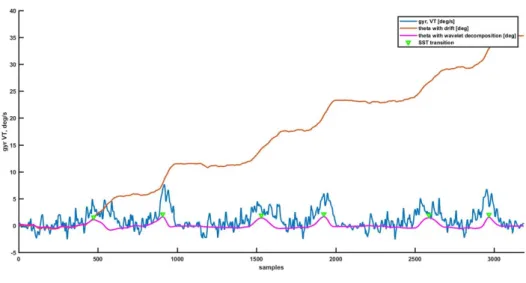
The postural transitions, sit to stand (SiST) and stand to sit (StST) were detected based on the change of trunk tilt in the sagittal plane which was computed from the integral of the gyroscope signal in the vertical direction (indicated as theta in the Figure 3.1) from the sensor placed on the chest. The gyroscope signal was first segmented into 1-min intervals than was integrated. In order to cancel the drift and to eliminate noise from other sources such as movement artifact noise, the discrete wavelet transform, DWT, with decomposition into nine scales by “Coiflet order five (Coif5)” mother wavelet was used. The scales of five and nine provide the best approximation of StSt and SiSt transitions. The frequency band corresponding to these scales is 0.04–0.68 Hz. In Figure 3.1 it is possible to observe how the peak detected in theta signal after drift and noise correction correspond to the postural transitions.
Figure 3.2: SST transition using method’s Salarian
in this algorithm StST and SiST transitions were detected and ana-lyzed using the trunk sensor secured on the chest. Gyroscope signals were high-pass filtered with a cut-off frequency of fc=0,034 Hz that is significantly lower than the typical frequency of the transitions of the healthy elderly but allow to show transitions of PD patients. The signal was then low-pass filtered using a FIR filter to remove the movements of the trunk during walking and any effect of tremor. Selecting a very low cutoff frequency for this filter would attenuate the signal in case of fast posture transitions and a high cutoff frequency could not remove artifacts of slow walking. Taking into account this information, the signal was filtered with a cut-off frequency fc= 0,65 Hz. At this stage, the signal was integrated in time to produce relative trunk tilt (theta in Figure 3.2). Posture transitions produced a negative peak in the theta signal preceded and followed by positive peaks corresponding to the start and the end of the transition. Then the peaks as reported in Figure 3.2 represent the transitions of interest.
In this study, previous methods were both tested by using a different sens-ing location. In particular, the considered angular velocity recordsens-ings were acquired from a sensor located in the center of mass, BCOM. The use of the
two methods has been made necessary because the first method ([48]) has been applied to the group of control while the second one ([30]) which takes into account the tremor brought in people with PD, was used to discriminate the transitions in pathological subjects.
Figure 3.3: Methods utilized in the study (a) Najafi and (b) Salarian In Figure 3.3 it is possible to observe an example of using the two algo-rithms on a control subject (Figure 3.3, a) and on a PD subject, 3.3(b). In both examples, all the postural transitions have been identified correctly.
The next chapter 4.1 highlights the errors made in the use of data from the BCOM compared to Chest in both methodologies. The decision to use the data from the BCOM, comes from the idea of being able to simplify the experimental setup, reducing the number of sensors, and then find al-ternatives compared to the literature, in order to extract the parameters of interest.
Concerning the SST transitions, in this thesis the previous work has been extended by proposing an automatic method for postural transition detec-tion during TUG test based on machine learning methods [67]. In particular, data from trunk sensor only were retained for processing. Postural transi-tions were identified in two steps. First postural transition candidates were identified by applying a low-specificity threshold on trunk tilt estimates and then, the obtained candidates were classified by extracting a set of features from inertial data in correspondence of the candidate transition, in a similar fashon to what previously done by Salarian et al., [47]. Feature vectors were
then classified by means of machine learning methods to automatically rec-ognize if candidate events were actually transitions or not. In particular, six classification strategies were compared (random forests RF, support vector machines SVM, decision tree J48, logistic regression LogReg, naive Bayes NB and k-nearest neighbor kNN). Differently, from previous works, the leave-one subject-out cross validation was applied to evaluate the methodology [67].
To compare the methods in the literature with those proposed above, were calculated the box plots of the bias between the proposed methods and their respective in literature. It was also calculated the average value of the bias made using the new algorithm compared to previous works in terms of time differences in the detection of transitions using different algorithms, expressed in samples.
These differences are expressed as mean and standard deviation and mean absolute error (MAE), calculated according to the equation 3.1
M AE = n X i=1 |ei| n (3.1)
In order to better understand algorithm behavior in detecting transitions, coefficients of sensitivity and specificity were also calculated according to equations 3.2 and 3.3 SE = a a + c (3.2) SP = d b + d (3.3) where:
Sensitivity (SE): also called true positive rate, recall, or probability
of detection; measures the proportion of positives that are correctly identified as such
Specificity (SP): also called the true negative rate, measures the
pro-portion of negatives that are correctly identified as such
3.2.2
Turn
The discrimination of the turning is based on the use of the gyroscope secured on the BCOM, as it was done for the transitions identification. In this case, the interest falls on the calculated angular velocity along the medio-lateral axis, this signal in fact once integrated, allow the detection of the 180 degrees of the trunk (theta). As it is possible to observe in figure the minimum of theta close to the front in slope of the zero crossing represents the beginning of the turning phase. In Figures 3.4 it is possible to see another angle, phi, that identifies the rotation in the transverse plan. During the unwinding of a single repetition of the TUG it is possible to discriminate two turnings: one, around the cone and other called turn to sit that brings back the subject in such position to be able to sit down again.
Figure 3.4: Turning detection
During this phase, the spatio-temporal parameters that have been ex-tracted are expressed in terms of mean value, standard deviation and p-value